Abstract
We acquired diffusion tensor images on 33 normal adults aged 22–64 and 15 adolescents aged 14–21. We assessed relative anisotropy in stereotaxically located regions of interest in the internal capsule, corpus callosum, anterior thalamic radiations, frontal anterior fasciculus, fronto-occipital fasciculus, temporal lobe white matter, cingulum bundle, frontal inferior longitudinal fasciculus, frontal superior longitudinal fasciculus, and optic radiations. All of these structures except the optic radiations, corpus callosum, and frontal inferior longitudinal fasciculus exhibited differences in anisotropy between adolescents and adults. Areas with anisotropy increasing with age included the anterior limb of the internal capsule, superior levels of the frontal superior longitudinal fasciculus and the inferior portion of the temporal white matter. Areas with anisotropy decreasing with age included the posterior limb of the internal capsule, anterior thalamic radiations, fronto-occipital fasciculus, anterior portion of the frontal anterior fasciculus, inferior portion of the frontal superior longitudinal fasciculus, cingulum bundle and superior portion of the temporal axis. Sex differences were found in the majority of areas but were most marked in the cingulum bundle and internal capsule. These results suggest continuing white matter development between adolescence and adulthood.
Keywords: Age, White matter, Magnetic resonance imaging
Introduction
Diffusion tensor imaging is an MRI methodology that, by measuring the direction of movement of water molecules, can be used to infer the orientation and alignment of axonal tracts [1]. In healthy myelinated axon bundles in which all the axons are aligned, the movement of the water is restricted by the axonal membrane and the myelin sheath. Bundles in which the fibers are crossing or are oriented in many different directions or in which the myelin or axons are unhealthy may allow less restricted directional diffusion of water [2]. Diffusion tensor assessments yield a measure termed anisotropy, high when water diffusion is limited in direction such as in the corpus callosum and low when there is unrestrained or random water movement [3].
Myelination begins in the brain prenatally and is largely accomplished during the first 2 postnatal years [4]. Unlike the rest of the brain, myelination continues in the neocortical association areas into adolescence and adulthood, especially in the frontal and temporal lobes [5, 6]. Development of the prefrontal cortex during adolescence is significant and marked changes in physiological indices of prefrontal function such as EEG occur during this period [7]. This is the first study of the differences in white matter between adolescence (ages 14–21) and adulthood using diffusion tensor imaging.
Several studies have shown a general increase in anisotropy during the time between infancy and adolescence. Schneider et al. [8] found that anisotropy increased from the neonatal period through age 16 in deep white matter areas in frontal, parietal, temporal and occipital regions. In a study of 153 subjects between the ages of 1 day and 11 years, Mukherjee et al. [9] found an increase in anisotropy in the corpus callosum, internal capsule, caudate nucleus, lenticular nucleus and thalamus. An increase in anisotropy with age between ages 5 and 18 was found in the internal capsule, corticospinal tract, left arcuate fasciculus and right inferior longitudinal fasciculus, and a decrease in two small clusters next to the frontal horn of the lateral ventricles and adjacent to the caudate nucleus bilaterally [10]. Schneider et al. [8] found increased anisotropy in the pons, crus cerebri, posterior internal capsule, frontal, temporal, occipital and parietal white matter, genu and splenium of corpus callosum with age in children aged 0–16.
Klingberg et al. [11] showed an increase in anisotropy in frontal white matter between childhood (mean age 10) and adulthood (mean age 27). Similarly, Ben Bashat et al. [12] found an increase in anisotropy in the corpus callosum, internal capsule, and subcortical white matter from infancy to age 23.
Anisotropy has been found to decrease starting in early adulthood and continuing throughout the lifespan. In a sample of adult men between the ages of 23 and 76 years, a decrease in anisotropy was seen by Pfefferbaum et al. [13] in all regions studied except the splenium. Nusbaum et al. [14] showed a decrease in anisotropy with age in adults between the ages of 20 and 91 years in the periventricular white matter, frontal white matter, and genu and splenium of the corpus callosum and an increase in anisotropy with age in the internal capsule bilaterally. However, an examination of 16 regions of interest (ROIs) by Yoshiura et al. [15] failed to reveal any statistically significant age effects in young adults (age 20–40). We noted the lack of direct comparisons between late adolescents and adults in a single study. A consideration of these studies suggested the need for a detailed comparison of the adolescent and adult periods.
The brain develops in a progressive manner in which lower-order areas such as subcortical regions and primary sensory and motor cortices develop first and the multimodal association areas develop later. Also phylogenetically older areas develop before younger areas [16]. The frontal and temporal multimodal association areas are relatively young cortical areas phylogenetically. The functions they are involved with develop during adolescence, and there is evidence of myelination during adolescence and early adulthood in these regions.
Executive functions including abstract reasoning and higher language functions develop greatly during the adolescent period [17, 18]. Nagy et al. [19] found that working memory, a component of abstract reasoning and executive functioning, correlated positively with anisotropy in the frontal lobe in children and adolescents, the area thought responsible for these functions. They also found that reading ability positively correlated with anisotropy in the temporal lobe, particularly on the left, in this age group. Postmortem data [5] as well as diffusion tensor anisotropy data [12] have suggested that white matter development is largely complete by age 21, so we chose to contrast subjects divided at this age. We hypothesize that we will see changes in white matter anisotropy between adolescence and adults in tracks such as the anterior thalamic radiations, internal capsule and temporal axis in which a majority of the fibers are involved in connectivity of these frontal and temporal regions; in contrast, the optic radiations, a major primary sensory track, will be stable and show little change in anisotropy between adolescence and adulthood.
Methods
Subjects
Thirty-three adult volunteers (20 men, 13 women, mean age = 42.2, SD = 11.5, range = 22–64) were recruited by word of mouth or advertisement. Adolescent comparison subjects (8 males, 7 females, mean age = 17.13, SD = 2.13, range = 14–21) were recruited through local area newspaper advertisement and word of mouth. All of the subjects were given a Comprehensive Assessment of Symptoms and History (CASH) structured interview to exclude history of psychiatric illness in themselves or in their first-degree relatives [20]. All subjects were excluded if there was evidence of a significant neurological impairment, medical conditions thought to interfere with cerebral functioning, history of head trauma, or significant history of drug or alcohol abuse (i.e., if they did not meet current or past criteria for substance abuse or dependence).
All subjects were recruited to age and sex-match a companion cohort of patients with psychosis and thus there is only an approximate match of adolescents against adults for sex. For this reason ANCOVA was used to control for potential sex differences. For all subjects under age 18, consent for participation was given, and written informed consent was obtained from a parent. Written informed consent was obtained from subjects who were 18 years or older.
Image Acquisition
The diffusion tensor sequence acquired 14 7.5-mm-thick slices (TR = 10 s, TE = 99 ms, TI = 2.2 s, b = 750 s/mm, δ = 31 ms, Δ = 73 ms, NEX = 5, voxel = 1.8 × 1.8 × 7.5 mm, FOV = 230 mm), and the SPGR (Spoiled Gradient Recalled Acquisition) anatomical sequence acquired 124 1.2-mm-thick slices (TR = 24 ms, echo time = 5 ms, flip angle = 40°, Signa LX/CV 1.5T system; GE Medical Systems, Milwaukee, Wisc., USA). This sequence was chosen because of its data-acquisition speed, an important consideration when imaging patients with psychosis. It also allows us to perform signal averaging to improve the signal-to-noise ratio. Before the diffusion tensor sequence, a turbo spin echo was also acquired to obtain a localizing anatomical image. All scans were read by a radiologist and no abnormalities were reported.
Image Processing
To assess the degree of diffusion anisotropy in each voxel we used the relative anisotropy. This quantity is a measure of the degree of anisotropy in a voxel, the degree to which the diffusivity is biased along the fiber axis as opposed to perpendicular to it. In order to solve for the components of the diffusion tensor, seven diffusion EPI images were then obtained: six with different non-collinear gradient weightings (angles) and one with no diffusion gradient applied. We then computed the anisotropy for every voxel which formed the basic raw data set that was analyzed subsequently.
Anatomical MRI were resectioned to standard Talairach-Tournoux position using the algorithm of Woods et al. [21] and a six-parameter rigid-body transformation. The anisotropy images from each subject were then aligned to subject’s own standard-position anatomical images using the same six-parameter rigid-body transformation. Note that both the structural and diffusion tensor images remained in their original dimensions and were only aligned using the six-parameter alignment. Neither the diffusion tensor nor the structural data were smoothed.
We tested the extent of error of coregistration and potential distortion of the diffusion tensor images by using the less distorted structural MRI as described in detail elsewhere [22]. The median difference of the absolute image frame coordinates of the anterior and posterior brain edges between structural and anisotropy images was 0.0 and 1.78 mm, respectively, and the median difference in brain length was 2.23 mm, just above 1%. The mean absolute value in millimeters of the differences between the diffusion tensor and MRI locations in the anterior and posterior brain edges was ±2.14 and ±2.71 mm, respectively. Thus distortion was minimal for these images.
Statistical Analysis
On the basis of earlier studies of aging, we selected specific white matter tracts of the brain, i.e. anterior thalamic radiations, cingulum bundle, corpus callosum, frontal anterior fasciculus, frontal superior and inferior longitudinal fasciculus, frontal occipital fasciculus, internal capsule, temporal white matter (located along the central anteroposterior axis of the temporal lobe) located at standard stereotaxic locations as indicated in the print version of the Talairach and Tournoux [23] atlas and their coordinates recorded (table 1). We typically chose the position of the actual label for the structure in the atlas. Since not all structures were labeled on every page, we carried the xy coordinates through to those pages from the more inferior or superior label. We also consulted the atlases of Mori et al. [24] and Ludwig and Klingler [25] for the accurate dorsoventral placement.
Table 1.
ROIs: Talairach-Tournoux coordinates (x, y)
| z |
||||||
|---|---|---|---|---|---|---|
| −4 | 4 | 12 | 20 | 28 | 35 | |
| Internal capsule | 16, 19 | 23, 20 | 22, 20 | 20, 8 | 20, 8 | |
| 13, 12 | 15, 13 | 17, 10 | 20, 3 | 20, 3 | ||
| 9, 7 | 10, 4 | 15, 0 | 20, 0 | 20, 0 | ||
| 5, 2 | 9, 0 | 5, −1 | 20, −1 | 20, −1 | ||
| 9, −4 | 19, −12 | 20, −10 | 21, −10 | 21, −10 | ||
| 22, −17 | 25, −23 | 25, −20 | 22, −24 | 22, −24 | ||
| Frontal anterior fasciculus | 22, 45 | 22, 45 | 22, 52 | 22, 35 | 22, 32 | 25, 30 |
| 22, 32 | 22, 32 | 26, 25 | 22, 25 | 22, 20 | 25, 20 | |
| Frontal occipital fasciculus | 19, 30 | 20, 28 | 20, 18 | 18, −3 | 24, −7 | |
| 19, 24 | 18, 22 | 18, 13 | 18, −9 | 24, −12 | ||
| Temporal axis | 50, −44 | 52, −44 | 57, −41 | |||
| 42, −54 | 42, −52 | 42, −51 | ||||
| 34, −64 | 34, −62 | 34, −61 | ||||
| 26, −74 | 25, −72 | 25, −71 | ||||
| 18, −84 | 16, −81 | 16, −81 | ||||
| Frontal cingulate bundle | 8, 35 | 10, 37 | 10, 34 | 11, 25 | 9, 23 | |
| Frontal interior | 38, −25 | 33, −42 | 35, −50 | |||
| longitudinal fasciculus | 38, −35 | 34, −60 | 36, −60 | |||
| Fontal superior | 36, −38 | 34, −39 | 33, −20 | |||
| longitudinal fasciculus | 36, −42 | 34, −42 | 33, −30 | |||
| Optic radiations | 23, −77 | 32, −63 | ||||
| Cingulum | 10, 26 | 10, 37 | 10, 36 | 10, 30 | 10, 13 | 10, 7 |
| 11, −48 | 10, −44 | 10, −17 | ||||
| Corpus callosum | 5, 26 | 5, 24 | 5, 12 | 11, −5 | ||
| 5, −36 | 5, −32 | 11, −12 | ||||
| Anterior thalamic radiations | 16, 45 | 15, 47 | 17, 45 | 15, 37 | ||
| 16, 35 | 15, 37 | 17, 35 | 15, 27 | |||
The anterior and superior portions of the internal capsule are shown to extend above the caudate in the Ludwig and Klingler [25] atlas, and the Mori et al. [24] atlas similarly labels it in slices above the caudate, so these areas were included in table 1. The anterior corona radiata and superior corona radiata are probably included in the ROI for the internal capsule [24]. We adopted the term ‘anterior thalamic radiations’ for the ROI of medial frontal fibers shown in figure 3 from Mori et al. [24]. The region labeled frontal occipital fasciculus includes both inferior and superior frontal occipital fasciculi [24, 26, 27]. For the frontal superior longitudinal fasciculus, our coordinates from the Talairach and Tournoux [23] atlas are similar to those in the Mori et al. [24] atlas but may contain fibers of the more medial corona radiata. The frontal inferior longitudinal fasciculus is termed the inferior frontal occipital fasciculus in Mori et al. [24] and is a frontal occipital tract (fig. 7). The temporal axis is in fact a group of occipitotemporal fibers including the inferior longitudinal fasciculus, the inferior fronto-occipital fasciculus [24]. The optic radiations were selected as an early developing control comparison area.
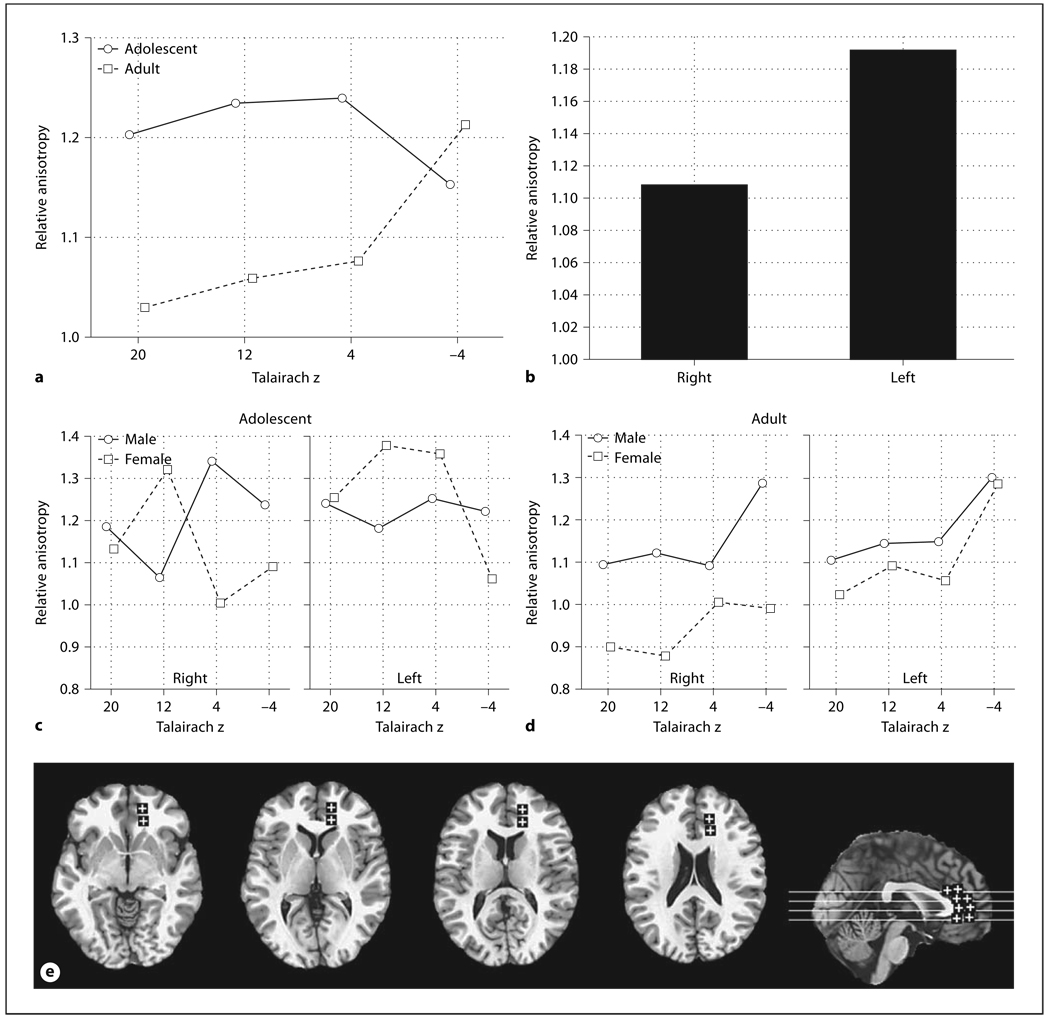
Fig. 3.
Age, sex, and hemisphere effects in relative anisotropy in the anterior thalamic radiations. a Horizontal axis indicates superior-inferior position within the anterior thalamic radiations as labeled by Talairach z. b Bars indicate relative anisotropy within the right and left anterior thalamic radiations. c Horizontal axis indicates superior-inferior position within the anterior thalamic radiations in adults as labeled by Talairach z. Panels indicate the right and left anterior thalamic radiations. d Horizontal axis indicates superior-inferior position within the anterior thalamic radiations in adolescents as labeled by Talairach z. Panels indicate the right and left anterior thalamic radiations. e Representative slices from inferior to superior for z = −4, 4, 12, 20 and a midsagittal slice are shown with ROIs.
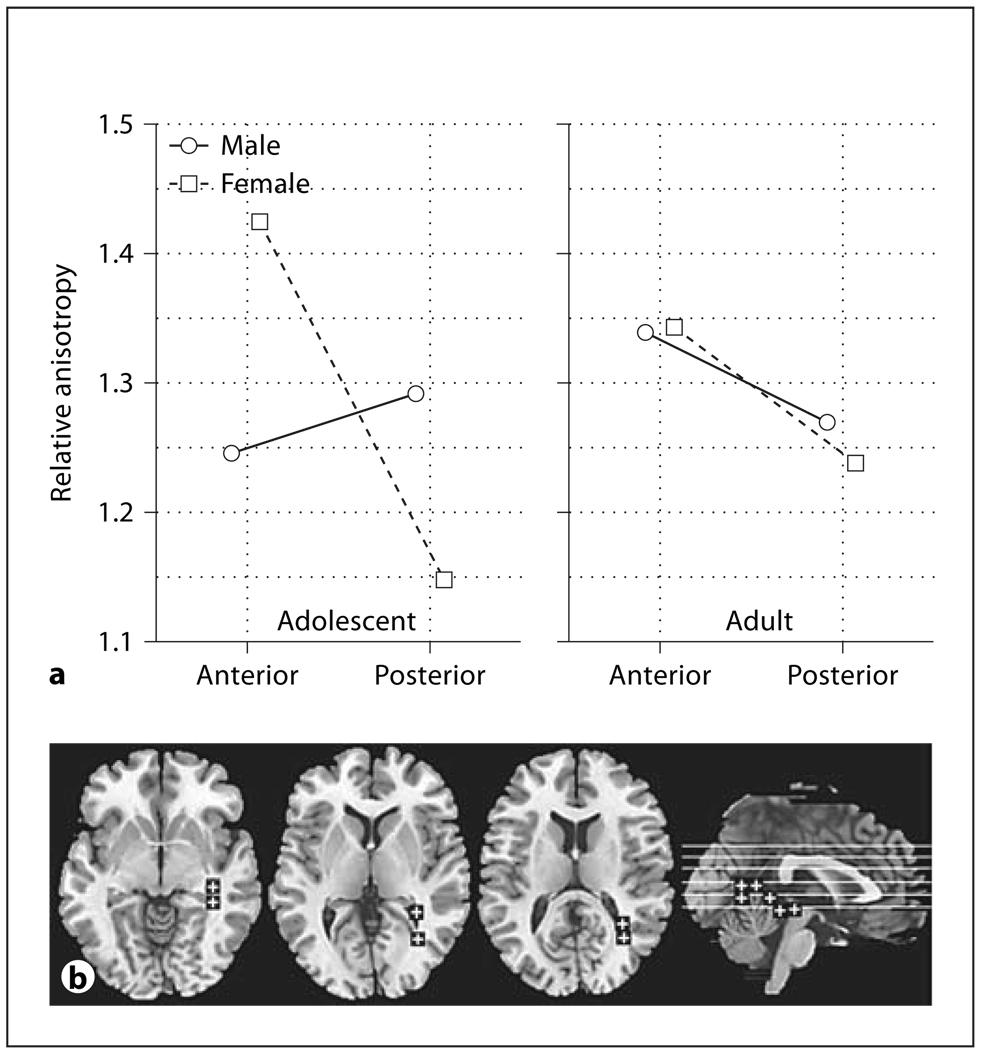
Fig. 7.
Age and sex effects in relative anisotropy in the frontal inferior longitudinal fasciculus. a Horizonta l axis represents the anterior-posterior position in the frontal inferior longitudinal fasciculus. Panels represent adolescents and adults. b Representative slices from inferior to superior for z = –4, 4, 12, and a midsagittal slice are shown with ROIs.
The square ROI (5 × 5 pixels) was applied centered on that coordinate and at the proportion as the brain-bounding box in the Talairach and Tournoux [23] atlas by our own software. Each axial MRI anatomical slice brain edge was traced and this edge was used to generate the brain-bounding box. Talairach coordinates for each brain were then calculated based on the x and y proportions of this box. An algorithmic adjustment was made so that ROIs were moved closer to the centroid of the slice if the box fell partly outside the coregistered brain outline, as could happen in brains that were especially narrow in the y direction. To verify accuracy the coordinates were transformed into MNI space and visually checked against the MNI brain for placement using MRI-cro [28]. All locations listed in table 1 fell in white matter in the MNI standard image. Since scans were collected over a period of several years we thought it important to avoid potential artifacts of scanner drift and axial inequalities in anisotropy values, each value was expressed as the ratio of the voxel value to the whole slice mean value.
Second, we are aware that the position of structures varies across subjects. We assessed the effect of individual variation on stereotaxic error by using 35 normal adults who had had the anterior limb of the internal capsule traced [29]. This structure was chosen because it had four discrete and defined boundaries against which to assess error; errors in the placement of the frontal occipital fasciculus would have been more ambiguous in error distance assessment since there is surrounding white matter. The centroid of the internal capsule for z = 12 was located at x = 18, y = 13 with standard deviations of 3.03 and 3.86, respectively. This point was quite close to our template location of x = 17, y = 10, z = 12 for the mid-anterior internal capsule chosen from the Talairach and Tournoux [23] atlas (table 1). The x direction width of the internal capsule in the Talairach atlas was approximately 8 mm at this point, meaning that about 66% of 5-mm ROI boxes would be entirely within the internal capsule. While a 3-mm box would be more likely to fall entirely within the internal capsule, noise in a smaller box would be higher, making the 5-mm size a reasonable compromise. Thus, as widely asserted, the Talairach and Tournoux [23] atlas is a reasonable approximation of the human brain.
A ROI-based strategy was used for three reasons: (1) to minimize type I statistical errors in evaluating large numbers of ROIs in both hemispheres through the use of multiway repeated-measures analysis of variance (ANOVA) and a single F ratio test indicating the hypothesized diagnostic age group × hemisphere × region interaction; (2) to minimize type II errors resulting from assessing small individual potentially noisy ROIs, and (3) to provide standard and known brain atlas locations for replication. We also controlled type I error by not discussing main effects or interactions that are not interpretable (e.g., main effect of slice level across structures measured at multiple axial slice levels). Anisotropy is a scalar invariant under rotation and translation and thus ROI data analysis can be carried out on images reoriented to standard AC-PC position. We also reported Huynh-Feldt and MANOVA F values for completeness. Since probability values are obtained from multiway MANOVA interactions and multiple region plots are provided, standard error bars are not included.
Results
Frontal versus Optic Radiations
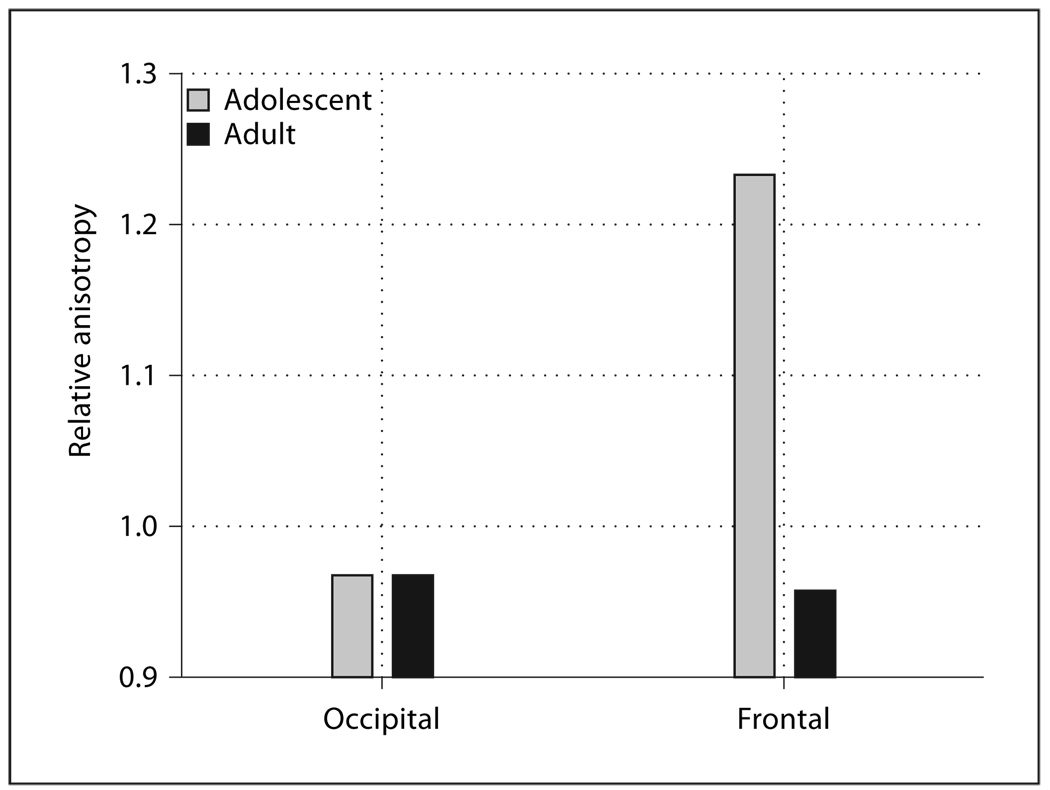
The anterior portion of the frontal anterior fasciculus, well within the frontal lobe, showed a large difference between adolescents and adults while little age effect was seen in the optic radiations in the occipital lobe at corresponding Talairach z values (fig 1, occipital vs. frontal × age, F = 5.11, d.f. = 1, 44, p = 0.028). No significant effects involving age were found in the optic radiations alone (age, F = 0.19, d.f. = 1, 44, p = 0.66).
Fig. 1.
Age effects in relative anisotropy in occipital and frontal regions. All graphs indicate significant interactions (see text for F, d.f., and p). The optic radiations in the occipital lobe and the anterior portion of the frontal anterior fasciculus in the frontal lobe are represented on the horizontal axis.
Internal Capsule
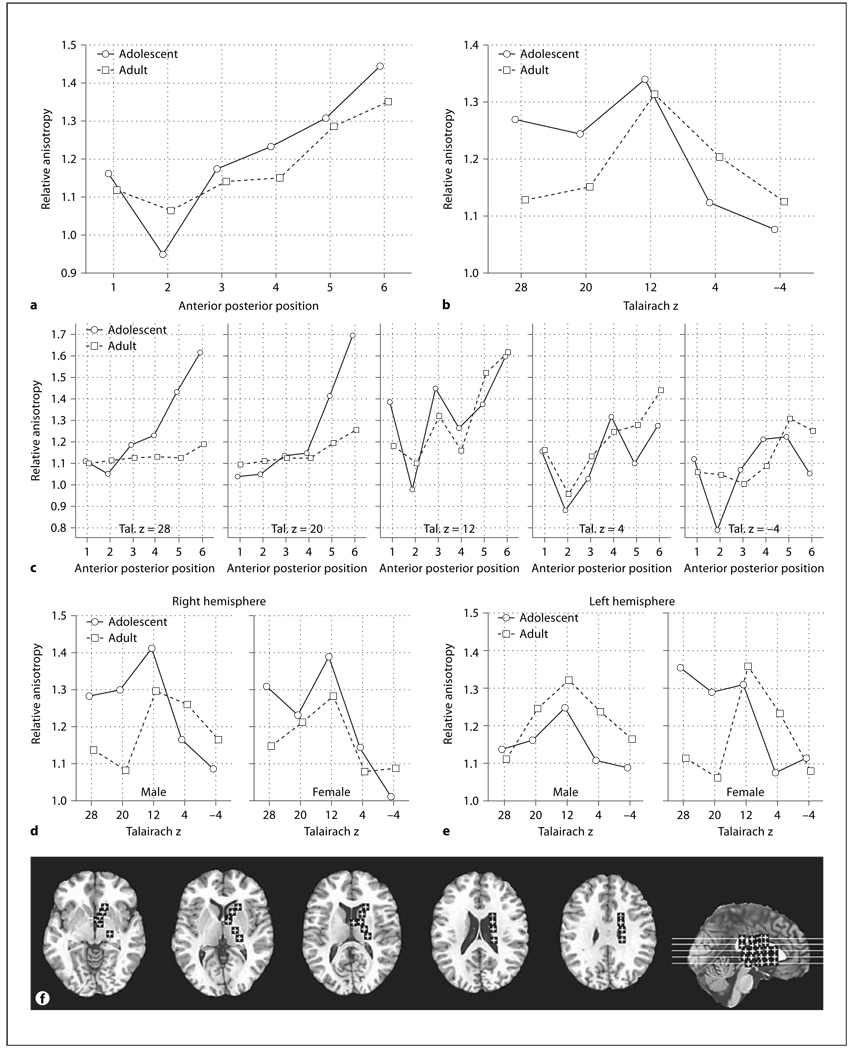
The anisotropy of the posterior limb of the internal capsule was higher in adolescents than adults while in contrast, the center of the anterior limb was higher in adults. These differences were statistically confirmed by a significant age group × anterior-posterior position interaction for all six internal capsule positions (fig. 2a, F = 3.40, d.f. = 5, 220, p = 0.006, Huynh-Feldt (HF) ε = 0.98, HF Adj. d.f. = 4.90, 215.62, HF Adj. p = 0.006). This difference between adolescents and adults was also confirmed for the two anterior-most positions, where the majority of the fibers are thalamocortical [30], considered alone (age × anterior-posterior interaction, F = 9.65, d.f. = 1,44, p = 0.0034). Adolescents had higher anisotropy than adults at superior levels and lower anisotropy than adults at inferior levels (fig. 2b, age × inferior-superior, F = 2.95, d.f. = 4, 176, p = 0.022, HF ε = 0.87, HF Adj., d.f. = 3.50, 153.89, HF Adj. p = 0.028). Adolescents had much higher anisotropy in the posterior portion of the internal capsule than adults for the more superior levels (fig. 2c, age × anterior-posterior × inferior-superior, F = 3.38, d.f. = 20, 880, p < 0.00001, HF ε = 0.59, HF Adj. d.f. = 11.94, 525.43, HF Adj. p < 0.0001).
Fig. 2.
Age, sex, and hemisphere effects in relative anisotropy in the internal capsule. a Horizontal axis indicates anterior-posterior position within internal capsule (see f, brain diagram). b Horizontal axis represents superior-inferior axis with Talairach z coordinate labeled (see f). c Horizontal axis in each panel represents the anterior-posterior position within internal capsule (1 = anteriormost location, 3 = genu and 6 = posteriormost location, see f). Panels from left to right represent superior-inferior axis with Talairach z coordinate labeled. d Horizontal axis indicates superior-inferior position within the right internal capsule as labeled by Talairach z. Left and right panels represent males and females, respectively. e Horizontal axis indicates superior-inferior position within the left internal capsule as labeled by Talairach z. Left and right panels represent males and females, respectively. f Representative slices from inferior to superior for Talairach z = −4, 4, 12, 20, 28 and a midsagittal slice are shown with ROIs. For clarity in all figures ROIs are enlarged (actual dimensions 5 × 5 pixels), were placed as mirror images in both hemispheres but are shown only in the right hemisphere, and are displayed on T1 images. The Talairach xyz coordinates are given in table 1
Sex differences were also prominent in the anisotropy patterns. Adolescent women had higher anisotropy in the posterior limb of the internal capsule than adult women but men of both ages were similar in anisotropy along the entire anterior-posterior dimension. Adolescent women, also had higher anisotropy in the superior portion of the internal capsule compared to adult women and this effect was greatest in the right hemisphere. Adolescent men, however, showed lower anisotropy in the superior portion of the internal capsule in the right hemisphere as compared to adults, which was less marked in the left hemisphere. We also observed a pattern of higher anisotropy in adult women than adolescents at the most superior levels on the left (fig. 2d, e, age × sex × inferior-superior × hemisphere, F = 3.19, d.f. = 4, 176, p = 0.015). There was also a sex × hemisphere × inferior-superior × anterior-posterior (but not by age) interaction that was analyzed for completeness (F = 2.60, d.f. = 20, 880, p = 0.00016, HF ε = 0.74, HF Adj. d.f. = 14.84, 652.87, HF Adj. p = 0.00089).
Anterior White Matter Tracts
More anterior positions within the frontal lobe tended to show higher anisotropy in adolescents than in adults and this tended to be greater at more superior levels. For the anterior thalamic radiations adolescents displayed higher anisotropy than adults in all but the most inferior level of the brain (fig. 3a, age × inferior-superior, F = 3.24, d.f. = 3, 132, p = 0.024). Also anisotropy was observed to be higher in the left hemisphere than the right hemisphere (F = 6.65, d.f. = 1, 44, p = 0.013). Adult women had lower anisotropy than men across all inferior-superior levels but in adolescents women had higher anisotropy for slice levels intersecting the basal ganglia and in the left hemisphere (fig. 3c, d, age × sex × hemisphere × inferior-superior, F = 2.96, d.f. = 3, 132, p = 0.035).
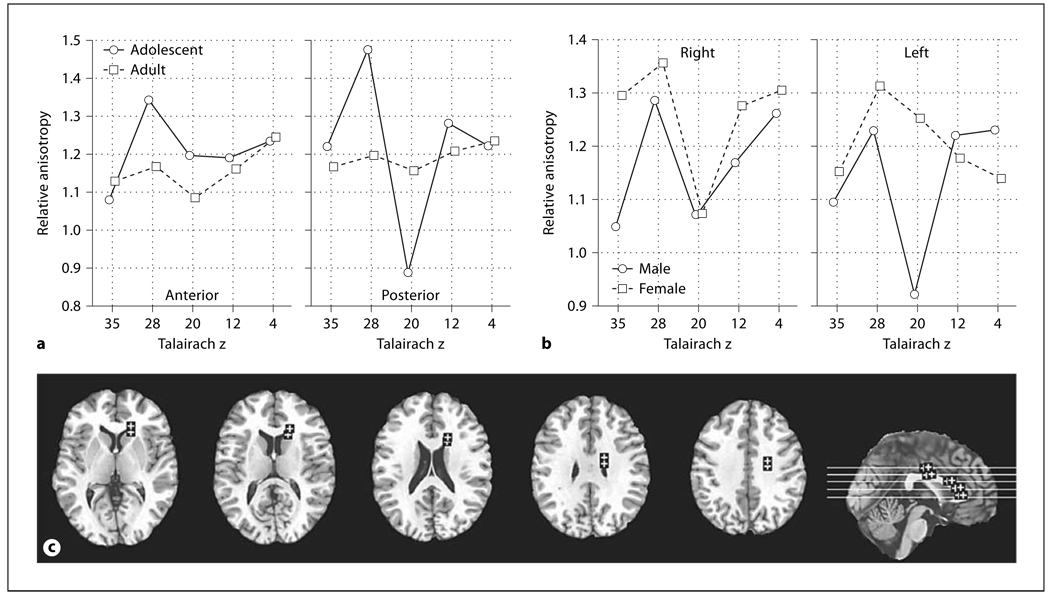
A similar finding appeared for the frontal occipital fasciculus with the anterior portion showing higher anisotropy in adolescents while the more posterior portion showed this adolescent effect only for the two superior levels (fig. 4a, age × inferior-superior × anterior-posterior, F = 6.27, d.f. = 4, 176, p < 0.0001, HF ε = 0.88, HF Adj. d.f. = 3.51, 154.23, HF Adj. p = 0.00022). Women had higher anisotropy than men in the superior levels, especially on the left, but age effects were not significant (fig. 4b, sex × inferior-superior × hemisphere, f = 3.40, d.f. = 4, 176, p = 0.011).
Fig. 4.
Age, sex, and hemisphere effects in relative anisotropy in the frontal occipital fasciculus. a Horizontal axis indicates superior-inferior position within the frontal occipital fasciculus as labeled by Talairach z. Panels indicate the anterior and posterior position within the frontal occipital fasciculus. b Horizontal axis indicates superior-inferior position within the frontal occipital fasciculus as labeled by Talairach z. Panels indicate the right and left frontal occipital fasciculus. c Representative slices from inferior to superior for z = 4, 12, 20, 28, 35 and a midsagittal slice are shown with ROIs.
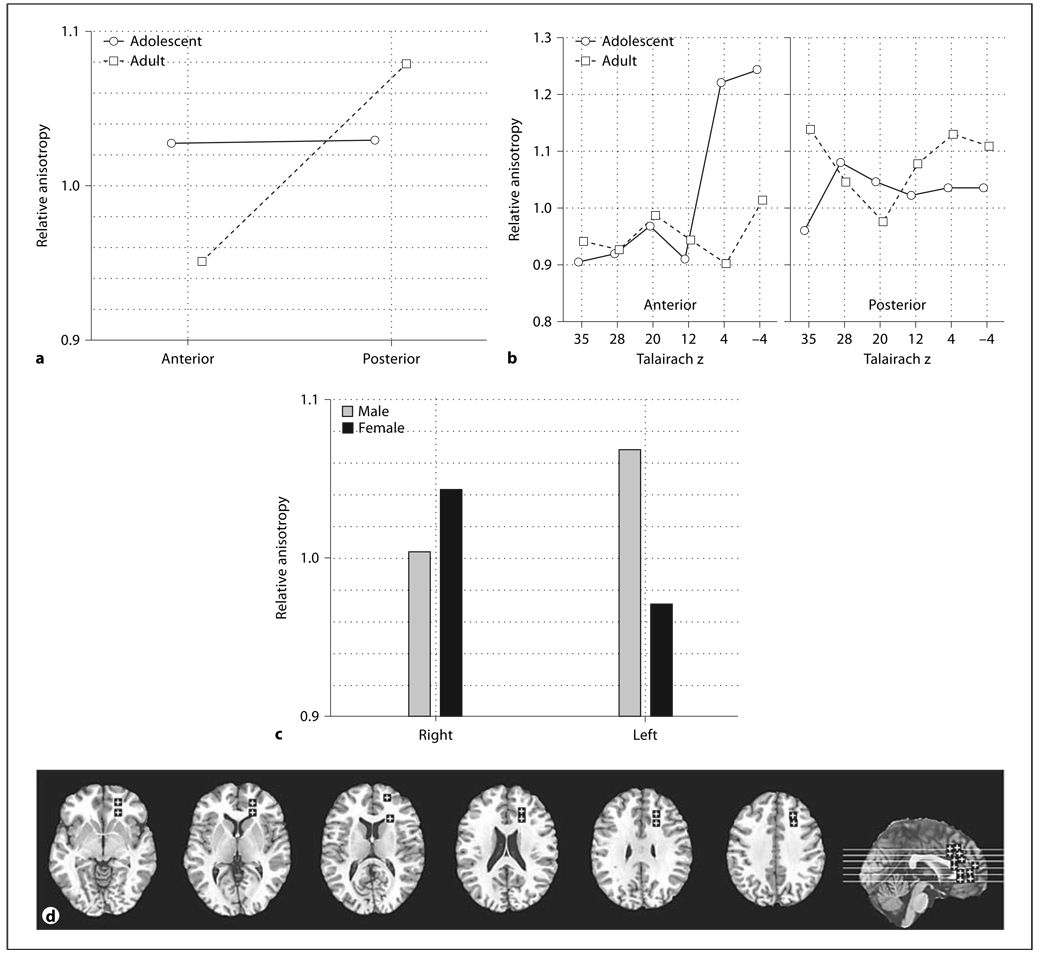
Similarly, the frontal anterior fasciculus showed higher anisotropy in adolescents in the most anterior position (fig. 5a, age × anterior-posterior, F = 7.10, d.f. = 1, 44, p = 0.011; fig. 5b, age × inferior-superior × anterior-posterior position, F = 4.65, d.f. = 5, 220, p = 0.00047, HF ε = 0.93, HF Adj. d.f. = 4.67, 205.39, HF Adj. p = 0.00066). Women had higher anisotropy than men in the frontal anterior fasciculus in the right hemisphere and lower anisotropy in the left hemisphere (fig. 5c, sex × hemisphere, f = 4.56, d.f. = 1, 44, p = 0.038).
Fig. 5.
Age, sex, and hemisphere effects in relative anisotropy in the frontal anterior fasciculus. a Horizontal axis indicates anterior-posterior position in the frontal anterior fasciculus. b Horizontal axis indicates superior-inferior position in the frontal anterior fasciculus as labeled by Talairach z. Panels indicate the anterior and posterior points within the frontal anterior fasciculus. c Horizontal axis indicates the right and left frontal anterior fasciculus. d Representative slices from inferior to superior for z = −4, 4, 12, 20, 28, 35 and a midsagittal slice are shown with ROIs.
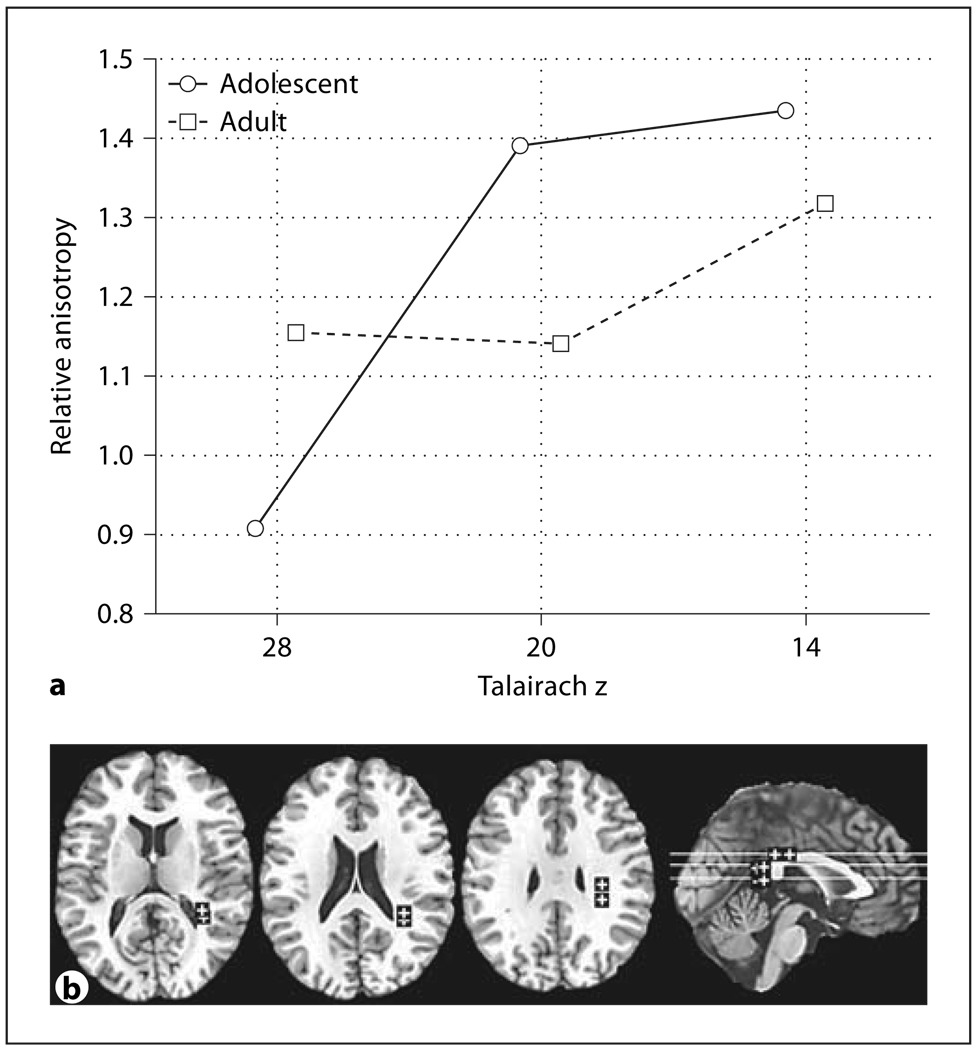
The frontal superior longitudinal fasciculus showed adolescents having lower anisotropy in the more superior level and higher than adults in the more inferior level (fig. 6a, age × inferior-superior, F = 16.86, d.f. = 2, 88, p < 0.00001, HF ε = 0.85, HF Adj. d.f. = 1.71, 75.21, HF Adj. p < 0.00001). For the frontal inferior longitudinal fasciculus we found that women changed little with age while adult men had higher anterior anisotropy than adolescents (fig. 7a, age × sex × anterior-posterior, F = 4.14, d.f. = 1, 44, p = 0.048).
Fig. 6.
Age effects in relative anisotropy in the frontal superior longitudinal fasciculus. a Horizontal axis indicates superior-inferior position in the superior longitudinal fasciculus as labeled by Talairachz. b Representative slices from inferior to superior for z = 12, 20, 28, and a midsagittal slice are shown with ROIs.
Corpus Callosum
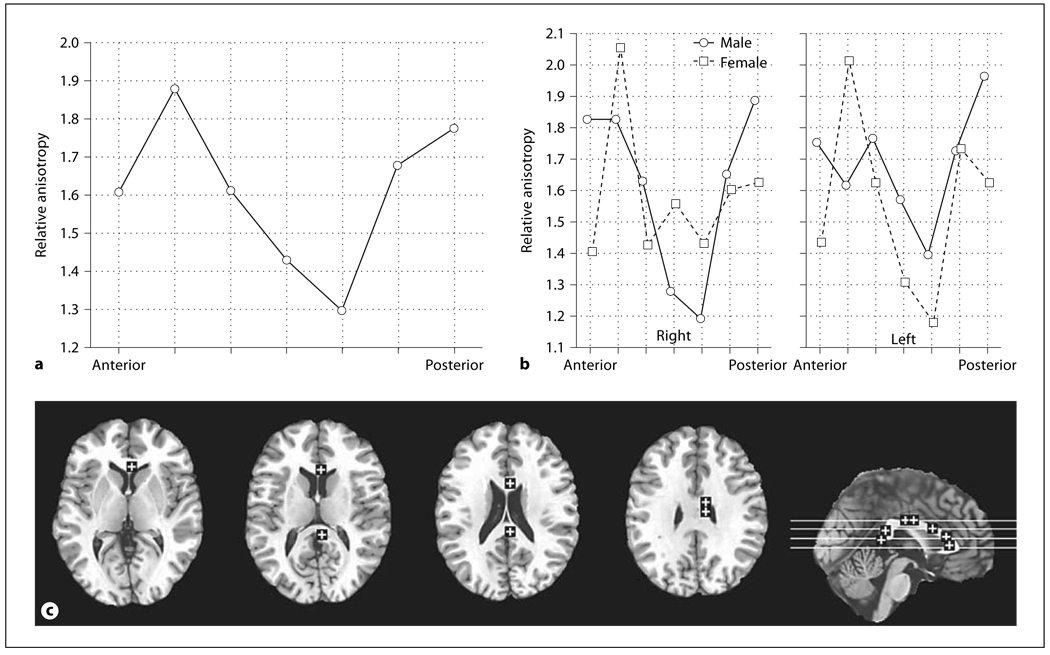
There was no main effect of age or sex in the corpus callosum. Higher anisotropy was seen in the genu and splenium as compared to the body (fig. 8a, anterior-posterior, F = 5.56, d.f. = 6, 264, p = 0.000019, HF ε = 0.97, HF Adj. d.f. = 5.85, 257.22, HF Adj. p = 0.000024). Men had higher anisotropy in the anterior-most and posterior-most locations while women had higher values in the second most anterior point; in the body of the corpus men have higher values than women on the left while women had higher values than men on the right (fig. 8b, sex × hemisphere × anterior-posterior, F = 2.24, d.f. = 6, 264, p = 0.040, HF ε = 0.88, HF Adj. d.f. = 5.29, 232.66, HF Adj. p = 0.047).
Fig. 8.
Sex and hemisphere effects in relative anisotropy in the corpus callosum. a Horizontal axis represents anterior-posterior position within the corpus callosum (2 most anterior points = genu, middle 3 points = body, 2 most posterior points = splenium). b Horizontal axis represents anterior-posterior position within the corpus callosum. Panels indicate the right and left corpus callosum. c Representative slices from inferior to superior for z = 4, 12, 20, 28, and a midsagittal slice are shown with ROIs.
Cingulum Bundle
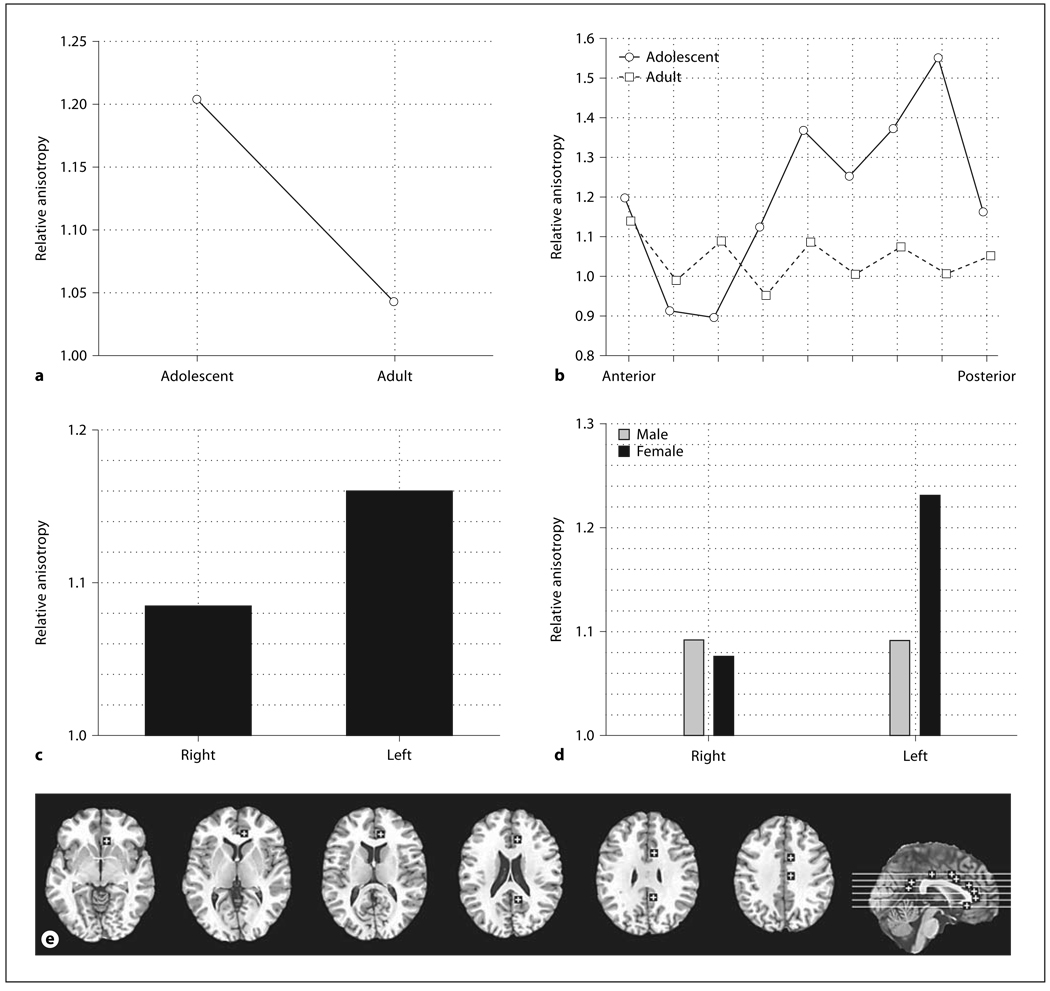
Adolescents had higher anisotropy in the cingulum bundle and this was most marked in the posterior half of the cingulum bundle (fig. 9a, age, F = 10.48, d.f. = 1, 44, p = 0.0022; fig. 9b, age × anterior-posterior, F = 3.81, d.f. = 8, 352, p = 0.00026, HF ε = 0.63, HF Adj. d.f. = 5.01, 220.64, HF Adj. p = 0.0025). Higher anisotropy in adolescents was also confirmed in an ANOVA containing only the anterior portion with the higher parts of the bundle showing the higher values in adolescents (age × inferior-superior, F = 9.82, d.f. = 4, 200, p < 0.0001, HF ε = 0.90, HF Adj. d.f. = 3.62, 180.77, HF Adj. p < 0.0001). Overall anisotropy was higher on the left than on the right (fig. 9c, hemisphere, F = 5.73, d.f. = 1, 44, p = 0.021). Women had higher anisotropy than men in the left hemisphere, but men and women were equal on the right (fig. 9d, sex × hemisphere, F = 5.89, d.f. = 1, 44, p = 0.019).
Fig. 9.
Age, sex and hemisphere effects in relative anisotropy in the cingulum bundle. Horizontal axis represents age group (adolescent, adult; a), anterior-posterior axis in the cingulum bundle (b), and the right and left cingulum bundle (c, d). e Representative slices from inferior to superior for z = −4, 4, 12, 20, 28, 35 and a midsagittal slice are shown with ROIs.
Temporal White Matter Axis
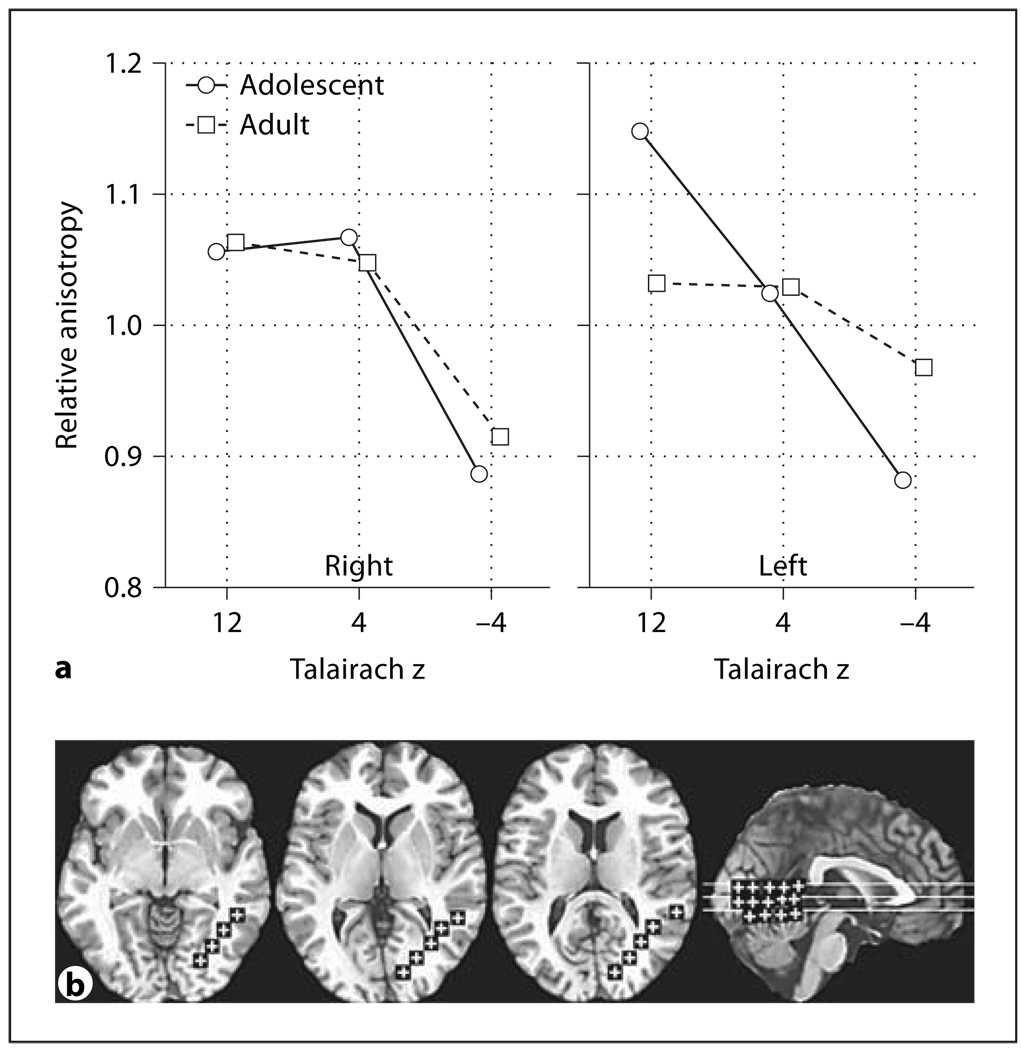
Adolescents had a higher anisotropy in the most superior level of the temporal axis and a lower anisotropy in the inferior portion of the temporal axis in the left hemisphere (fig. 10a, age × hemisphere × inferior-superior, F = 3.79, d.f. = 2, 88, p = 0.026). No significant difference between adolescents and adults was seen in the right temporal axis. No sex differences were observed in the temporal axis.
Fig. 10.
Age and hemisphere effects in relative anisotropy in the temporal white matter axis. a Horizontal axis indicates superior-inferior position within the temporal white matter axis as labeled by Talairach z. Panels indicate the right and left temporal white matter axis. b Representative slices from inferior to superior for z = −4, 4, 12, and a midsagittal slice are shown with ROIs.
Discussion
Regional Differences in Age Effects
White matter anisotropy shows changes even between the relatively mature brains of adolescence (ages 14–20) and adulthood (ages 22–64). These patterns of age change are complex, showing both relative increases and decreases in anisotropy with age and even show different directions in different portions of the same white matter structures. Significant age effects were most often age × region or age × inferior-superior or anterior-posterior position interactions.
As hypothesized, white matter tracts associated with multimodal polysensory structures showed adolescent versus adult differences while tracts associated with primary sensory or motor cortex showed virtually no adolescent versus adult differences. This was especially apparent in the comparison of the frontal anterior fasciculus and the optic radiations. The structures showing adolescent versus adult areas included the internal capsule, frontal anterior fasciculus, fronto-occipital fasciculus, temporal axis, frontal superior longitudinal fasciculus, cingulum, frontal cingulate bundle, and anterior thalamic radiations. All of these structures are also associated with the frontal or temporal cortex. As expected, the early maturing primary sensory optic radiations showed no change in anisotropy between adolescence and adulthood. The corpus callosum, also relatively early maturing and having a large portion of fibers connecting primary motor and sensory areas, similarly did not show age effects in anisotropy. The exception is the frontal inferior longitudinal fasciculus which did not show age effects despite its significant frontal connection.
Our age range, 14–64 years, bridges that of earlier anisotropy studies which tended to show increasing anisotropy in childhood and adolescence and decreasing anisotropy starting in adulthood. Our detailed stereotaxic regional analysis suggests that the topological organization of each tract may have characteristic age-related patterns and that maturation is associated with both increases and decreases in anisotropy.
Anisotropy and Neuronal Characteristics
The interpretation of relative anisotropy is complex and many microscopic anatomical changes could contribute to altering the signal with age. Changes in anisotropy do not necessarily indicate complete remodeling of connection pathways. Anisotropy changes may result from alterations in axon geometry, including the thickening of the axonal bundles, the reduced water content in between axons, the thickening of the myelin sheet and the myelination of the previously unmyelinated axons [31], all events which may not change the final target of the axon, although they might modify the physiological properties of the connection.
Internal Capsule
As with the general trend of white matter, anisotropy has been reported to increase with age in children and adolescents [10, 32, 33] and decrease in older adults [9, 34]. In our detailed analysis, we noted that adults tended to have higher values in the superior level and lower values in the inferior levels. Adolescents also had higher values in the posterior but not anterior portion of the internal capsule. The age effects showed a different pattern in men and women. The largest change with age was seen in the superior level with adult men showing higher anisotropy than adolescent men on the right and adult women showing higher anisotropy than adolescent women on the left. The complex interactions between age, anterior/posterior position and inferior/posterior reflect the complex organization of the internal capsule with the anterior portion primarily thalamocortical fibers [30] with a superior/inferior prefrontal cortex topographic organization. It is of interest that adolescents had higher anisotropy than adults in the superior posterior limb, which is primarily motor fibers, but also contains thalamocortical (mostly thalamofrontal fibers, perhaps from the intermedullary lamina) connections. It is possible that these mediodorsal thalamic fibers that exit the thalamus and connect to the prefrontal cortex develop in late adolescence and early adulthood; since these fibers course anteriorly and the motor fibers of the corona radiata course vertically, development of the former would reduce anisotropy values. Axonal trajectory work on these projections has largely been carried out in animals and detailed study of the human tractography data will be necessary to fully address these issues.
Anterior White Matter Tracts
Our finding of generally decreased anisotropy in adults compared with adolescents is consistent with the frontal anisotropy results over the adult lifespan (ages 21–76) observed by Salat et al. [35] and follows the same trend as the results seen between children and adults by Klingberg et al. [11]. Our results are not directly comparable with Pfefferbaum et al. [36], who studied a young adult group (mean age 29) and compared them with an old group (mean age 72) of which all subjects were older than any of ours. Our findings in adults for the anterior thalamic radiations are not consistent with Szeszko et al. [37], who found that women have higher frontal anisotropy particularly in the left hemisphere while we found higher anisotropy in men in both hemispheres. However, in our sample, adolescent women did show higher anisotropy than men at some levels of the anterior thalamic radiations most markedly on the left.
Corpus Callosum
We found higher anisotropy in men than women for the genu and splenium with less marked sex differences or with women higher than men in the body of the callosum. This is generally consistent with two earlier studies [38, 39] that also found greater anisotropy in men than women in the corpus callosum both using traced-ROI methods. Our findings in men were partially similar to Chepuri et al. [40], who observed higher anisotropy in the splenium than body using ROI drawn directly on the anisotropy images and Snook et al. [41], who observed higher anisotropy in the splenium than the genu. Our results for the anterior-to-posterior gradient in males are similar to those of Sulivan et al. [42], who found an almost U-shaped function (highest for splenium, second highest for most anterior section) for younger subjects except that we found higher anisotropy in the genu than the body. These differences in anisotropy between men and women may be related to reported higher density (fibers/mm2) in men than in women [43].
Cingulum Bundle. We found higher anisotropy in the left hemisphere, which is consistent with an earlier study [44] using tract-tracing and measurement of anisotropy within the bundle. This also indicates that our stereotaxic method produces not dissimilar results to other ROI techniques.
Temporal White Matter Axis
We observed that adolescents had a marked superior-inferior gradient in the left hemisphere but adults did not; little superior-inferior gradient or age change is visible in either group in the right hemisphere. This is consistent with dominant hemisphere organization during adolescence, possibly more prominent for the superior temporal gyrus than the middle and inferior temporal gyri.
Limitations
The results indicated that anisotropy showed changes with age, marked in some major tracts. While one explanation is clearly developmental change, our study did not use longitudinal data, so subject selection biases could have created apparent age effects. These might include the direct effects of education or bias in selecting individuals as adolescents who might not match educational attainments of older subjects. Because of difficulties in recruiting minors, there were also fewer individuals in the adolescent group, which diminishes statistical power. Also, the study did not explore changes below age 14, omitting any change in anisotropy during a potentially relevant period of development; this might have restricted the range of change and prevented our demonstrating age-related change in some structures. The ratio of men to women in the two samples was slightly but not significantly higher in the adults and we assessed this by including sex as an independent group dimension in MANOVA.
We cannot exclude the possibility that changes in anisotropy may reflect overall changes in connections between brain areas. These changes may be due to normal development, degeneration associated with aging, and remodeling associated with learning and memory. All scans were radiologically normal, mitigating against an explanation of group differences being attributed to dementia or neurological diseases of the elderly. Normal development may include the generation of new connections between brain areas, which occurs primarily in the prenatal and infant phase, or the pruning of redundant, unneeded, or superseded connections, which occurs later in childhood and adolescence. Aging may be associated with loss of cortical cells and the volume of gray matter, especially in the frontal cortex. This loss may be associated with alterations in the white matter tracts to these same areas, altering their anisotropy. Lastly, remodeling due to learning and memory may alter the number of connections as well as their physical parameters. The interpretation of anisotropy alone is necessarily limited as it implies only level of alignment but not directionality and must be supplemented with more complex methods such as tract tracing to understand developmental trajectories.
Stereotaxic error in the placement of ROIs would tend to increase standard deviations and be associated with type II statistical error. We assessed the internal capsule location by comparing the average stereotaxic location against the actual position in a separate cohort of individuals (see ‘Methods’) and found good agreement. The error is not entirely dissimilar to the error in interpreting statistical parametric maps by referring to the standard listed anatomical structure from the Talairach Daemon [45]. Note that by using specific xyz coordinates we have an entirely algorithmic measure sufficiently specified so that other investigators can obtain comparable values. Data was analyzed as relative anisotropy, and we would expect very similar results had the analysis been done with fractional anisotropy, as the measures are closely related and produce very similar images, and as, as suggested by Kingsley and Monahan [46], there is no intrinsic advantage of using fractional as opposed to relative anisotropy.
Summary
These age-related anisotropy changes are consistent with complex maturational connectivity changes occurring in adolescence and early adulthood. These changes, relatively late in the maturational process, were more prominent in higher cognitive centers of the frontal and temporal lobe and less prominent in the occipital lobe. This is consistent with later maturation and myelination of the frontal and temporal regions, and more complex cognitive and emotional control skills appear in this phase of life that are controlled by these areas.
Acknowledgments
This work was supported by P50 MH 66392-01 (Dr. Davis, P. I., Drs. Buchsbaum and Hof), MH60023 and MH56489 (Dr. Buchsbaum), VISN3 MIRECC (Dr. Siever), and the General Clinical Research Center, M01-RR-00071. None of the authors have any financial conflict of interest. Rachel Bloom, Pauline Bokhoven, Karen Dahlman, and Desmond Heath contributed to subject recruitment and clinical characterization.
References
- 1.Basser PJ, Mattiello J, LeBihan D. MR diffusion tensor spectroscopy and imaging. Biophys J. 1994;66:259–267. doi: 10.1016/S0006-3495(94)80775-1. [DOI] [PMC free article] [PubMed] [Google Scholar]
- 2.Lim KO, Hedehus M, Moseley M, de Crespigny A, Sullivan EV, Pfefferbaum A. Compromised white matter tract integrity in schizophrenia inferred from diffusion tensor imaging. Arch Gen Psychiatry. 1999;56:367–374. doi: 10.1001/archpsyc.56.4.367. [DOI] [PubMed] [Google Scholar]
- 3.Buchsbaum MS, Tang CY, Peled S, Gudbjartsson H, Lu D, Hazlett EA, Downhill J, Haznedar M, Fallon JH, Atlas SW. MRI white matter diffusion anisotropy and PET metabolic rate in schizophrenia. Neuroreport. 1998;9:425–430. doi: 10.1097/00001756-199802160-00013. [DOI] [PubMed] [Google Scholar]
- 4.Richardson E. Myelination in the human central nervous system. In: Haymaker W, Adams R, editors. Histology and Histopathology of the Nervous System. Springfield: Thomas; 1982. pp. 146–173. [Google Scholar]
- 5.Yakovlev P, Lecours A. The myelogenic cycles of regional maturation of the brain. In: Minowski A, editor. Regional Development of the Brain in Early Life. Oxford: Blackwell Scientific; 1967. pp. 3–70. [Google Scholar]
- 6.Benes FM. Myelination of cortical-hippocampal relays during late adolescence. Schizophr Bull. 1989;15:585–593. doi: 10.1093/schbul/15.4.585. [DOI] [PubMed] [Google Scholar]
- 7.Buchsbaum MS, Mansour CS, Teng DG, Zia AD, Siegel BV, Jr, Rice DM. Adolescent developmental change in topography of EEG amplitude. Schizophr Res. 1992;7:101–107. doi: 10.1016/0920-9964(92)90039-8. [DOI] [PubMed] [Google Scholar]
- 8.Schneider JF, Il’yasov KA, Hennig J, Martin E. Fast quantitative diffusion-tensor imaging of cerebral white matter from the neonatal period to adolescence. Neuroradiology. 2004;46:258–266. doi: 10.1007/s00234-003-1154-2. [DOI] [PubMed] [Google Scholar]
- 9.Mukherjee P, Miller JH, Shimony JS, Conturo TE, Lee BC, Almli CR, McKinstry RC. Normal brain maturation during childhood: developmental trends characterized with diffusion-tensor MR imaging. Radiology. 2001;221:349–358. doi: 10.1148/radiol.2212001702. [DOI] [PubMed] [Google Scholar]
- 10.Schmithorst VJ, Wilke M, Dardzinski BJ, Holland SK. Correlation of white matter diffusivity and anisotropy with age during childhood and adolescence: a cross-sectional diffusion-tensor MR imaging study. Radiology. 2002;222:212–218. doi: 10.1148/radiol.2221010626. [DOI] [PMC free article] [PubMed] [Google Scholar]
- 11.Klingberg T, Vaidya CJ, Gabrieli JD, Moseley ME, Hedehus M. Myelination and organization of the frontal white matter in children: a diffusion tensor MRI study. Neuroreport. 1999;10:2817–2821. doi: 10.1097/00001756-199909090-00022. [DOI] [PubMed] [Google Scholar]
- 12.Ben Bashat D, Ben Sira L, Graif M, Pianka P, Hendler T, Cohen Y, Assaf Y. Normal white matter development from infancy to adult-hood: comparing diffusion tensor and high b value diffusion weighted MR images. J Magn Reson Imaging. 2005;21:503–511. doi: 10.1002/jmri.20281. [DOI] [PubMed] [Google Scholar]
- 13.Pfefferbaum A, Sullivan EV, Hedehus M, Lim KO, Adalsteinsson E, Moseley M. Age-related decline in brain white matter anisotropy measured with spatially corrected echo-planar diffusion tensor imaging. Magn Reson Med. 2000;44:259–268. doi: 10.1002/1522-2594(200008)44:2<259::aid-mrm13>3.0.co;2-6. [DOI] [PubMed] [Google Scholar]
- 14.Nusbaum AO, Tang CY, Buchsbaum MS, Wei TC, Atlas SW. Regional and global changes in cerebral diffusion with normal aging. AJNR Am J Neuroradiol. 2001;22:136–142. [PMC free article] [PubMed] [Google Scholar]
- 15.Yoshiura T, Mihara F, Tanaka A, Togao O, Taniwaki T, Nakagawa A, Nakao T, Noguchi T, Kuwabara Y, Honda H. Age-related structural changes in the young adult brain shown by magnetic resonance diffusion tensor imaging. Acad Radiol. 2005;12:268–275. doi: 10.1016/j.acra.2004.12.015. [DOI] [PubMed] [Google Scholar]
- 16.Gogtay N, Giedd JN, Lusk L, Hayashi KM, Greenstein D, Vaituzis AC, Nugent TF, 3rd, Herman DH, Clasen LS, Toga AW, Rapoport JL, Thompson PM. Dynamic mapping of human cortical development during childhood through early adulthood. Proc Natl Acad Sci USA. 2004;101:8174–8179. doi: 10.1073/pnas.0402680101. [DOI] [PMC free article] [PubMed] [Google Scholar]
- 17.Steinberg L. Cognitive and affective development in adolescence. Trends Cogn Sci. 2005;9:69–74. doi: 10.1016/j.tics.2004.12.005. [DOI] [PubMed] [Google Scholar]
- 18.Fuster JM. Frontal lobe and cognitive development. J Neurocytol. 2002;31:373–385. doi: 10.1023/a:1024190429920. [DOI] [PubMed] [Google Scholar]
- 19.Nagy Z, Westerberg H, Klingberg T. Maturation of white matter is associated with the development of cognitive functions during childhood. J Cogn Neurosci. 2004;16:1227–1233. doi: 10.1162/0898929041920441. [DOI] [PubMed] [Google Scholar]
- 20.Andreasen NC, Flaum M, Arndt S. The comprehensive assessment of symptoms and history (CASH): an instrument for assessing diagnosis and psychopathology. Arch Gen Psychiatry. 1992;49:615–623. doi: 10.1001/archpsyc.1992.01820080023004. [DOI] [PubMed] [Google Scholar]
- 21.Woods RP, Mazziotta JC, Cherry SR. MRI-PET registration with automated algorithm. J Comput Assist Tomogr. 1993;17:536–546. doi: 10.1097/00004728-199307000-00004. [DOI] [PubMed] [Google Scholar]
- 22.Mitelman SA, Newmark RE, Torosjan Y, Chu KW, Brickman AM, Haznedar MM, Hazlett EA, Tang CY, Shihabuddin L, Buchsbaum MS. White matter fractional anisotropy and outcome in schizophrenia. Schizophr Res. 2006;87:138–159. doi: 10.1016/j.schres.2006.06.016. [DOI] [PubMed] [Google Scholar]
- 23.Talairach J, Tournoux P. Co-Planar Stereotaxic Atlas of the Human Brain. Stuttgart: Thieme; 1988. [Google Scholar]
- 24.Mori S, Wakana S, Nagae-Poetscher LM, van Zijl PCM. MRI Atlas of Human White Matter. New York: Elsevier; 2005. [Google Scholar]
- 25.Ludwig E, Klingler J. Atlas cerebri humani. Der innere Bau des Gehirns dargestellt auf Grund makroskopischer Präparate. The inner structure of the brain demonstrated on the basis of macroscopical preparations. Boston: Little, Brown; 1956. [Google Scholar]
- 26.Catani M, Howard RJ, Pajevic S, Jones DK. Virtual in vivo interactive dissection of white matter fasciculi in the human brain. Neuroimage. 2002;17:77–94. doi: 10.1006/nimg.2002.1136. [DOI] [PubMed] [Google Scholar]
- 27.Wakana S, Jiang H, Nagae-Poetscher LM, van Zijl PC, Mori S. Fiber tract-based atlas of human white matter anatomy. Radiology. 2004;230:77–87. doi: 10.1148/radiol.2301021640. [DOI] [PubMed] [Google Scholar]
- 28.Rorden C, Brett M. Stereotaxic display of brain lesions. Behav Neurol. 2000;12:191–200. doi: 10.1155/2000/421719. [DOI] [PubMed] [Google Scholar]
- 29.Brickman AM, Buchsbaum MS, Bloom R, Bokhoven P, Paul-Odouard R, Haznedar MM, Dahlman KL, Hazlett EA, Aronowitz J, Heath D, Shihabuddin L. Neuropsychological functioning in first-break, never-medicated adolescents with psychosis. J Nerv Ment Dis. 2004;192:615–622. doi: 10.1097/01.nmd.0000138229.29157.3e. [DOI] [PubMed] [Google Scholar]
- 30.Axer H, Keyserlingk DG. Mapping of fiber orientation in human internal capsule by means of polarized light and confocal scanning laser microscopy. J Neurosci Methods. 2000;94:165–175. doi: 10.1016/s0165-0270(99)00132-6. [DOI] [PubMed] [Google Scholar]
- 31.Gulani V, Webb AG, Duncan ID, Lauterbur PC. Apparent diffusion tensor measurements in myelin-deficient rat spinal cords. Magn Reson Med. 2001;45:191–195. doi: 10.1002/1522-2594(200102)45:2<191::aid-mrm1025>3.0.co;2-9. [DOI] [PubMed] [Google Scholar]
- 32.Barnea-Goraly N, Menon V, Krasnow B, Ko A, Reiss A, Eliez S. Investigation of white matter structure in velocardiofacial syndrome: a diffusion tensor imaging study. Am J Psychiatry. 2003;160:1863–1869. doi: 10.1176/appi.ajp.160.10.1863. [DOI] [PubMed] [Google Scholar]
- 33.Schmithorst VJ, Wilke M, Dardzinski BJ, Holland SK. Cognitive functions correlate with white matter architecture in a normal pediatric population: a diffusion tensor MRI study. Hum Brain Mapp. 2005;26:139–147. doi: 10.1002/hbm.20149. [DOI] [PMC free article] [PubMed] [Google Scholar]
- 34.Furutani K, Harada M, Minato M, Morita N, Nishitani H. Regional changes of fractional anisotropy with normal aging using statistical parametric mapping (SPM) J Med Invest. 2005;52:186–190. doi: 10.2152/jmi.52.186. [DOI] [PubMed] [Google Scholar]
- 35.Salat DH, Tuch DS, Greve DN, van der Kouwe AJ, Hevelone ND, Zaleta AK, Rosen BR, Fischl B, Corkin S, Rosas HD, Dale AM. Age-related alterations in white matter microstructure measured by diffusion tensor imaging. Neurobiol Aging. 2005;26:1215–1227. doi: 10.1016/j.neurobiolaging.2004.09.017. [DOI] [PubMed] [Google Scholar]
- 36.Pfefferbaum A, Adalsteinsson E, Sullivan EV. Frontal circuitry degradation marks healthy adult aging: evidence from diffusion tensor imaging. Neuroimage. 2005;26:891–899. doi: 10.1016/j.neuroimage.2005.02.034. [DOI] [PubMed] [Google Scholar]
- 37.Szeszko PR, Vogel J, Ashtari M, Malhotra AK, Bates J, Kane JM, Bilder RM, Frevert T, Lim K. Sex differences in frontal lobe white matter microstructure: a DTI study. Neuroreport. 2003;14:2469–2473. doi: 10.1097/00001756-200312190-00035. [DOI] [PubMed] [Google Scholar]
- 38.Shin YW, Kim DJ, Ha TH, Park HJ, Moon WJ, Chung EC, Lee JM, Kim IY, Kim SI, Kwon JS. Sex differences in the human corpus callosum: diffusion tensor imaging study. Neuroreport. 2005;16:795–798. doi: 10.1097/00001756-200505310-00003. [DOI] [PubMed] [Google Scholar]
- 39.Westerhausen R, Kreuder F, Dos Santos Sequeira S, Walter C, Woerner W, Wittling RA, Schweiger E, Wittling E. Effects of handedness and gender on macro- and microstructure of the corpus callosum and its subregions: a combined high-resolution and diffusion-tensor MRI study. Brain Res Cogn Brain Res. 2004;21:418–426. doi: 10.1016/j.cogbrainres.2004.07.002. [DOI] [PubMed] [Google Scholar]
- 40.Chepuri NB, Yen YF, Burdette JH, Li H, Moody DM, Maldjian JA. Diffusion anisotropy in the corpus callosum. AJNR Am J Neuroradiol. 2002;23:803–808. [PMC free article] [PubMed] [Google Scholar]
- 41.Snook L, Paulson LA, Roy D, Phillips L, Beaulieu C. Diffusion tensor imaging of neurodevelopment in children and young adults. Neuroimage. 2005;26:1164–1173. doi: 10.1016/j.neuroimage.2005.03.016. [DOI] [PubMed] [Google Scholar]
- 42.Sullivan EV, Adalsteinsson E, Pfefferbaum A. Selective age-related degradation of anterior callosal fiber bundles quantified in vivo with fiber tracking. Cereb Cortex. 2005;16:1030–1039. doi: 10.1093/cercor/bhj045. [DOI] [PubMed] [Google Scholar]
- 43.Highley JR, Esiri MM, McDonald B, Roberts HC, Walker MA, Crow TJ. The size and fiber composition of the anterior commissure with respect to gender and schizophrenia. Biol Psychiatry. 1999;45:1120–1127. doi: 10.1016/s0006-3223(98)00323-0. [DOI] [PubMed] [Google Scholar]
- 44.Gong G, Jiang T, Zhu C, Zang Y, Wang F, Xie S, Xiao J, Guo X. Asymmetry analysis of cingulum based on scale-invariant parameterization by diffusion tensor imaging. Hum Brain Mapp. 2005;24:92–98. doi: 10.1002/hbm.20072. [DOI] [PMC free article] [PubMed] [Google Scholar]
- 45.Lancaster JL, Woldorff MG, Parsons LM, Liotti M, Freitas CS, Rainey L, Kochunov PV, Nickerson D, Mikiten SA, Fox PT. Automated Talairach atlas labels for functional brain mapping. Hum Brain Mapp. 2000;10:120–131. doi: 10.1002/1097-0193(200007)10:3<120::AID-HBM30>3.0.CO;2-8. [DOI] [PMC free article] [PubMed] [Google Scholar]
- 46.Kingsley PB, Monahan WG. Contrast-to-noise ratios of diffusion anisotropy indices. Magn Reson Med. 2005;53:911–918. doi: 10.1002/mrm.20433. [DOI] [PubMed] [Google Scholar]


