Abstract
We report the design of a self-assembled aptamer–micelle nanostructure that achieves selective and strong binding of otherwise low-affinity aptamers at physiological conditions. Specific recognition ability is directly built into the nanostructures. The attachment of a lipid tail onto the end of nucleic acid aptamers provides these unique nanostructures with an internalization pathway. Other merits include: extremely low off rate once bound with target cells, rapid recognition ability with enhanced sensitivity, low critical micelle concentration values, and dual-drug delivery pathways. To prove the potential detection/delivery application of this aptamer–micelle in biological living systems, we mimicked a tumor site in the blood stream by immobilizing tumor cells onto the surface of a flow channel device. Flushing the aptamer–micelles through the channel demonstrated their selective recognition ability under flow circulation in human whole-blood sample. The aptamer–micelles show great dynamic specificity in flow channel systems that mimic drug delivery in the blood system. Therefore, our DNA aptamer–micelle assembly has shown high potential for cancer cell recognition and for in vivo drug delivery applications.
Keywords: DNA aptamers, drug delivery, micelles, molecular specificity
Many interesting nanomaterials, either natural or artificial, have been designed to perform unique functions through the process of molecular self-assembly. In nature, the apoptosome (1) is one such example. Individual apaf-1 protein does not have a biological function; however, when forming a complex with cytochrome–c, several individual proteins self-assemble into a wheel structure called an apoptosome. Once formed, the apoptosome can then recruit and activate the otherwise inactive pro-caspase-9 that can then activate other caspases and trigger a cascade of events leading to apoptosis. Learning from nature, chemists have created various artificial nanostructures. Micelle is one of such examples. Polymeric micelles have been subjected to extensive studies in the field of drug delivery, functioning as drug solibilizers and carriers (2). More recently, a micelle constructed as a hybrid from hydrophilic oligonucleotide and hydrophobic polymer (3, 4) has drawn close attention. In aqueous solutions, this type of amphiphilic block copolymer can self-assemble into a three-dimensional spherical micelle structure or a nanorod-like micelle structure. This type of micelle has been shown to efficiently carry a variety of cargos to cells, including antisense oligonucleotides (5) and drug molecules (6). To perform efficient targeted delivery, folic acid, a type of cancer cell recognition molecule modified on a piece of short, complementary DNA, was clicked onto the micelles based on Watson–Crick base pairing (6).
Aside from Watson–Crick base pairing, single-stranded oligonucleotides can recognize other target molecules based on noncovalent interactions, such as hydrophobic interaction and hydrogen bonding. This type of oligonucleotide ligand is known as an aptamer that can tightly bind to specific target molecules, such as small molecules, proteins, and even cancer cells (7,8–9). Compared to antibodies, aptamers possess a few critical advantages, such as small size, lack of immunogenicity, and ease of synthesis and modification (10, 11). We believe that attaching a hydrophobic tail to the end of an aptamer should result in a highly ordered micelle-like structure. In this type of aptamer assembly, the aptamer strand would not only act as the building block for the nanostructure, but also perform a recognition function to its specific target. Furthermore, densely packing aptamers on such an assembly could create a multivalent effect, leading to greatly improved binding affinity of the aptamers. Engineering this type of aptamer micelle can be simple and could result in enhanced binding capability to its specific targets. Micelles are also considered to be dynamic and soft materials. Because the cell membrane is basically a dynamic lipid bilayer, a “soft” nanomaterial might produce some interesting interactions with it, particularly where such interactions involve cell permeability and drug delivery. In fact, we have generated a pool of aptamers specifically targeting various cancer cells (9, 12), thus paving the way for the construction of aptamer micelles with applications in diagnosis and targeted therapy.
Results and Discussion
Aptamer Micelle Construction.
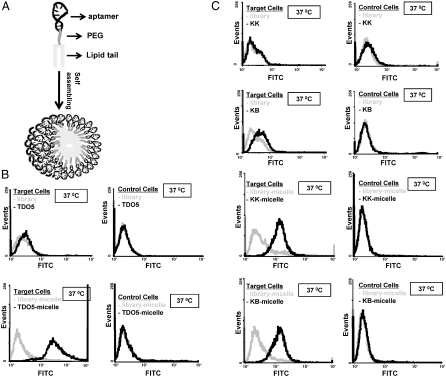
As indicated in the scheme (Fig. 1A), we have attached a simple lipid tail phosphomidite with diacyl chains onto the end of an aptamer inserted with a PEG linker. This amphiphilic unit self-assembled into a spherical micelle structure, as demonstrated in the transmission electron microscope (TEM) image (Fig. S1B). The aptamer used in this case is called TDO5, which was selected specific to Ramos cells (a B-cell lymphoma cell line) (12). As shown in Fig. S1B, the TDO5-micelle has an average diameter of 68 ± 13 nm that is consistent with the hydrodynamic diameter measured by Dynamic Light Scattering (DLS) of 67.22 nm (Fig. S1C).
Fig. 1.
(A). Schematic illustration of aptamer–micelle formation. All the related sequences are listed in Table 1. (B). Flow cytometric assay to monitor the binding of free TDO5 (250 nM) and with Ramos cells (target cells) and HL60 (control cells) at 37 °C for 5 minutes. The blue and black curves represent the background binding of unselected DNA library or library-micelle. The gray curves represent the binding of TDO5 or TDO5-micelle. (C). Flow cytometric assay to monitor the binding of free aptamer (250 nM) and aptamer–micelle (250 nM based on lipid unit concentration) with target cells (K562) and control cell (CCRF-CEM) at 37 °C for 5 minutes. Neither FITC-KK nor FITC-KB aptamers bind (or bind only weakly) to the target cells. However, FITC-KK-micelle and FITC-KB-micelle show increased binding to the target cells. All probes (FITC-KK, FITC-KB, FITC-KK-micelle, FITC-KB-micelle) do not bind with control cells.
Enhanced Binding at Physiological Temperature.
Interestingly and surprisingly, the formation of an aptamer–micelle was found to enhance the binding capability of otherwise low-affinity aptamers at physiological temperature. TDO5 is such an aptamer. At 4 °C, TDO5 showed high affinity and selectivity for its target protein, immunoglobin heavy mu chain receptor on cell surface (13) that indicates that this surface cell membrane protein has an upregulated expression in Ramos cells. On the other hand, TDO5 did not bind with Ramos cells at 37 °C (Fig. 1B), which could seriously hinder its potential in vivo applications. However, when TD05 is used for micelle formation, the TDO5-micelle was also found to have excellent binding selectivity at 37 °C. As shown in Fig. 1B, when binding with target cells, about 80-fold enhancement in fluorescence intensity was observed for TDO5-micelle, whereas no binding shift was found with control cells.
The dissociation constants of the aptamer–micelles were also investigated. Because a similar size of polymer micelle (60 nm) was estimated to have 1,000 copies of units (14), one TDO5-micelle (68 nm) is assumed to have the same estimated unit numbers. As shown in Fig. S2A, the TD05-micelle has a Kd of 116 nM. If one TDO5–micelle has 1,000 copies of DNA-lipid units, the dissociation constant after constructing the micelle structure would be greatly decreased from 88 nM (for free TDO5) to 0.116 nM (for TDO5-micelle). This approximate 750-fold increase in binding affinity might be ascribed to the multivalent effect from multiple aptamer binding.
Based on these findings, the lipid tail plus linker modification can be a universal strategy to promote the binding abilities of low-affinity aptamers, as demonstrated by the improved binding behaviors observed after attaching lipid tails onto the end of two other low-affinity aptamers, KK and KB (Fig. 1C).
Extremely Low koff.
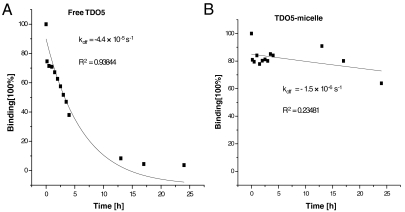
Generally, a low off rate tends to indicate that the binding is strong and difficult to be replaced. To test the micelle’s binding strength in comparison to single aptamer, the koff rate of our aptamer–micelle was examined by a competition experiment. As shown in Fig. 2, after 1 d of competition with unlabeled TDO5-aptamer, almost all the bound labeled TDO5 was replaced. Plotting the competition data of free TDO5 showed an exponential decay with a koff of -4.4 × 10⁻⁵ S-1 (R2 = 0.93844). In contrast, after the same competition condition, a very low percentage of bound TDO5-micelles was replaced by free TDO5 with a koff of -1.5 × 10⁻⁶ S-1 (R2 = 0.23481). We noticed that the coefficient for the data fitting in TDO5-micelle case is quite low, which indicates that the off rate pattern of TDO5-micelle might not be the same as the exponential pattern. Similar low off rates and low R2 were observed for the other two aptamer–micelles based on KK and KB aptamers (Fig. S2B).
Fig. 2.
Time course of displacement of FITC-TDO5 (A) or FITC-TDO5-micelle (B) bound onto the target cells by competition with an excess of non-labeled TDO5. Cells were incubated with binding buffer containing 250 nM FITC-labeled probes for 20 minutes at 4 °C. Then 2.5 μM non-labeled TDO5 was added to the cells and flow cytometric measurements were carried out at times as shown in the x-axis. The fluorescence intensity before the displacement was normalized to 100% binding. The fluorescence intensity of each data point was normalized to the binding percentage.
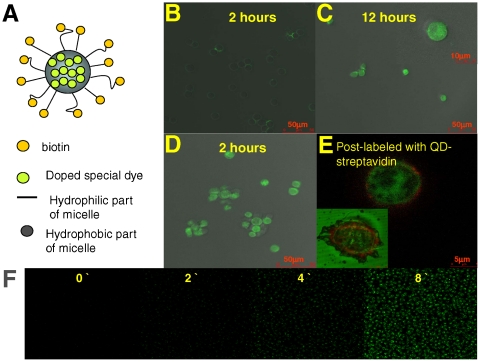
Based on these extremely low off rates, considering the fact that both aptamer–micelle and cell membrane have hydrophobic and hydrophilic portions, we speculate that the aptamer–micelle can be integrated into the cell membrane facilitated by the lipid tail and that the preferred thermal stability does not allow the aptamer–micelle to easily diffuse out. To determine whether our aptamer–micelles could fuse with cell membrane, we doped TDO5-micelles with a special dye that only fluoresces inside cells (CellTracker™) (see scheme in Fig. 3A). As shown in Fig. 3B and C, after incubating the cells with free cell tracker for 12 h, a strong fluorescence signal was observed inside the cells, whereas a very weak fluorescene signal was present after 2 h of incubation. In contrast, it was only after an incubation of 2 h with dye-doped TDO5-micelles that most of the cells produced a strong fluorescence signal (Fig. 3D). To determine whether some or all the aptamer–micelles remained on the cell surface, we post-incubated streptavidin-quantum dots 705 (QD705) with the cells after binding biotin-labeled TDO5-micelle to the cells. Fig. 3E shows a strong red fluorescence signal around the cell membrane that indicates that at least some of the aptamer–micelles remained bound to the cell membrane after the dye was released. Exposing the cells to strong UV illumination for a long time leads to cell apoptosis and the leakage of activated fluorescent cell tracker dyes into the incubation buffer. As shown in Fig. 3E, a strong green fluorescent signal was observed outside the apoptotic cells whereas a clear QD705 halo remained where the cell membrane would have been, indicating the integration of the aptamer–micelle into the membrane (Fig. 3E inset). Based on our real-time monitoring of the fluorescence from the cell tracker at room temperature (Fig. 3F), fusion of the micelles with the cell membranes occurs within minutes.
Fig. 3.
(A). Design scheme of dye-doped micelles. Bright field and fluorescent images of Ramos cells after incubation with free CellTracker™ Green BODIPY for 2 h (B) and 12 h (C), or incubation with biotin-TDO5-micelle doped with CellTracker™ Green BODIPY for 2 h (D). Image E is the enlarged fluorescent image after postlabeling the biotinylated TDO5 aptamer with QD705 streptavidin. The inset in image C is the enlarged individual cell image. The inset in image E is the fluorescent image of the dead cell. (F). Real-time monitoring of doped special dyes released from the core of the micelles and activated by intracellular enzymes.
The above experiments reveal the potential fusion between aptamer–micelles and the cell membrane. Thus, the interaction process between aptamer–micelles and cells is speculated to be fluidic in nature, involving specific interaction-induced nonspecific insertion (see Supporting Information Fig. S9 for detailed hypothesized mechanism and related experiments).
TDO5-Micelle Helps Cell Internalization.
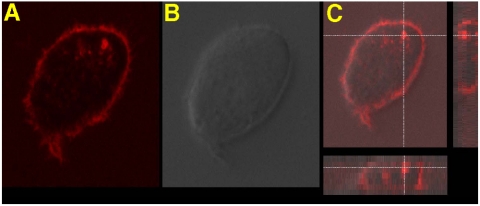
Although some of the aptamers by themselves lack an internalization pathway, the introduction of this unique nanostructure formation allows the aptamer–micelles to, ultimately, penetrate the cells they target. As shown in Fig. 4, a clear fluorescence signal inside the cells confirmed by optical imaging with confocal Z-axis depth scanning was observed. Because TDO5 alone does not internalize, there must be another mechanism occurring that might be related to membrane recycling. This interesting internalization pathway created by the attachment of the lipid tail, as detailed above, can widen aptamer applications in therapy that usually requires conjugated drug delivered into the cells.
Fig. 4.
The enlarged fluorescence image (A), bright field image (B), and stack image after Z-depth scanning (C) of Ramos cells after incubation with TMR-TDO5-micelle in complete cell medium at 37 °C for 2 h. The cross mark in image C indicates that the brightest fluorescence signal comes from inside the cell. (D) Colocalization of TMR-TDO5-micelle (red) and AF633-transferrin (blue) in endosomes.
Rapid Identification With High Sensitivity.
This TDO5-micelle demonstrated extremely rapid recognition of the target cells. As shown in Fig. S3A, after an incubation of only 30 s at 37 °C, a 45-fold enhancement in fluorescence intensity when binding with target cells was observed for TDO5-micelle. Again, no significant binding was observed for the control cells. Although a targeting time shorter than 30 s might be possible, we did not attempt it because of experimental difficulties. Because every piece of DNA-lipid is labeled with one single FITC dye at the 3’ end, one recognition event from one aptamer–micelle can induce multiple-dye staining to target cells. Therefore, this aptamer–micelle structure is suggested to provide an additional signal enhancement. As shown in Fig. S3B, even at about 0.005 nM (or 5 nM, based on DNA-lipid concentration), noticeable fluorescence shift was still observed when binding with target cells.
Trace Cell Detection in Whole Blood Sample.
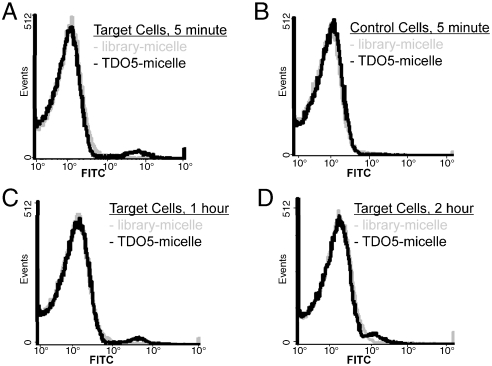
To evaluate the detection ability of TDO5-micelle in a complex environment, we spiked one million target cells/control cells directly in 50 uL human whole blood sample (about 310 million cells) and then incubated the TDO5-micelle with the cell mixture at 37 °C for 5 min. Based on the flow data shown in Fig. 5, obvious binding shift was observed when binding to the target cells, but no significant binding shift happened in the control cell mixture. Similar to control, no binding shifts happened in the absence of spiked target cells in whole blood sample (see Fig. S4A). These flow data prove that the aptamer–micelle can detect trace target cells selectively, even in a complex environment.
Fig. 5.
Flow cytometric assay to monitor the binding of 250 nM TDO5-micelle or library-micelle (based on lipid-unit concentration) with cell mixture made by spiking 1 million Ramos (target cells, A,C and D) or HL60 (control cells, B) in 50 uL male whole blood. The incubation time varied from 5 m (A & B) to 1 h (C) and 2 hours (D). The gray and black curves represent the binding of unselected DNA library-micelle and TDO5-micelle, resp.
Meanwhile, when we lengthened the incubation time from 5 min to 2 h, smaller binding shifts were observed (Fig. 5C and D). It is suggested that the susceptibility of DNA to enzyme digestion in plasma at 37 °C after long incubation is the main reason for the reduced binding shifts (15). The nuclease digestion of DNA probes has been investigated before and there are modifications one can do to increase the stability of these DNA aptamers (16, 17).
We do not believe that the higher nonspecific binding of DNA-micelles after long incubation in this complex environment causes the smaller binding shifts. As shown in Fig. 5 and Fig. S4A, the nearly identical fluorescence intensities of library-micelle were observed irrespective of how long it was incubated with whole-blood cell mixture. Comparing the increased nonspecific bindings with increased incubation time in pure buffer sample, as shown in Fig. S4B, we think that the difference in total cell numbers in these two different cases may well lead to different nonspecific interaction patterns. Because the total cell number is extremely high per-whole-blood cell mixture sample (about 311 million cells), but much lower for the pure buffer incubation (only 1 million cells), the micelle concentration per cell should be extremely low. This leads to the absence of significant nonspecific binding, even after 2 h of incubation for whole-blood cell mixture.
Aptamer–Micelle Targeting In a Flow Channel Under a Continuous Flow.
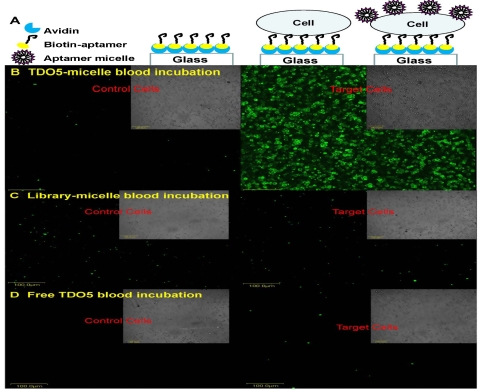
To investigate whether aptamer–micelles can be used for selective targeting under the dynamic fluid conditions of blood circulation, a simplified flow channel was used to mimic the circulatory environment. While we understand there is a significant difference between the fluidic channel and the blood vessel, we believe that this flow dynamic study will give us hint about future possibilities in using this micelle system as a detection/delivery system with dynamic specificity. As shown in the scheme in Fig. 6A, two biotin-labeled aptamers (biotin-sgc8 and biotin-TDO5) were individually immobilized onto either side of a glass channel by using avidin-biotin interactions. Following this step, their corresponding target cells (CCRF-CEM for sgc8 and Ramos for TDO5) were flowed through and captured by the immobilized aptamers. In this way, two different cell zones were established in the flow channel: CCRF-CEM in the control cell zone and Ramos in the target cell zone for TDO5 aptamer.
Fig. 6.
Simplified flow channel response to cell-staining assay. (A). Stepwise immobilization scheme of the flow channel. Representative images of the bright field and fluorescent images of control cells (CCRF-CEM) and target cells (Ramos) captured on the flow channel surface incubated with FITC-TDO5-micelle (B), or FITC-library-micelle (C) or free FITC-TDO5 (D) spiked in human whole blood sample under continuous flow at 300 nL/s at 37 °C for 5 m. All the scale bars are 100 μm.
As the first step, the targeting ability of aptamer–micelle spiked in a simple pure binding buffer system at 37 °C inside the flow channel under continuous flushing was evaluated. For micelle-buffer incubation, either FITC-TDO5-micelle or FITC-library-micelle diluted in binding buffer was continuously flushed through the two cell zones sequentially at 37 °C for 5 min at 300 nL/s. The same results were observed irrespective of which direction the DNA-micelle was sucked through the two types of cell zones. A representative result after micelle-buffer incubation with FITC-TDO5-micelle is shown in Fig. S5. In this case, strong fluorescence signal was seen from the target cell zone, but no noticeable fluorescence signal from the control cell zone. In contrast, no fluorescence signal was observed in either cell zone after incubating with a control FITC-library-micelle or free FITC-TDO5 aptamer at 37 °C.
As the second step, blood circulation in living systems was mimicked to further test the targeting ability of aptamer–micelle spiked in complex human whole blood sample under continuous flushing at 37 °C. To avoid cleaning difficulties, a simplified flow channel made of double glass slides was preferred over a PDMS flow channel for micelle-blood incubation. Representative results after micelle-blood incubation are presented in Fig. 6. As in the micelle-buffer incubation system, strong fluorescence signal was seen from the target cell zone after incubation with TDO5-micelle spiked in whole blood sample, but no noticeable fluorescence signal from control cell zone was seen. In contrast, no fluorescence signal was observed in either cell zone after incubating with a control FITC-library-micelle spiked in whole blood sample.
Although circulation velocity in living systems might be much faster than 300 nl/s in most locations (18), we would expect the aptamer–micelle to have recognition to the target cells better than, or at least equal to that which is shown in this dynamic incubation channel with a faster circulation rate. Based on our in vitro study of the effect of the incubation time on cell recognition ability using fixed cell numbers (Fig. S4B), increasing incubation time resulted in a decrease of selectivity and ; thus, a shorter incubation time might either have no effect at all, or it might even lead to better binding selectivity, especially considering the rapid identification ability of aptamer–micelles. These results indicate that the aptamer–micelle can perform selective recognition in a complex environment that mimics (18) blood circulation.
Moreover, this aptamer–micelle was found to have low CMC and low cytotoxicity to the cells (Fig. S6). As such, this type of aptamer–micelle is proposed to be an efficient drug delivery vehicle for target cells without the need for internalization of the aptamer’s target molecule. Instead, aptamer–micelles can simply interact with the cell membrane and quickly release the doped hydrophobic molecules into the cells that is similar to the published polymeric micelle system (14). Meanwhile, however, through membrane replacement, aptamer–micelles permeate cells. Thus, this type of aptamer–micelle offers two kinds of drug delivery pathways: direct releasing of doped drug and internalization by direct drug-aptamer–micelle conjugation. Finally, by replacing PEG-lipid with therapeutic aptamer drug-lipid, the heterogeneous aptamer–micelle can specifically deliver aptamer drugs around the target cell surface. For instance, by lipid tail plus linker modification, we can construct a lipid molecule from Macugen, an Food and Drug Administration-approved aptamer selected against vascular endothelial growth factor. By replacing PEG-lipid with Macugen-lipid in Fig. S8, we expect that this aptamer–micelle will be able to draw all the Macugen-lipids to a specific tumor cell surface that would greatly increase the localized drug concentration to enhance inhibition potency.
Conclusion
In summary, we have developed an aptamer–micelle assembly for efficient detection/delivery targeting specific cancer cells. This aptamer–micelle enhances the binding ability of the aptamer moiety at physiological temperature, even though the corresponding free aptamer loses its binding ability under the same condition. The merits of aptamer–micelles include greatly improved binding affinity, low koff once on the cell membrane, rapid targeting ability, high sensitivity, low CMC values, and the creation of a dual drug delivery pathway. Most importantly, the aptamer–micelles show great dynamic specificity in flow channel systems that mimic drug delivery in a flowing system. All of these advantages endow this unique assembly with the capacity to function as an efficient detection/delivery vehicle in the biological living system.
Materials and Methods
Materials.
Unless specified, chemicals were purchased from Sigma–Aldrich and used without further purification. DNA synthesis reagents were purchased from Glen Research. The single-walled carbon nanotubes were purchased from Unidym, Inc. with < 5wt% ash content (CAS number: 7782-42-5). CellTracker™ Green BODIPY (C2102) and Qdot 705 streptavidin conjugate (Q10161MP) were purchased from Invitrogen. All flow cytometry data were acquired with a FACScan cytometer (Becton Dickinson Immunocytometry Systems). Ramos (CRL-1596, B-cell line, human Burkitt`s Lymphoma), CCRF-CEM (CCL-119, T-cell line, human Acute Lymphoblastic Leukemia), K562 (CCL-243, chronic myelogenous leukemia, and HL60 (CCL-240, acute promyelocytic leukemia) were obtained from American Type Culture Collection. The NB4 cell line was kindly provided by Shands Hospital. All cell lines were cultured in RPMI 1640 medium (ATCC) supplemented with 10% fetal bovine serum (heat inactivated, GIBCO) and 100 IU/mL penicillin-streptomycin (Cellgro). The wash buffer contained 4.5 g/L glucose and 5 mM MgCl2 in Dulbecco’s PBS (Sigma). Binding buffer used for the aptamer binding assays was prepared by adding yeast tRNA (0.1 mg/mL) (Sigma) and BSA (1 mg/mL) (Fisher) into the wash buffer to reduce background binding.
Synthesis of Aptamer-Lipid Sequence.
An ABI3400 DNA/RNA synthesizer (Applied Biosystems) was used for the preparation of all DNA sequences. All oligonucleotides were synthesized based on solid-state phosphoramidite chemistry at a 1 µmol scale. The aptamer-lipid sequences listed in Table 1 were synthesized in controlled-pore glass columns with a 3’-(6-FAM), TAMRA or biotin TEG covalently linked to the CPG substrate. The complete aptamer-lipid sequences were then deprotected in AMA solution (concentrated ammonia hydroxide: methylamine equals 1:1) at 65 °C for 15 min for FAM/biotin labeling or a solution of methnol: tert-butylamine: water (1:1:2) at 65 °C for 3 h for TMR labeling. A ProStar HPLC (Varian) with a C8 column (from Alltech) was used for probe purification. Deprotected sequences were purified with a linear elution gradient with triethylammonium acetate in acetonitrile changing from 20% to 70% over a 30 min period. The collection from the first HPLC separation was then vacuum dried. Spacer phosphoramidite 18 was used as the linker between DNA and lipid tail. Lipid tail phosphoramidite dissolved in methylene chloride was directly coupled onto the sequence by the synthesizer. The synthesis of lipid tail phosphoramidite is described in SI Text section. A Cary Bio-300 UV spectrometer (Varian) was used to measure absorbance for probe quantification.
Table 1.
All of the oligonucleotides used in this work
| Name | Sequence | |
| Aptamer–micelles and library-micelle | FAM-TDO5-micelle | 5′-lipid tail-(CH2CH2O)24-AAC ACC GGG AGG ATA GTT CGG TGG CTG TTC AGG GTC TCC TCC CGG TGA-FAM-3′ |
| Biotin-TDO5-micelle | 5′-lipid tail-(CH2CH2O)24-AAC ACC GGG AGG ATA GTT CGG TGG CTG TTC AGG GTC TCC TCC CGG TGA-biotin-3′ | |
| TMR-TDO5-micelle | 5′-lipid tail-(CH2CH2O)24-AAC ACC GGG AGG ATA GTT CGG TGG CTG TTC AGG GTC TCC TCC CGG TGA-TMR-3′ | |
| KK-micelle | 5′-lipid tail-(CH2CH2O)24-ATC CAG AGT GAC GCA GCA GAT CAG TCT ATC TTC TCC TGA TGG GTT CCT AGT TAT AGG TGA AGC TGG ACA CGG TGG CTT AGT-FAM-3′ | |
| KB-micelle | 5'- lipid tail-(CH2CH2O)24-ACA GCA GAT CAG TCT ATC TTC TCC TGA TGG GTT CCT ATT TAT AGG TGA AGC TGT-FAM-3' | |
| Library-micelle | 5′- lipid tail-(CH2CH2O)24-(N)n*-FAM -3' | |
| Aptamers and library | FAM-TDO5 | 5′-AAC ACC GGG AGG ATA GTT CGG TGG CTG TTC AGG GTC TCC TCC CGG TGA-FAM-3′ |
| FAM-KK | 5′-ATC CAG AGT GAC GCA GCA GAT CAG TCT ATC TTC TCC TGA TGG GTT CCT AGT TAT AGG TGA AGC TGG ACA CGG TGG CTT AGT-FAM-3′ | |
| FAM-KB | 5′-ACA GCA GAT CAG TCT ATC TTC TCC TGA TGG GTT CCT ATT TAT AGG TGA AGC TGT-FAM-3' | |
| FAM-library | 5′- NNN NNN NNN NNN NNN NNN NNN NNN NNN NNN NNN NNN NNN NNN NNN NNN-FAM -3' | |
| TDO5 for Au NP | 5′-Cy5-AAC ACC GGG AGG ATA GTT CGG TGG CTG TTC AGG GTC TCC TCC CGG TGA TTT TTT TTT TTT TTT-biotin -3′ | |
| Library for Au NP | 5′-Cy5-NNN NNN NNN NNN NNN NNN NNN NNN NNN NNN NNN NNN NNN NNN NNN NNN TTT TTT TTT TTT TTT-biotin -3′ | |
| Biotin-TDO5 for flow channel | 5′-AAC ACC GGG AGG ATA GTT CGG TGG CTG TTC AGG GTC TCC TCC CGG TGA TTT TTT TTT T-biotin-3′ | |
| Biotin-sgc8 for flow channel | 5′-ATC TAA CTG CTG CGC CGC CGG GAA AAT ACT GTA CGG TTA GAT TTT TTT TTT-biotin-3′ | |
* n is base number which is equal to the corresponding aptamer sequences.
Micelle Characterization.
TEM images were obtained after negative staining with 1% aqueous Uranyl Acetate by using a transmission electron microscope (Hitachi H-7000). The TEM samples were dropped onto standard holey carbon-coated copper grids. DLS measurements were carried out at room temperature by using a Brookhaven Zeta PALS analyzer. Aptamer–micelles were dissolved in PBS buffer by using a transmission electron microscope (Hitachi H-700).
Flow Cytometric Analysis.
To demonstrate the cell-specific targeting capabilities of aptamer-lipids, fluorescence measurements were made by using a FACScan cytometer (Becton Dickinson Immunocytometry Systems). The binding was performed by the following procedure. 250 nM aptamer–micelle/library-micelle (based on lipid unit concentration) in binding buffer was added to about 1 million cells in the individual flow tubes. The prewarmed mixture was incubated at 37 °C in a cell incubator for various time periods. After incubation, the cells were immediately washed twice with cold washing buffer. The fluorescence was determined by counting 15,000 events.
Competition assays to measure the off rate of the aptamer-cell interaction (koff) were performed as follows. An aptamer concentration of 250 nM was incubated with cells for 20 min at 4 °C for 20 min to allow the aptamer to bind to the target in the cell membrane. After the incubation, the cells were washed to remove unbound aptamer. Finally, the labeled cells were incubated with 2.5 uM of unlabeled aptamer at 4 °C for various incubation times. The mean fluorescence intensity was measured at different incubation times after a brief vortexing of the cell mixture. koff was obtained by fitting the dependence of the binding percentage over time to the equation  (koffX) where Y is a binding percentage and X is time. The fluorescence intensity before the displacement was normalized to 100% binding. Additionally, the equilibrium dissociation constants (Kd) of the aptamer-cell interactions were obtained by fitting the dependence of fluorescence intensity of specific bindings on the concentrations of the aptamers to the equation Y = BmaxX/(Kd + X) by SigmaPlot (Jandel).
Preparation of Biotin-TDO5-Micelles Doped With Dyes.
Dye-doped aptamer–micelles were prepared by the precipitation and membrane dialysis method. Fifteen pmol of dry biotin-TDO5-micelle (based on lipid unit) was dissolved in 20 μL ethanol and then thoroughly mixed with 6.74 nmol CellTracker™ Green BODIPY. The solution was then added dropwise into 100 μL deionized water while stirring. After stirring for about 3 h to evaporate the ethanol, the aqueous solution was dialyzed against 1.5 L water (Spectra/MWCO3500) for 2 d. The water was changed five times during the dialysis period. Finally, the solution was filtered through a 0.22 um filter to remove any undesirable aggregates and stored at 4 °C.
Confocal Imaging.
Cell images were made with a confocal microscope setup consisting of a Leica TCS SP5 Laser Scanning Confocal Microscope. For real-time monitoring, fluorescent images were taken every minute at a fixed depth. Two uM cell tracker dye and/or about 4.5 uM aptamer–micelle (based on lipid unit concentration) were incubated with the cells in complete cell medium at 37 °C. For the colocalization experiment, cells were incubated with TMR-TDO5-micelle (250 nM) in RPMI-1640 complete medium at 37 °C for 3 h, and then AF633-transferrin (60 nM) was added 30 min before the termination of incubation. Incubation was stopped by placing the cell on ice immediately after washing with cold washing buffer.
Flow Channel Device Preparation and Incubation Under Continuous Flow.
For micelle-buffer incubation, a PDMS flow channel was used. PDMS devices were fabricated by using a process similar to what is described in the literature (19, 20). The layout of the device was designed in AutoCAD and printed on a transparency by using a high-resolution printer. The pattern on the transparency was transferred to a silicon wafer via photolithography. The silicon wafer was etched to a depth of 25 μm in a deep reactive-ion etching machine. The resulting silicon wafer with the desired pattern served as a mold to fabricate a number of PDMS devices. Sylgard 184 (Corning) reagents were prepared and thoroughly mixed by following the manufacturer’s instructions. After being degassed to remove bubbles, the mixture was cast on top of the silicon mold. After being cured at room temperature, the PDMS layer was peeled off the silicon mold. Two wells at both ends of the channel and one well in the middle of the channel were created by punching holes in the PDMS. The PDMS slice was reversibly attached to a clean 50 × 45 mm cover glass (Fisher) to form a device. Avidin and biotin-aptamer solutions were added to the wells at both channel ends sequentially (sgc8 aptamer for CCRF-CEM on the left side and TDO5 aptamer for TDO5 on the right side) and were sucked through channels by applying a vacuum to the middle well. Then the corresponding cell solutions were put to the corresponding end-wells, sucked slowly through the entire channel by applying a vacuum to one of the end-wells, and incubated at 37 °C for 5 min. After washing, the DNA-micelles diluted in binding buffer were continuously flushed through the channel at 300 nL/s for 5 min by connecting a Microsyringe pump (World Precision Instruments, Inc.) to the end-well of the channel (dynamic incubation). The channel was ready for confocal imaging after three washing steps. In between experiments, the PDMS devices were cleaned by sequential sonication in 20% bleach with 0.1 M NaCl and then 50∶1 water∶versaclean (Fisher) at 40 °C, followed by rinsing in deionized H2O and drying under N2.
For micelle-blood incubation, a simplified flow channel was made from double-glass slides glued together by double-sided tape. Instead of a microsyringe pump, a piece of filter paper was used to suck the solutions through the channel with average flow rate ∼300 nL/s.
Acknowledgments.
Thanks to Drs. Jilin Yan and Ye Xu for some technical help and Profs. Gail E. Fanucci, Ms. Dalia Lopez Colon, and Ms. Meghan B. O'Donoghue for their interesting discussion. This work was supported by National Institutes of Health grants; an ONR grant; and the State of Florida Center of Excellence grant.
Footnotes
The authors declare no conflict of interest.
This article is a PNAS Direct Submission.
This article contains supporting information online at www.pnas.org/cgi/content/full/0909611107/DCSupplemental.
References
- 1.Bao Q, Shi Y. Apoptosome: A platform for the activation of initiator caspases. Cell Death Differ. 2007;14:56–65. doi: 10.1038/sj.cdd.4402028. [DOI] [PubMed] [Google Scholar]
- 2.Mikhail AS, Allen C. Block copolymer micelles for delivery of cancer therapy: Transport at the whole body, tissue and cellular levels. J Control Release. 2009;138:214–223. doi: 10.1016/j.jconrel.2009.04.010. [DOI] [PubMed] [Google Scholar]
- 3.Ding K, Alemdaroglu FE, Borsch M, Berger R, Herrmann A. Engineering the structural properties of DNA block copolymer micelles by molecular recognition. Angew Chem Int Ed Engl. 2007;46:1172–1175. doi: 10.1002/anie.200603064. [DOI] [PubMed] [Google Scholar]
- 4.Alemdaroglu FE, Alemdaroglu NC, Langguth P, Herrmann A. Cellular uptake of DNA block copolymer micelles with different shapes. Macromolecular Rapid Communications. 2008;29:326–329. [Google Scholar]
- 5.Jeong JH, Park TG. Novel polymer-DNA hybrid polymer micelles composed of hydrophobic poly (D,L-lactic-co-glycolic acid) and hydrophilic oligonucleotides. Bioconjugate Chem. 2001;12:917–923. doi: 10.1021/bc010052t. [DOI] [PubMed] [Google Scholar]
- 6.Alemdaroglu FE, Alemdaroglu NC, Langguth P, Herrmann A. DNA block copolymer micelles-A combinatorial tool for cancer nanotechnology. Adv Mater. 2008;20:899–902. [Google Scholar]
- 7.Tuerk C, Gold L. Systematic evolution of ligands by exponential enrichment-RNA ligands to bacteriophage-T14 DNA-polymerase. Science. 1990;249:505–510. doi: 10.1126/science.2200121. [DOI] [PubMed] [Google Scholar]
- 8.Ellington AD, Szostak JW. In vitro selection of RNA molecules that bind specific ligands. Nature. 1990;346:818–822. doi: 10.1038/346818a0. [DOI] [PubMed] [Google Scholar]
- 9.Shangguan D, et al. Aptamers evolved from live cells as effective molecular probes for cancer study. P Natl Acad Sci USA. 2006;103:11838–11843. doi: 10.1073/pnas.0602615103. [DOI] [PMC free article] [PubMed] [Google Scholar]
- 10.Liu JW, Lu Y. Fast colorimetric sensing of adenosine and cocaine based on a general sensor design involving aptamers and nanoparticles. Angew Chem Int Edit. 2006;45:90–94. doi: 10.1002/anie.200502589. [DOI] [PubMed] [Google Scholar]
- 11.Yang HH, Liu HP, Kang HZ, Tan WH. Enginerring target-responsive hydrogels based on aptamer-target interactions. J Am Chem Soc. 2008;130:6320–6321. doi: 10.1021/ja801339w. [DOI] [PMC free article] [PubMed] [Google Scholar]
- 12.Tang ZW, et al. Selection of aptamers formolecular recognition and characterization of cancer cells. Anal Chem. 2007;79:4900–4907. doi: 10.1021/ac070189y. [DOI] [PubMed] [Google Scholar]
- 13.Mallikaratchy P, et al. Aptamer directly evolved from live cells recognizes membrane bound immunoglobin heavy mu chain in Burkitt's lymphoma cells. Mol Cel Proteomics. 2007;6:2230–2238. doi: 10.1074/mcp.M700026-MCP200. [DOI] [PubMed] [Google Scholar]
- 14.Chen HT, et al. Release of hydrophobic molecules from polymer micelles into cell membranes revealed by Forster resonance energy transfer imaging. P Natl Acad Sci USA. 2008;105:6596–6601. doi: 10.1073/pnas.0707046105. [DOI] [PMC free article] [PubMed] [Google Scholar]
- 15.Tsui NBY, Ng EKO, Lo YMD. Stability of endogenous and added RNA in blood specimens, serum, and plasma. Clin Chem. 2002;48:1647–1653. [PubMed] [Google Scholar]
- 16.Yang CJ, et al. Synthesis and investigation of deoxyribonucleic acid/locked nucleic acid chimeric molecular beacons. Nucleic Acids Res. 2007;35(12):4030–4041. doi: 10.1093/nar/gkm358. [DOI] [PMC free article] [PubMed] [Google Scholar]
- 17.Shangguan D, Tang Z, Mallikaratchy P, Xiao Z, Tan W. Optimization and modifications of aptamers selected from live cancer cell lines. ChemBioChem. 2007;8:603–606. doi: 10.1002/cbic.200600532. [DOI] [PubMed] [Google Scholar]
- 18.Jain RK. Determinants of tumor blood flow-a review. Cancer Res. 1988;48:2641–2658. [PubMed] [Google Scholar]
- 19.Duffy DC, McDonald JC, Schueller OJA, Whitesides GM. Rapid prototyping of microfluidic systems in poly (dimethylsiloxane) Anal Chem. 1998;70:4974–4984. doi: 10.1021/ac980656z. [DOI] [PubMed] [Google Scholar]
- 20.Phillips JA, Xu Y, Xia Z, Fan ZH, Tan WH. Enrichment of cancer cells using aptamers immobilized on a microfluidic channel. Anal Chem. 2009;81:1033–1039. doi: 10.1021/ac802092j. [DOI] [PMC free article] [PubMed] [Google Scholar]


