Abstract
Background
The amplification of RNA with the T7-System is a widely used technique for obtaining increased amounts of RNA starting from limited material. The amplified RNA (aRNA) can subsequently be used for microarray hybridizations, warranting sufficient signal for image analysis. We describe here an amplification-time dependent degradation of aRNA in prolonged standard T7 amplification protocols, that results in lower average size aRNA and decreased yields.
Results
A time-dependent degradation of amplified RNA (aRNA) could be observed when using the classical "Eberwine" T7-Amplification method. When the amplification was conducted for more than 4 hours, the resulting aRNA showed a significantly smaller size distribution on gel electrophoresis and a concomitant reduction of aRNA yield. The degradation of aRNA could be correlated to the presence of the T7 RNA Polymerase in the amplification cocktail. The aRNA degradation resulted in a strong bias in microarray hybridizations with a high coefficient of variation and a significant reduction of signals of certain transcripts, that seem to be susceptible to this RNA degrading activity. The time-dependent degradation of these transcripts was verified by a real-time PCR approach.
Conclusions
It is important to perform amplifications not longer than 4 hours as there is a characteristic 'quality vs. yield' situation for longer amplification times. When conducting microarray hybridizations it is important not to compare results obtained with aRNA from different amplification times.
Keywords: RNA, amplification, bias, T7 Polymerase, microarray
Background
The development of microarray technology has led to a scientific leap in research dealing with the profiling of transcripts on a genome scale [1-4]. During the last years it has evolved to be a powerful technique concerning biological questions involved in the transcriptional state, e.g. oncology [5], development [6] and drug discovery [7]. In a common microarray hybridization, two pools of RNA (e.g. from control and treated cells) are differentially labeled (usually by Cy3- and Cy5-labeled nucleotides) and co-hybridized to a glass slide having either PCR products ("cDNA array") or gene-specific oligonucleotides ("oligo array") covalently attached to its surface. The slide is then scanned with a confocal laser scanner and the signals corresponding to the expression state of the transcripts are quantified by image analysis software.
Standard protocols for microarray hybridization require at least 100–200 ng mRNA or 10–20 μg total RNA, which is equivalent to at least 107 cells or many milligrams of tissue. For obtaining the required amounts of RNA from small tissue samples derived from biopsies or single cell isolations, techniques based either on exponential PCR amplification [8] or isothermal linear RNA polymerase amplification [9] have been developed. The latter is to be preferred as RNA Polymerase activity is less prone to be influenced by template sequence or template concentration. It has also been shown that the correlation coefficient between the RNA amplification method and a non-amplified control is higher (i.e. less bias) than compared to the PCR amplification technique [10].
Since the development of the RNA amplification technique, several optimizations of the amplification and labeling process have been established, especially when the amplified RNA (aRNA) is to be used for gene expression studies involving microarrays. The optimizations include the use of different DNA or aRNA clean-up columns after cDNA or aRNA synthesis [11], varying the primer concentrations [12], or adjusting the template amount and omitting second-round amplifications [13]. Very little attention has yet been focused on the effect of the amplification time on the aRNA quality. This point might seem marginal at first glance, because it is evident that longer amplification times lead to more aRNA and thus more material for hybridizations. However, we have made the observation that prolonged (or even longer "standard") incubation times lead to decreased aRNA quality resulting in high-background, low-reproducible array hybridizations. In the need to clarify the plethora of factors leading to hybridization bias and low-quality hybridization we found the need to address this point as a further 'decreaser of quality' in microarray experiments. Here we report the effect of aRNA synthesis time (amplification time) on the quality and yield of the resulting aRNA and the quality of the subsequent array hybridizations. We could also correlate aRNA degradation to the presence of the RNA polymerase in the amplification mixture.
Results
aRNA size distribution
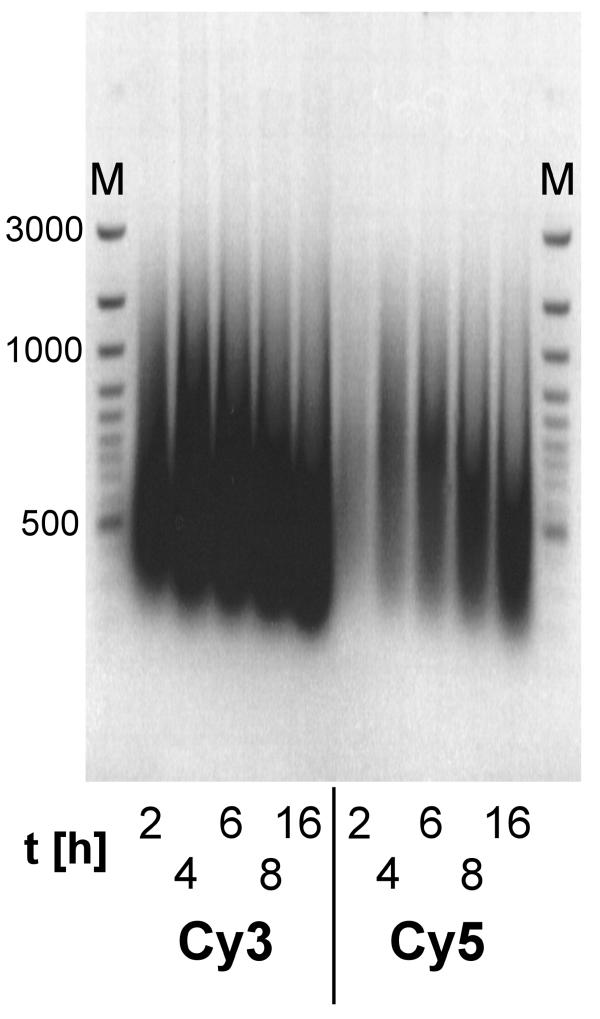
Amplifications were performed from 2 to 16 hours and separated on denaturing agarose gels (Figure 1). The degradation of aRNA characterized by an incubation-time dependent shift of the aRNA on the agarose gel towards smaller fragments can be observed for Cy3- as well as Cy5-labeled aRNA. Densitometric analysis of multiple gel runs (not shown) from independent amplification reactions at exposure times ensuring non-saturating characteristics showed an average aRNA size distribution from 850 ± 70 nt at 2–4 hours to 430 ± 110 nt at 16 hours (n = 3).
Figure 1.
Incubation-time dependent degradation of aRNA. 5 μg of total RNA were amplified and labeled (either with Cy3-UTP or Cy5-UTP) with the T7-System for 2, 4, 6, 8 and 16 hours. The aRNA was separated on a denaturing agarose gel and photographed on a gel-imaging system. Fainter bands in the Cy5-labeled aRNA are due to quenching of Cy5-fluorescence by SybrGreen II and lower yield. M=Molecular weight marker.
aRNA yield
The yield of aRNA in comparison to the quality of aRNA shows a somewhat delayed timecourse (Figure 2). The yield increases almost linearly for the first 6 hours of amplification, but acquires saturation characteristics at 8 hours of amplification. From that point on the yield decreases to 16 h to an amount not more than encountered at 2 hours. This curve progression was found for both Cy3- and Cy5-labeled aRNA as well as for aRNA which was not labeled with a cyanine dye ('no Dye').
Figure 2.
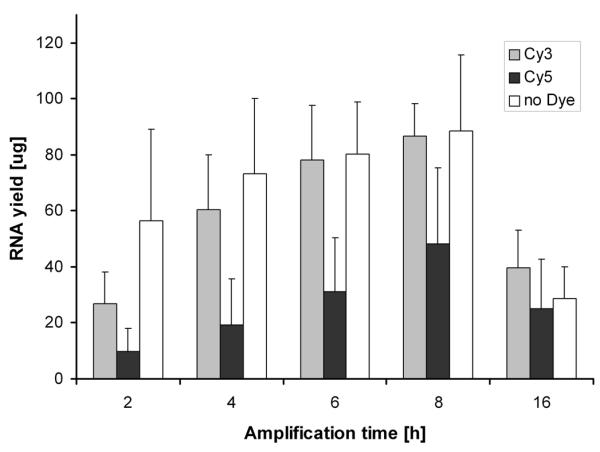
aRNA yield after different incubation times. 5 μg of total RNA were amplified and labeled (either Cy3-UTP or Cy5-UTP) or non-labeled ('no Dye' control) with the T7-System for 2, 4, 6, 8 and 16 hours (n = 3). The aRNA was purified by column chromatography and quantified by UV-spectrophotometry.
RNA degrading factor
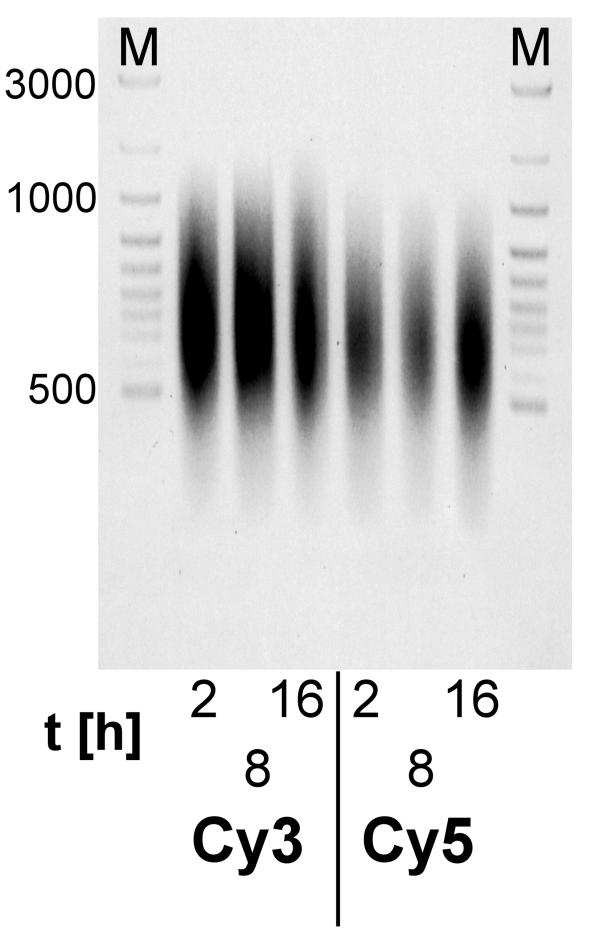
Amplification reactions were conducted with different salt and nucleotide concentrations, and also with T7 RNA Polymerase preparations from other vendors (data not shown). The observations were similar to the ones described above. Only omitting the T7 RNA Polymerase in the amplification reaction resulted in the absence of aRNA degrading activity (Figure 3). For this purpose, purified undegraded Cy3- and Cy5-labeled aRNA was incubated 2, 8 and 16 hours in amplification cocktail lacking the enzyme. No aRNA degradation that would have been characterized by a shift in aRNA size distribution, was observed. The average size of the aRNA (800 nt) is in accordance with the 2 hour time-point in Figure 1.
Figure 3.
Incubation of aRNA in the absence of T7 RNA Polymerase. Cy3- or Cy5-labeled aRNA that had been synthesized by the optimal '4 hour protocol' was incubated under amplification conditions (37°C, amplification buffer) in the absence of T7 RNA Polymerase for 2, 8 and 16 hours. The aRNA was separated on a denaturing agarose gel and photographed on a gel-imaging system. M=Molecular weight marker. The slightly weaker band in Cy5 (8 h) might be due to small loading differences.
Microarray hybridizations
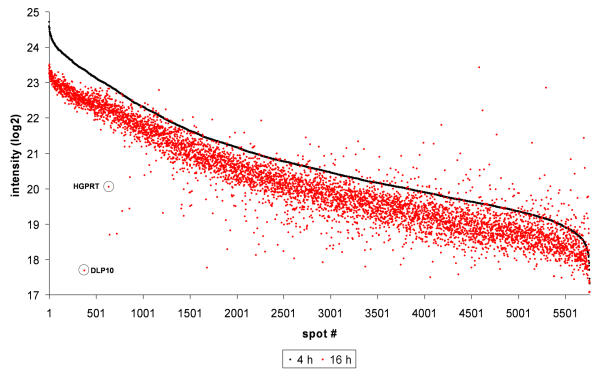
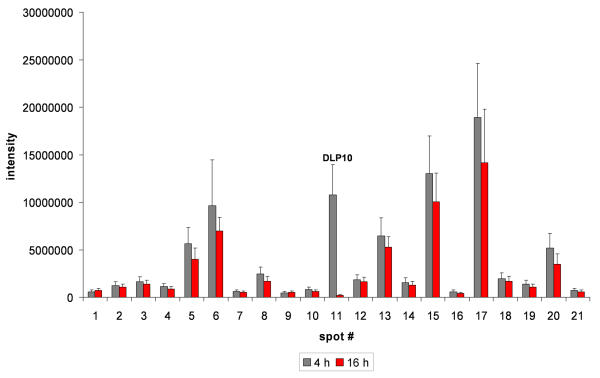
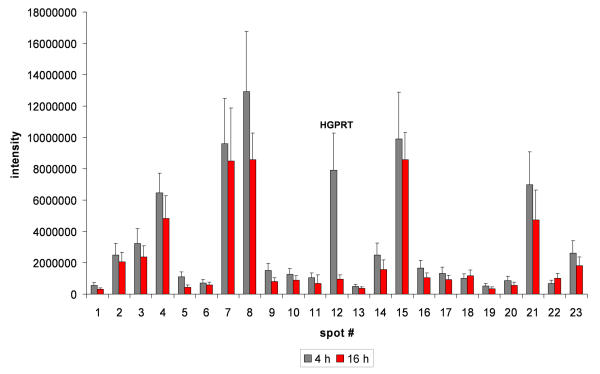
To determine the effect of aRNA quality on the hybridization of microarrays, we conducted hybridizations with Cy3-labeled aRNA obtained from 4 and 16 hours of amplification time. When comparing the signal intensities of all spots from 4 h amplification to 16 h amplification, an overall decrease of signal intensity (37% ± 7%, n = 3, as calculated from the sum of all intensities) was found (Figure 4). Several 'outlier' genes can be identified here, with Dynein-like protein 10 (DLP10) and hypoxanthine guanosine phosphoribosyl transferase (HGPRT) as two examples of transcripts, that seem to be more significantly degraded than the majority of transcripts. A few 'outliers' can also be found in the reverse direction, indicating preferential amplification compared to the majority, but this shall not be discussed here, as this work is dealing with the degradation topic. Due to the decrease in overall signal intensity, less spots were flagged as 'present' by the quantification software (3740 ± 322 at 16 h, compared to 4820 ± 172 at 4 h), but we show here the intensity of all spots. The signal intensities of triplicate experiments show significant decrease in the signal of the two aforementioned transcripts, when comparing 4 h amplification and 16 h amplification (Figures 5 and 6). To eliminate the possibility of some spatial artefact on the slide, the signal intensities of the neighbouring spots are also shown, revealing the signal decreasing trend, but not to the same extend as for the two transcripts.
Figure 4.
Hybridization signals with aRNA from different amplification times. Scatterplot of signal intensities (5760 features) from the hybridization with 4 h and 16 h amplified aRNA. The signals from the 4 h time-point were plotted in order of decreasing intensity (black) with the correspoding genes from the 16 h timepoint (red). The two transcripts (DLP10 and HGPRT) described further are marked in circles.
Figure 5.
Signal intensities from triplicate hybridizations with aRNA from 4 h and 16 h amplification. Shown is DLP10 (spot #11) which undergoes significant signal loss. All other signals are from neighbouring spots to eliminate DLP10 signal decrease due to some spatial property of the slides.
Figure 6.
Signal intensities from triplicate hybridizations with aRNA from 4 h and 16 h amplification. Shown is HGPRT (spot #12) which undergoes significant signal loss. All other signals are from neighbouring spots to eliminate HGPRT signal decrease due to some spatial property of the slides.
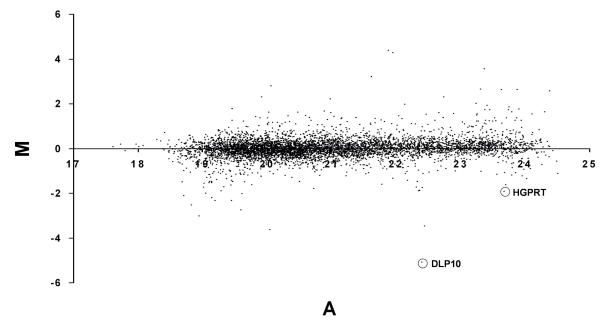
After normalization of signals [22], several genes gave rise to significant signal differences between these two amplification times (Figures 7 and 8). DLP10 and HGPRT with a signal reduction of 47-fold ± 9.9 and 8-fold ± 2.6, respectively, are two examples of genes with a high reproducibility of signal loss. The majority of genes (as exemplified by the ribosomal protein S27a) were however within the range of the normal trend of signal loss (see above). A more extensive list of aRNA transcripts, that are significantly affected by degradation, is shown in Table 1.
Figure 7.
Scatterplot of log-ratios from the hybridization signals of 4 and 16 hour amplified aRNA. Ratios are displayed as a log2-based MA-Plot according to [14] and were transformed by locally weighted regression [22]. Spots in circles are examples of the two transcripts (DLP10 and HGPRT) which undergo strong time-dependent degradation.
Figure 8.
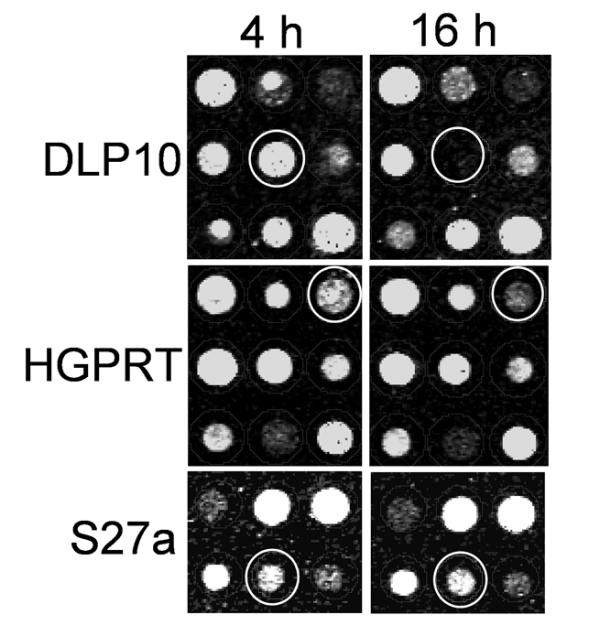
Hybridization images from the microarray features directed against the two transcripts from Fig. 7and the 'unaffected' transcript S27a. Circles indicate the degradation of the two transcripts by decrease of the signal.
Table 1.
Characteristics of the most prominent genes affected by aRNA degradation. Compilation of genes, that are significantly (p < 0.05) subjected to aRNA degradation when 4 hour incubations are compared to 16 hour (n = 3). Table lists the name of the transcripts, descending in the order of the degradation ratio, GenBank accession numbers, transcript size and p-values of the penalized t-statistic as described in [26]. (p. only partial cDNA sequences available at GenBank).
| Transcript name | Ratio | Accession # | length | p-value |
| dynein-like protein 10 | 47 ± 21% | D26502 | 354 p. | 0.0144 |
| integrin beta-1 subunit | 12.5 ± 27% | NM_017022 | 2894 | 0.0234 |
| tcr delta | 11.1 ± 17% | AF259789 | 359 p. | 0.0095 |
| rat hypoxanthine-guanine phosphoribosyltransferase 8.3 ± 32% | S79292 | 853 | 0.0325 | |
| cd44 protein | 8.1 ± 23% | U96138 | 4038 | 0.0172 |
| lyn protein non-receptor kinase | 6.7 ± 21% | NM_030857 | 3438 | 0.0141 |
| cyclic nucleotide phosphodiesterase | 5.1 ± 19% | NM_022710 | 1831 | 0.0188 |
| tuberin-like protein | 5.0 ± 24% | NM_020083 | 4258 | 0.0187 |
| 2'5' oligoadenylate synthetase-2 | 4.8 ± 29% | AF068268 | 2371 | 0.0269 |
| dopamine d2 receptor rgb-2 | 4.3 ± 15% | NM_012547 | 2750 | 0.0074 |
| rolipram-insensitive phosphodiesterase type 7 | 4.2 ± 17% | U77880 | 2870 | 0.0095 |
| mip protein 261 | 4.0 ± 22% | X53052 | 936 p. | 0.0158 |
| rin1 | 3.7 ± 32% | U80076 | 2548 | 0.0325 |
| mitogen activated protein kinase kinase kinase | 3.7 ± 21% | NM_013055 | 3754 | 0.0212 |
| immunoglobulin kappa-chain igkv | 3.4 ± 29% | L07406 | 381 p. | 0.0269 |
| rat heart-derived proto-oncogene | 3.3 ± 17% | NM_012784 | 7902 | 0.0091 |
| rab27b, member ras oncogene family rab27b | 3.2 ± 27% | NM_053459 | 890 | 0.0234 |
| steroid sensitive gene-1 protein | 3.1 ± 31% | NM_022543 | 3719 | 0.0306 |
| matrix metalloproteinase 24 | 3.1 ± 21% | NM_031757 | 4245 | 0.0104 |
| flotillin 2 | 3.0 ± 26% | NM_031830 | 2629 | 0.0218 |
| calcium-independent alpha-latrotoxin receptor | 3.0 ± 25% | NM_022962 | 5579 | 0.0202 |
| neurotrypsin nt | 2.9 ± 28% | AJ311671 | 2499 p. | 0.0252 |
| tenascin | 2.9 ± 22% | U09361 | 1727 p. | 0.0151 |
| rev-erba-alpha protein | 2.9 ± 13% | M25804 | 2297 | 0.0056 |
Real-time PCR
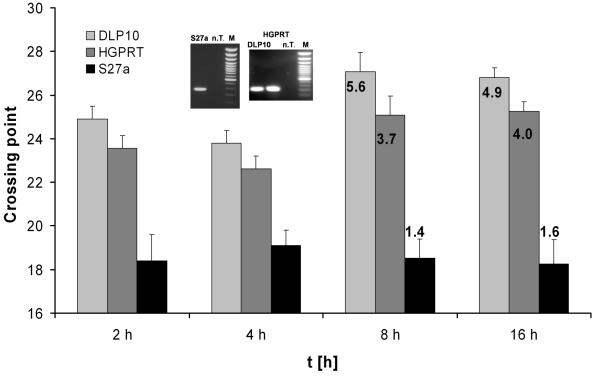
To eliminate the possibility of signal differences by "printing bias", these two transcripts (and S27a as an 'unaffected' gene) were subjected to real-time PCR (Lightcycler™) after having converted the aRNA from the different amplification time-points to cDNA (Figure 9). Although showing different values of the degradation ratio when compared to the array hybridizations, the same trend applies here. The measured crossing points (cycles needed to obtain fluorescence signals significantly above background level) are increased at 8 h and 16 h when compared to 4 h, which means less amplification product (DLP: 5.6 ± 0.9 and 4.9 ± 1.2, respectively; HGPRT: 3.7 ± 0.6 and 4.0 ± 0.5, respectively; n = 3). The real-time PCR approach that was used for the two transcripts shows significant degradation already after 8 h amplification. Control experiments with aRNA from equal time-points (4 h) showed little variation in signal intensity (DLP 10: 1.8 ± 0.3; HGPRT: 1.5 ± 0.6; n = 3). The transcript for the ribosomal protein S27a, which had been shown to have a signal decrease within the normal trend, only shows a slight decrease in degradation, that is not significant (1.6 ± 0.7; n = 3).
Figure 9.
Real-time PCR (Lightcycler™) based evaluation of the incubation time-dependent degradation of the two transcripts from Fig. 7and S27a. aRNA from the different incubation time-points (2 h, 4 h, 8 h and 16 h) was converted to cDNA and equal amounts were subjected to a real-time PCR with gene-specific primers (n = 3). The presence of a single PCR product was confirmed by melting curve analysis (data not shown) and agarose gel electrophoresis (inset; n.T. no template control; M 100 bp DNA marker). Numbers in columns refer to x-fold decrease compared to 4 h, calculated by a method described elsewhere [23].
Discussion
For a correct and reproducible analysis of the transcriptome, the quality of microarray hybridizations is a crucial point. When working with microarrays, the procedure starting from tissue or cells ending by image analysis of the hybridized array comprises so many steps that some degree of intrinsic bias becomes inevitable. Many authors have made efforts to pinpoint the sensitive steps within this technique [10-13], optimizing the labeling, purification and variation of enzymatic and non-enzymatic components.
Many researchers having limited starting material employ the classical T7 RNA Polymerase amplification method developed by Eberwine and coworkers [9], either using their own established protocols or one of the many commercial kits available. By this method it is possible to amplify starting RNA by up to 200-fold. Hybridizations with amplified RNA compared to unamplified result in stronger hybridization signals that meet the criteria of significant 'signal-over-background' and thus more candidate genes will arise [27].
In the present study, we have focused on the effect of amplification time on the quality of the amplified RNA. We routinely observed low-quality, irreproducible hybridization results when our amplification protocol was extended to longer times (>4 h), this negative effect outperforming the increased yields of aRNA.
To clarify this phenomenon, aRNA from different amplification times was subjected to denaturing gel electrophoresis. A clear shift to smaller aRNA fragments was observable when the amplification time was conducted for more than 4 hours (Figure 1). This effect was also irrespective of the type of cyanine dye (Cy3, Cy5) incorporated into the aRNA. Additionally to the aRNA degradation encountered at longer amplification times, there is also a reduction in aRNA yield, but with a somewhat delayed time-course. The interesting point to be made here is, that a degradation of aRNA can be observed even at time-points when there still is de novo-synthesis of aRNA (measured by aRNA yield, Figure 2). A reduction of aRNA yield however is only evident at very late time-points (16 h). This observation might be based on the concomitant synthesis of aRNA and the degradation of already synthesized products to smaller ones, which fail to be separated by column-purification methods but which can still be quantified spectrophotometrically. Another possibility that cannot be ruled out is the additional synthesis of smaller molecular weight transcripts by the reduced halflife of the T7-Polymerase [16]. The degradation and reduction of yield also accounts for aRNA that has not been labeled with a cyanine dye (Figure 2), indicating that it is not induced by some physico-chemical property of the cyanine dyes. Thus experiments using non-labeled aRNA should also be affected by the degradation effect.
A classical "quality vs. yield" situation is encountered here. The degradation of aRNA shown here seems to be the biochemical background for the observation in the original paper from Eberwine and coworkers [9], that amplification reactions conducted longer than 4 hours lead to a decrease of TCA-precipitable RNA (i.e. less yield). A more recent paper also describes an observed reduction of aRNA yield after 5 hours of amplification [11]. The reduced yield as shown here is a result of aRNA degradation and this is a relevant point here to be made, because this might (and does) have an effect on post-amplification procedures such as microarray hybridizations. Less aRNA can be quantified when it is degraded, because the small fragments derived from the degradation are usually lost by column chromatography-based clean-up or precipitation procedures, explaining why a reduction of yield can be measured at longer amplification times. The question that emerges here is the origin of the RNA degrading feature in the amplification reaction.
To clarify this question, amplification reactions were conducted with different salt and nucleotide concentrations, and also with T7 RNA Polymerase preparations from other vendors. The effect was always degraded aRNA as described above (data not shown). Only omitting the T7 RNA Polymerase in the amplification reaction resulted in the absence of aRNA degrading activity (Figure 3), revealing the T7 RNA Polymerase as the aRNA degrading factor. As the aRNA in this experiment resulted from the same cDNA as used for Figure 1, this also indicates that no other component of the cDNA or aRNA synthesis steps are contamminated by RNases.
A contamination of the T7 RNA Polymerase with RNases would seem plausible, yet three arguments contradict this: (i) Commercial T7 RNA preparations are usually highly purified and tested for contamination with RNases. (ii) The use of T7 RNA polymerase from several vendors always resulted in the same observation, but it is unlikely for them all to be contaminated with RNases to a similar degree. (iii) The phenomenon of aRNA degradation is time-dependent and not evident at the beginning of an amplification reaction. These arguments support the presence of an intrinsic nucleolytic activity of the T7 RNA Polymerase, as observed also by Sastry and coworkers [15]. This group revealed a second 3' to 5' exonuclease activity of the T7 RNA Polymerase, which is activated in so-called states of 'roadblock' and which results in the exonucleolytic degradation of RNA in steps of mono- or dinucleotides. This activity can either be induced by the termination of the transcription reaction by reaching the end of the template or by transcription-arresting modifications of the DNA template (i.e. psoralen-crosslink). In the normal elongation phase the polymerase activity of the enzyme has preference over the nuclease activity.
As seen in our experiments, the nucleolytic property of the T7 Polymerase is present even during de novo-synthesis. It therefore does not seem to be induced instantly after depletion of rNTPs, but seems more likely an equilibrium between polymerase and nuclease activity, with the direction of reaction dependent on the concentration of the substrate rNTP. Another additional factor possibly contributing to the prevailing nuclease activity after longer amplification times might also be the inhibition by pyrophosphate which is produced during elongation [17].
To measure the effect of aRNA from different time-points of amplification, DNA chips containg 5760 features were hybridized to Cy3-labeled aRNA from 4 h and 16 h amplifications. The experimental regime of avoiding a co-hybridization on one slide was chosen to eliminate the effect of the differential labeling efficiency of Cy3- and Cy5-labeled nucleotides [24]. Therefore always two slides from the same batch with the same label (Cy3) were used. Several genes reproducibly (n = 3) exhibited a high signal loss (Table 1), when 4 h amplification was compared to 16 h amplification (a length that would be referred as "overnight incubation" in some protocols). Two transcripts were selected as examples for high and moderate signal loss. DLP10 (47 ± 21%), HGPRT (8.3 ± 32%) and S27a as an 'unaffected' transcript were further analysed by a quantitative real-time approach (Lightcycler™) to eliminate the possibility of differential signals as a result of varying amounts of oligonucleotides deposited on the slide during the printing process. The trend of signal loss for these two transcripts could be verified, although with different values (DLP 16 h: 4.9 ± 1.2; HGPRT 16 h: 4.0 ± 0.5; n = 3), which is a known phenomenon when validating microarray hybridizations by real-time PCR [25]. With this more sensitive approach, a significant degradation of transcripts was measured already after 8 h of amplification time. The 'unaffected' transcript S27a showed no significant decrease, thus confirming the values from the microarray hybridization.
Despite the fact of several genes mimicking a "downregulation" by loss of signal intensity, some genes also increased their signal intensity. The explanation for this lies in the decreased overall signal intensity that we observed, when performing hybridizations with aRNA from different amplification times (Figure 4). The overall signal intensity decreases due to the progressive degradation of aRNA, yet some genes seem to be affected more and some less. Additionally, some genes seem to have a significantly better amplification efficiency, leading to more product than the average trend (positive outliers).
Although we think that a transcript-specific susceptibility to the nuclease activity of the T7 RNA Polymerase might be the reason of the degradation trend, this effect needs to be investigated in more detail. There is in vivo evidence, that besides the degradation of mRNA induced by proteins binding to the untranslated regions [18], also nucleolytic cleavage of transripts can occur [19]. It is thus possible that certain transcript properties dampen or enhance the nucleolytic cleavage (degradation) by the T7 Polymerase in vitro. At this time, it is impossible for us to condensate this phenomenon to a certain physico-chemical property of the transcripts. Although we have checked numerous properties (GC/AT-content, local sequence motifs, secondary structure) by bioinformatics, no common feature of these transcripts could be distilled out.
We have shown that amplification-time dependent degradation of aRNA caused by the nucleolytic activity of the T7 RNA Polymerase results in strong signal bias in subsequent microarray hybridizations. The experimental procedure conducted in our experiments uses a different labeling protocol and different origin of RNA, but virtually represents the self-self hybridization recently performed [20]. The difference here is that we observed a much higher coeffcient of variation (27%, n = 3), which is based on aRNA degradation. As we have shown that aRNA quality is dependent on the amplification time, this factor should be taken into account when developing a standard procedure for comparing microarray hybridizations from different experiments. It is strongly recommended not to compare hybridization results with aRNA obtained from different amplification times. In the attempt to standardize the bias-prone technique of microarray hybridization, the international Microarray Gene Expression Data (MGED) Group has developed standards for the Minimal Information About a Microarray Experiment [21]. We should like to recommend, that a detailed description of the amplification times when using amplification techniques should also be considered as standard, since the effect on results is so significant.
Conclusions
aRNA in the classical Eberwine T7 amplification is degraded significantly when incubation times longer than 4 hours are used. The degradation is the result of an intrinsic nucleolytic activity of the T7 Polymerase that is induced after longer incubation periods. Degraded aRNA results in a strong bias in microarray hybridizations, an effect that could mimick "downregulation" and lead to false positives.
Methods
RNA Isolation
RNA was isolated from testis of adult rats. Half a snap-frozen (liquid nitrogen) testis was crushed under liquid nitrogen and homogenized in 5 ml RNApure™ (Peqlab, Germany) with an Ultra-Turrax™. Isolation of total RNA was according to manufacturer's instructions. Total RNA was further purified with RNeasy™ columns (Qiagen, Germany), again according to manufacturer's instructions. The integrity of total RNA was checked by denaturing formaldehyde/MOPS/1% agarose electrophoresis and the purity was checked by UV-spectrophotometry in 10 mM Na2HPO4/NaH2PO4-buffer (pH 7.0). The A260/A280-ratio was >2.0. One pool of purified total RNA was used for all experiments.
T7-Amplification
RNA amplification with T7 RNA Polymerase was carried out according to the manufacturer's protocol (Ambion, Austin, Texas) using the MessageAmp™ kit, with minor modifications. 5 μg total RNA were annealed to 1 μl T7-oligo-dT-primer (total volume 12 μl, 10 min, 70°C), and reverse transcribed in a total volume of 20 μl containing 2 μl 10× first strand buffer, 1 μl ribonuclease inhibitor, 4 μl dNTP Mix and 1 μl reverse transcriptase at 42°C for 2 hr. Second strand synthesis was performed immediately in a total volume of 100 μl containing the complete first-strand reaction, 10 μl 10× second strand buffer, 4 μl dNTP Mix, 2 μl DNA polymerase and 1 μl RNase H at 16°C for 2 hr. The reaction was digested with 1.5 μl RNase A (20 mg/ml) and 1 μl Proteinase K (10 mg/ml) for 30 min at 37°C and subsequently purified over cDNA purification columns (MessageAmp™ kit). The cDNA was concentrated to 3 μl in a vacuum centrifuge and the in-vitro transcription (IVT) was carried out for the indicated incubation times (2 h, 4 h, 6 h, 8 h and 16 h) at 37°C in a reaction mixture (20 μl) containing 2 μl 10× amplification buffer, 2 μl each ATP, CTP, GTP, UTP (75 mM each) and 5 μl Cy3-UTP or Cy5-UTP (5 mM, Amersham Pharmacia Biotech, Sunnyvale, CA). To decrease variability resulting from pipetting errors, a mastermix containing all reagents was split into aliquots for the five different experimental time-points. Template DNA within the aRNA was digested with 2 μl DNase I (10 mg/ml) at 37°C for 30 min, the aRNA purified with spin columns and stored at -80°C.
Integrity of aRNA
The integrity of aRNA was checked by electrophoresis in a buffer-circulating chamber system (OWL Separation Systems, USA). Aliquots (20 μl) of the IVT reaction were denatured for 10 min at 70°C after application of one-fourth volume of 4× RNA Loading Buffer (50% formamide, 10% formaldehyde, 4× MOPS, 0.2% tartrazine as tracking dye) and electrophoresed overnight in a 1.3% agarose/2.2 M formaldehyde/1× MOPS gel containing SybrGreen II (Molecular Probes, Netherlands) at 1.2 V/cm. Gels were photographed on an imaging system (Imago, B&L Systems, Netherlands).
aRNA yield
aRNA yield was measured spectrophotometrically with column-purified (RNeasy™, Qiagen, Germany) aRNA in 10 mM Na2HPO4/NaH2PO4-buffer (pH 7.0) on an Ultrospec 3000 (APBiotech, Germany) as extinction at 260 nm.
Microarray hybridization
Directly before hybridization, Cy3-labeled aRNA was fragmented in a total volume of 60 μl with 12 μl 5× fragmentation Buffer (20 mM Tris/acetate pH 8.1, 50 mM K+-acetate, 15 mM Mg2+-acetate) for 15 min at 94°C and immediately put on ice. The fragmented aRNA (average size 200–300 nt as checked by gel electrophoresis) was purified by spin column chromatography (RNeasy™, Qiagen, Germany) and concentrated to 3–5 μl in a vacuum centrifuge. 40 μl of QMT™ Hybridization Buffer (Quantifoil, Jena, Germany) were applied to the concentrated aRNA. Commercial oligo-based microarray slides (Pan™ Rat 5 K, MWG-Biotech, Germany) were pre-blocked in QMT™ Blocking Solution (Quantifoil, Germany) at 50°C for 4 h. The hybridization mixture was incubated at 90°C for 3 min and immediately put on ice. Hybridization was performed under a glass cover-slip in a standard microarray hybridization chamber (MWG-Biotech, Germany) at 42°C for 16 h. The slides were washed at room temperature for 10 min each in 2× SSC/0.05% NP-40, 1× SSC/0.05% NP-40, 0.2× SSC/0.05% NP-40 and spun (200 g, 2 min) to dryness. Hybridizations were conducted in triplicate with slides from the same production batch to minimize printing bias. The slides were scanned on an Affymetrix 428™ Array Scanner (Affymetrix, Santa Clara, CA) at photomultiplier setting 'gain 60' and analysed with the Phoretix™ Array software (Nonlinear Dynamics, Durham, NC).
The degradation ratio was calculated as  , as deduced from
  and M being
  , as described in [14]. Parentheses indicate s.d. in %.
Statistical significance between these two time-points were calculated by penalized t-statistics according to [26], which uses the 90th percentile of the standard deviations from all spots as an empirical correction factor.
Real-time PCR (Lightcycler™)
2 μg of purified aRNA from the different amplification time-points were converted to cDNA in a total volume of 20 μl containing 500 ng random hexamers (Promega, Madison, WI), 5× first strand buffer (Invitrogen, Carlsbad, CA), 2 μl 0.1 M DTT, 1 μl dNTP Mix (10 mM each, Sigma, Deisenhofen, Germany) and 1 μl Superscript™ II reverse transcriptase (Invitrogen, Carlsbad, CA) for 90 min at 42°C. The first-strand reaction was diluted to 100 μl and 2 μl were used for a subsequent real-time PCR in a Lightcycler™ instrument (Roche, Basel, Switzerland) using a home-made PCR cocktail containing 10 pmol each gene specific primers, 2 μl dNTP mix (25 mM each, Takara Bio, Shiga, Japan), 0.5 μl SybrGreen I (1:1000 in DMSO; Molecular Probes, Leiden, Netherlands), 2.75 mM MgCl2, 2 μl BSA (10 mg/ml; New England Biolabs, Beverly, MA) and 0.2 μl Ex-Taq HS (5 U/μl; Takara Bio, Shiga, Japan) in a total volume of 20 μl. Gene specific primers used were DLP10 sense: caccaaggacctcgccaaag, DLP10 antisense: agctggtggatcagcgcatt (product size 213 bp, position 87–299 of GenBank D26502); HGPRT sense: cgaccggttctgtcatgtcg, HGPRT antisense: gcacacagagggccacaatg (product size 216 bp, position 146–361 of GenBank XM_343829); S27a sense: ccaggataaggaaggaattcctcctg, S27a antisense: ccagcaccacattcatcagaagg (product size 296 bp, position 132–428 of GenBank NM_031113). An initial denaturation was conducted for 3 min at 95°C to activate the enzyme. 30 cycles of amplification were performed with a denaturation at 95°C for 30 s, annealing at primerspecific temperatures (DLP10: 68°C; HGPRT: 65°C; S27a: 60°C) for 10 s, elongation at 72°C for 30 s, followed by a fluorescent data acquisition after 20 s at 80°C. Following the cycling program, a melting curve was performed by cooling to 40°C for 2 min and then increasing the temperature to 95°C with a slope of 0.2°C/s while measuring the fluorescence continuously. The melting peak was obtained by plotting the negative first derivate of fluorescence against temperature. The threshold cycle (crossing point) in which the fluorescence rises significantly above background level was determined by a second derivate maximum method with the use of the LightCycler™ quantification software. Fold-differences were calculated by a mathematical model described by Pfaffl [23]. In addition to the verification of a single PCR product by the presence of only one melting peak, the PCR cocktail was spun out of the glass capillaries (2000 g, 1 min) and resolved by electrophoresis on a 1.3% agarose/TAE gel. Gels were imaged with the Imago System (B&L Systems, Netherlands).
Author's contributions
ANS participated in the design of the study, carried out major experiments, performed the data analysis and wrote the manuscript. NM carried out part of the experiments. RI participated in the design and coordination of the study.
Acknowledgments
Acknowledgments
The authors are grateful to David Resuehr and Dr. James Olcese from the IHF for fruitful discussions. We would also like to thank Prof. Freimut Leidenberger for providing excellent research facilities. This work was generously supported in part by a grant (Iv7/10-1) from the Deutsche Forschungsgemeinschaft as well as by funds from the Innovationsstiftung Hamburg, and from the German Federal Ministry for Education and Research (BMBF, grant No. 01 KX 0113).
Contributor Information
Andrej-Nikolai Spiess, Email: spiess@ihf.de.
Nadine Mueller, Email: nadine.mueller@ihf.de.
Richard Ivell, Email: ivell@ihf.de.
References
- Schena M, Shalon D, Davis RW, Brown PO. Quantitative monitoring of gene expression patterns with a complementary DNA microarray. Science. 1995;270:467–470. doi: 10.1126/science.270.5235.467. [DOI] [PubMed] [Google Scholar]
- Lockhart DJ, Dong H, Byrne MC, Follettie MT, Gallo MV, Chee MS, Mittmann M, Wang C, Kobayashi M, Horton H, Brown EL. Expression monitoring by hybridization to high-density oligonucleotide arrays. Nat Biotechnol. 1996;14:1675–1680. doi: 10.1038/nbt1296-1675. [DOI] [PubMed] [Google Scholar]
- Bowtell DD. Options available – from start to finish – for obtaining expression data by microarray. Nat Genet. 1999;21:25–32. doi: 10.1038/4455. [DOI] [PubMed] [Google Scholar]
- Lockhart DJ, Winzeler EA. Genomics, gene expression and DNA arrays. Nature. 2000;405:827–836. doi: 10.1038/35015701. [DOI] [PubMed] [Google Scholar]
- Bertucci F, Viens P, Hingamp P, Nasser V, Houlgatte R, Birnbaum D. Breast cancer revisited using DNA array-based gene expression profiling. Int J Cancer. 2003;103:565–571. doi: 10.1002/ijc.10867. [DOI] [PubMed] [Google Scholar]
- Hemberger M, Cross JC, Ropers HH, Lehrach H, Fundele R, Himmelbauer H. UniGene cDNA array-based monitoring of transcriptome changes during mouse placental development. Proc Natl Acad Sci USA. 2001;98:13126–13131. doi: 10.1073/pnas.231396598. [DOI] [PMC free article] [PubMed] [Google Scholar]
- Huels C, Muellner S, Meyer HE, Cahill DJ. The impact of protein biochips and microarrays on the drug development process. Drug Discov Today. 2002;7:S119–124. doi: 10.1016/S1359-6446(02)02389-9. [DOI] [PubMed] [Google Scholar]
- Lukyanov K, Diatchenko L, Chenchik A, Nanisetti A, Siebert P, Usman N, Matz M, Lukyanov S. Construction of cDNA libraries from small amounts of total RNA using the suppression PCR effect. Biochem Biophys Res Commun. 1997;230:285–288. doi: 10.1006/bbrc.1996.5948. [DOI] [PubMed] [Google Scholar]
- Van Gelder RN, von Zastrow ME, Yool A, Dement WC, Barchas JD, Eberwine JH. Amplified RNA synthesized from limited quantities of heterogeneous cDNA. Proc Natl Acad Sci USA. 1990;87:1663–1667. doi: 10.1073/pnas.87.5.1663. [DOI] [PMC free article] [PubMed] [Google Scholar]
- Puskas LG, Zvara A, Hackler L, Van Hummelen P. RNA amplification results in reproducible microarray data with slight ratio bias. Biotechniques. 2002;32:1330–1334. doi: 10.2144/02326mt04. [DOI] [PubMed] [Google Scholar]
- Zhao H, Hastie T, Whitfield ML, Borresen-Dale AL, Jeffrey SS. Optimization and evaluation of T7 based RNA linear amplification protocols for cDNA microarray analysis. BMC Genomics. 2002;3:31. doi: 10.1186/1471-2164-3-31. [DOI] [PMC free article] [PubMed] [Google Scholar]
- Baugh LR, Hill AA, Brown EL, Hunter CP. Quantitative analysis of mRNA amplification by in vitro transcription. Nucleic Acids Res. 2001;29:E29. doi: 10.1093/nar/29.5.e29. [DOI] [PMC free article] [PubMed] [Google Scholar]
- Scherer A, Krause A, Walker JR, Sutton SE, Seron D, Raulf F, Cooke MP. Optimized protocol for linear RNA amplification and application to gene expression profiling of human renal biopsies. Biotechniques. 2003;34:546–550. doi: 10.2144/03343rr01. 552–544, 556. [DOI] [PubMed] [Google Scholar]
- Dudoit S, Yang YH, Callow MJ, Speed TP. Statistical methods for identifying genes with differential expression in replicated cDNA microarray experiments. Stat Sin. 2002;12:111–139. [Google Scholar]
- Sastry SS, Ross BM. Nuclease activity of T7 RNA polymerase and the heterogeneity of transcription elongation complexes. J Biol Chem. 2003;272:8644–8652. doi: 10.1074/jbc.272.13.8644. [DOI] [PubMed] [Google Scholar]
- Arnold S, Siemann M, Scharnweber K, Werner M, Baumann S, Reuss M. Kinetic modeling and simulation of in vitro transcription by phage T7 RNA polymerase. Biotechnol Bioeng. 2001;72:548–561. doi: 10.1002/1097-0290(20010305)72:5<548::AID-BIT1019>3.3.CO;2-U. [DOI] [PubMed] [Google Scholar]
- Cunningham PR, Ofengand J. Use of inorganic pyrophosphatase to improve the yield of in vitro transcription reactions catalyzed by T7 RNA polymerase. Biotechniques. 1990;9:713–714. [PubMed] [Google Scholar]
- Mignone F, Gissi C, Liuni S, Pesole G. Untranslated regions of mRNAs. Genome Biol. 2002;3:REVIEWS0004. doi: 10.1186/gb-2002-3-3-reviews0004. [DOI] [PMC free article] [PubMed] [Google Scholar]
- Binder R, Horowitz JA, Basilion JP, Koeller DM, Klausner RD, Harford JB. Evidence that the pathway of transferrin receptor mRNA degradation involves an endonucleolytic cleavage within the 3' UTR and does not involve poly(A) tail shortening. EMBO J. 1994;13:1969–1980. doi: 10.1002/j.1460-2075.1994.tb06466.x. [DOI] [PMC free article] [PubMed] [Google Scholar]
- Yue H, Eastman PS, Wang BB, Minor J, Doctolero MH, Nuttall RL, Stack R, Becker JW, Montgomery JR, Vainer M, Johnston R. An evaluation of the performance of cDNA microarrays for detecting changes in global mRNA expression. Nucleic Acids Res. 2001;29:e41–41. doi: 10.1093/nar/29.8.e41. [DOI] [PMC free article] [PubMed] [Google Scholar]
- Brazma A, Hingamp P, Quackenbush J, Sherlock G, Spellman P, Stoeckert C, Aach J, Ansorge W, Ball CA, Causton HC, Gaasterland T, Glenisson P, Holstege FC, Kim IF, Markowitz V, Matese JC, Parkinson H, Robinson A, Sarkans U, Schulze-Kremer S, Stewart J, Taylor R, Vilo J, Vingron M. Minimum information about a microarray experiment (MIAME)-toward standards for microarray data. Nat Genet. 2001;29:365–371. doi: 10.1038/ng1201-365. [DOI] [PubMed] [Google Scholar]
- Cleveland WS, Devlin SJ. Locally weighted regression: An approach to regression analysis by local fitting. J Am Stat Assoc. 1988;83:596–610. [Google Scholar]
- Pfaffl MW. A new mathematical model for relative quantification in real-time PCR. Nucleic Acids Res. 2001;29:e45. doi: 10.1093/nar/29.9.e45. [DOI] [PMC free article] [PubMed] [Google Scholar]
- Yang IV, Chen E, Hasseman JP, Liang W, Frank BC, Wang S, Sharov V, Saeed AI, White J, Li J, Lee NH, Yeatman TJ, Quackenbush J. Within the fold: assessing differential expression measures and reproducibility in microarray assays. Genome Biology. 2002;3:research0062.1–0062-12. doi: 10.1186/gb-2002-3-11-research0062. [DOI] [PMC free article] [PubMed] [Google Scholar]
- Mutch DM, Berger A, Mansourian R, Rytz A, Roberts M-A. The limit fold change model: A practical approach for selecting differentially expressed genes from microarray data. BMC Bioinformatics. 2002;3:17. doi: 10.1186/1471-2105-3-17. [DOI] [PMC free article] [PubMed] [Google Scholar]
- Efron B, Tibshirani R, Storey JD, Tusher V. Empirical Bayes analysis of a microarray experiment. J Am Stat Soc. 2001;96:1151–1160. doi: 10.1198/016214501753382129. [DOI] [Google Scholar]
- Nygaard V, Loland A, Holden M, Langaas M, Rue H, Liu F, Myklebost O, Fodstad O, Hovig E, Smith-Sorensen B. Effects of mRNA amplification on gene expression ratios in cDNA experiments estimated by analysis of variance. BMC Genomics. 2003;4:11. doi: 10.1186/1471-2164-4-11. [DOI] [PMC free article] [PubMed] [Google Scholar]


