Abstract
While the role of trefoil factors (TFF) in the maintenance of epithelial integrity in the gastrointestinal tract is well known, their involvement in wound healing in the conducting airway is less well understood. We defined the pattern of expression of TFF1, TFF2, and TFF3 in the airways of mice during repair of both severe (300 mg/kg) and moderate (200 mg/kg) naphthalene-induced Clara cell injury. Quantitative real-time PCR for tff messenger RNA expression and immunohistochemistry for protein expression were applied to airway samples obtained by microdissection of airway trees or to fixed lung tissue from mice at 6 and 24 h and 4 and 7 days after exposure to either naphthalene or an oil (vehicle) control. All three TFF were expressed in normal whole lung and airways. TFF2 was the most abundant and was enriched in airways. Injury of the airway epithelium by 300 mg/kg naphthalene caused a significant induction of tff1 gene expression at 24 h, 4 days, and 7 days. In contrast, tff2 was decreased in the high-dose group at 24 h and 4 days but returned to baseline levels by 7 days. tff3 gene expression was not significantly changed at any time point. Protein localization via immunohistochemistry did not directly correlate with the gene expression measurements. TFF1 and TFF2 expression was most intense in the degenerating Clara cells in the injury target zone at 6 and 24 h. Following the acute injury phase, TFF1 and TFF2 were localized to the luminal apices of repairing epithelial cells and to the adjacent mesenchyme in focal regions that correlated with bifurcations and the bronchoalveolar duct junction. The temporal pattern of increases in TFF1, TFF2, and TFF3 indicate a role in cell death as well as proliferation, migration, and differentiation phases of airway epithelial repair.
Keywords: lung, Clara cell, naphthalene, tff1, tff3
The conducting airways of the lung occupy a small percentage of the total lung volume, are an injury target zone for air pollutants, and are a primary interface with the environment. Airway narrowing and branching can result in high local deposition of inhaled toxicants in the conducting airway. The epithelium of the airways is also a target of ingested and circulating toxicants. The primary secretory cell of the conducting airways in rodents, the nonciliated bronchiolar (Clara) cell, is uniquely susceptible to injury by substances that require metabolic activation to produce a toxic effect (naphthalene, 4-ipomeanol, and nitronaphthalene), likely due to the abundant cytochrome P450s found in this cell type. In this study, we use naphthalene to create a well-defined injury pattern in the airways of the mouse (Stripp et al., 1995; Van Winkle et al., 1995). Using this well-defined airway wound healing model, coupled with conducting airway-specific approaches to measure gene expression (Baker et al., 2004), we can assess the role of trefoil factors (TFF) in repair in the injury target zone specifically.
The time course of naphthalene-induced Clara cell injury and repair is defined for the strain of mouse used in this study, Swiss mice (Van Winkle et al., 1995), and consists of defined stages of acute injury and Clara cell loss, cell spreading, proliferation, and regeneration (Van Winkle et al., 1997). Naphthalene injury requires metabolism by cytochrome P450, and in the mouse, this is thought to be due to the CYP2F2 isoform, which is found abundantly in mouse Clara cells (Buckpitt et al., 1992, 1995). Clara cells vacuolate as soon as 6 h after exposure and are dead and sloughed at 24 h. The surviving ciliated cells resorb their cilia and become squamated (Lawson et al., 2002; Van Winkle et al., 1996). Surviving cells undergo a proliferation phase that is maximal 2 days after exposure with proliferation occurring throughout the airway, even in airways where there has been no injury (Van Winkle et al., 1995). These proliferated cells begin their migration at 4 days, followed by differentiation 7 days after exposure with a return to steady state at 14 days. The 6-h, 24-h, 4-day, and 7-day time points were examined in this study for both the 200 and the 300 mg/kg doses. At the higher 300 mg/kg dose, Clara cells are still the target, but the lesion extends proximally from the terminal bronchioles and can involve larger airways, such as the lobar bronchus (Plopper et al., 1992). We used two doses in this study to determine if we will see a larger biological response as measured by increased tff expression when more of the airway tree is involved in the injury.
The TFF family contains three proteins (TFF1, TFF2, and TFF3) that are 7–12 kD and contain highly conserved motifs called trefoil domains (Taupin and Podolsky, 2003). TFF are intimately associated with mucins and mucous-producing cells during injury and repair in the stomach, intestine, and colon (Goke and Podolsky, 1996; Kindon et al., 1995; Tomasetto et al., 2000; Wright, 2001). TFF are also involved with mucosal epithelial restitution after cell loss through effects that are antiapoptotic, that promote cell migration (Hoffmann, 2005; Kinoshita et al., 2000; Oertel et al., 2001), and that enhance cell proliferation and differentiation (Bossenmeyer-Pourie et al., 2002; Ulaganathan et al., 2001). TFF2 is found more abundantly during repair in areas of proliferation and is thought to be important in gastric mucosal differentiation (Karam et al., 2004; Ribieras et al., 1998). Gene expression for tff2 increases in areas of ulceration after acute injury but then returns to control levels shortly after (Wong et al., 2000). TFF3 is increased in the colon after ulceration in the goblet cells at the edges of injury where it acts in a paracrine manner to prevent apoptosis (Taupin et al., 2000) and promote migration of surviving cells for mucosal restitution (Kinoshita et al., 2000; Liu et al., 1997). The distribution of these factors has been very well defined in the epithelium of the gastrointestinal (GI) tract but has not been established in the airway epithelium of the lung.
There is some information available about TFF in lung but much of it is derived from end point quantitative PCR (qPCR) from whole-lung homogenates, which dilute the conducting airway epithelial component. All three TFF have been found in whole lung, but their abundance differs depending on the species. TFF1 is expressed in low amounts in both mouse Clara cells (Hertel et al., 2004) and human airway mucous and ciliated cells (dos Santos Silva et al., 2000). TFF1 expression increases in a mouse allergic lung disease model where it is associated with transdifferentiating Clara cells during mucous metaplasia (Kouznetsova et al., 2007). TFF2 is also induced in allergic lung disease (Nikolaidis et al., 2003, 2006). The cellular location of TFF2 in the normal mouse airway epithelium, which rarely contains mucous cells in steady state, has not been determined, likely due to the lack of a specific antibody. TFF3 has its highest expression in the adult human lung, where it is found primarily in goblet cells of the trachea and bronchi in association with MUC5B and in the submucosal glands in association with MUC5AC (dos Santos Silva et al., 2000; Wiede et al., 1999). TFF3 increases ciliated cell differentiation, and this increase is abrogated by inhibition of the epidermal growth factor receptor (EGFr) (LeSimple et al., 2007). Gene expression in whole-lung samples from C57/Bl6 mice showed no tff3 transcript (Hertel et al., 2004). In the current study, we investigated all three tff on the same samples and endeavored to define both the distribution and the abundance of protein and messenger RNA (mRNA) for TFF in the conducting airways of the mouse.
The goal of the current study was to define the expression of TFF both in normal mouse lung and in the mouse lung exposed to a surrogate toxicant, naphthalene, with the goal of determining if these factors may play a role in conducting airway epithelial wound healing as well as act as markers of epithelial damage. We hypothesized that the expression of all three tff will increase in the airway epithelium during acute injury, squamation, and early proliferation (6 and 24 h), as they do in the gut. During the repair phase, tff1 and tff3 should increase after proliferation has completed and there is migration (4 days) and differentiation of those proliferated cells (7 days) if the role in airways is similar to the GI tract.
METHODS
Reagents.
Naphthalene (NA) was purchased from Aldrich Chemical (Milwaukee, WI). The oleic safflower oil (trans-fat-free oil) was manufactured by and a gift of the Adam’s Specialty Oil Company (Arbuckle, CA). Naphthalene was dissolved in trans-fat-free oil as a 20 mg/ml (250 mg NA in 12.5 ml oil) or a 30 mg/ml (375 mg NA in 12.5 ml oil) solution 1–2 days before use and kept at −20°C until use.
Animals.
Male NIH Swiss mice from Harlan were maintained on a 12-h light/dark cycle with food and water ad libitum for 5 days before use. Mice were housed in cages with high efficiency particulate air-filter tops in American Association for Accreditation of Laboratory Animal Care-approved facilities. Animal use protocols were approved by the University of California, Davis, Institutional Animal Care and Use Committee. The mice were injected at the same time of day, between 8:00 and 10:00 A.M. Mice were given either 200 or 300 mg/kg NA or an equivalent volume per body weight of the oil carrier. Animals were killed at 6 h, 24 h, 4 days, or 7 days after naphthalene or vehicle injection by an overdose of pentobarbital ip (N = 4–8 per group). The trachea was cannulated and lungs were removed from the chest. Lungs for paraffin embedding and sectioning were fixed at 30 cm of pressure with 1% paraformaldehyde through the tracheal cannula, stored in fixative for < 24 h, and embedded in paraffin. For RNA isolation, the lungs were inflated with RNAlater (Ambion, Austin, TX) and stored in RNAlater for a minimum of 24 h (Baker et al., 2004).
Immunohistochemistry.
Care was taken to standardize fixation and processing, so samples from different time points and doses could be compared. Paraffin sections (5 μm) from three mice per treatment group were immunostained. Cross sections of the lung tissue contained three to five terminal bronchioles and one to two larger airways per tissue section per animal, and representative sections were chosen for imaging. Sections from all groups were stained in the same immunochemical run to minimize run-to-run variability and to facilitate cross-group comparisons. A series of dilutions were used to determine optimal antibody concentration. The dilution at which there was moderate positive tissue staining and minimal background staining was chosen. Endogenous peroxidase was blocked with a 10% peroxide solution, and nonspecific binding was blocked with IgG-free bovine serum albumin (Jackson ImmunoResearch Laboratories, West Grove, PA) for 30 min at room temperature. Endogenous biotin was blocked using an Avidin/Biotin blocking kit (Vector Laboratories, Burlingame, CA). TFF1 was detected using a rabbit anti-TFF1 serum (kindly provided by Catherine Tomasetto, PhD) at a dilution of 1:5000 (Kouznetsova et al., 2007). TFF3 was detected using a rabbit anti-TFF3 serum (kindly provided by Daniel Podolsky, MD) at a dilution of 1:5000 (Bergstrom et al., 2008). A biotinylated anti-rabbit antibody cross-absorbed against other species (Jackson ImmunoResearch Laboratories) was used as a secondary, followed by Streptavidin-horseradish peroxidase from the Vectastain Rabbit Kit (Vector Laboratories). The signal was detected with nickel chloride–enhanced 3′,3′-diaminobenzidine tetrahydrochloride. Controls included the substitution of primary antibody with normal sera from rabbits or with PBS and did not have positive staining (see Supplementary fig. 1). Detection of Clara cell secretory protein (CCSP) was accomplished using rabbit anti-CCSP (BioVendor, Candler, NC), and mouse anti-β-tubulin IV (Biogenex, San Ramon, CA) was imaged as previously described using wide band excitation and emission filter sets (Fanucchi et al., 1997), with the exception that the secondary antibodies were bound to different fluorochromes. Secondary antibodies (Invitrogen, Carlsbad, CA) were anti-rabbit IgG with Alexa 568 (red) to detect CCSP and anti-mouse IgG with Alexa 488 (green) to detect β-tubulin IV.
Reverse transcriptase-PCR on microdissected airways.
To enrich the sample for airway-associated gene expression, the airways were microdissected from the surrounding parenchyma after 24 h in RNAlater at 4°C as previously described (Baker et al., 2004). RNA was isolated with Qiagen RNeasy Plus Mini kit (Catalog # 74134; Qiagen, Valencia, CA) using a protocol slightly modified from the manufacturers instructions. Complementary DNA (cDNA) was made using the TaqMan Reverse Transcription Kit reagents (Applied Biosystems, Foster City, CA). One microgram of RNA was added to RT Buffer (final concentration of 1×), MgCl2 (2.5mM), deoxyribonucleotide triphosphates (0.5mM), random hexamers (2.5μM), placental ribonuclease inhibitor (0.4 U/μl), and Multiscribe reverse transcriptase (1.25 U/μl). The reaction was run for four cycles (25°C for 10 min, 48°C for 30 min, and 95°C for 5 min).
Quantitative PCR.
All reagents for the qPCR, except the custom-made primers and probes, were obtained from Applied Biosystems. mRNA expression in dissected airways was measured using cDNA from the previous step and Taqman primers and probes (MWG Biotech, High Point, NA) on the ABI 7500 Fast System. The samples were run in duplicate with glyceraldehyde 3-phosphate dehydrogenase (GAPD) as the internal reference gene. Individual tff1 and tff3 PCRs contained 1X TaqMan Fast Mastermix, 5 μl cDNA, 600 nm 5′ and 3′ primers, and 250 nm probe. The tff2 and foxj1 PCRs contained 1X TaqMan Fast Mastermix, 5 μl cDNA, and the pre-made gene assay, which contained 900 nm 5′ and 3′ primers and 100 nm probe. tff1, tff3, and GAPD primers and the associated probe tagged with TAMRA (5′) and FAM (3′) were made using the Primer Express Software (Applied Biosystems). A TaqMan gene expression assay for tff2 (Mm01348265_m1; Applied Biosystems) and foxj1 (Mm00807215_m1; Applied Biosystems), which contained the primers and probe together, was used to detect the respective mRNA sequences. The tff2 and foxj1 probes were tagged with FAM on the 5′ end and minor groove binder on the 3′ end. tff1, tff3, and GAPD probes were tagged with a 5′ fluorescent tag, TAMRA, and a 3′ FAM quencher. tff1 sequences used were 5′ primer GGGATTCCCGTGGTGCTT, 3′ primer TGGACCTTAGAAGGGACATTCTTC, and probe CCCATGGCCATCGAGAACACTCAAGA. tff3 sequences used were 5′ primer TGTCACATCGGAGCAGTGGTAAC, 3′ primer GCACCAGGGCACATTTGG, and probe ACCGTGGCTGCTGCTTTGACTCCA. GAPD sequences were 5′ primer TGTGTCCGTCGTGGATCTGA, 3′ primer CCTGCTTCACCACCTTCTTGA, and probe CCGCCTGGAGAAACCTGCCAAGTATG. The reaction protocol consisted of 1 cycle at 95°C for 20 s and 40 cycles at 95°C for 3 s, followed by 60°C for 30 s.
Statistics and calculations.
Fold change gene expression in microdissected airways from three to nine animals per time point was calculated using the 2−ΔΔCt method (Livak and Schmittgen, 2001). The tff and foxj1 cycle threshold (Ct) values were normalized to the Ct values of the endogenous reference (GAPD) to get a ΔCt value. These values were then standardized to the time-matched oil controls or to the tff1 airway values (for Fig. 1 only), and data for each time point and tff were analyzed by ANOVA with Fisher’s post hoc test to determine treatment effects. Means with SE of the mean are shown. Data were significant at a p value less than 0.05.
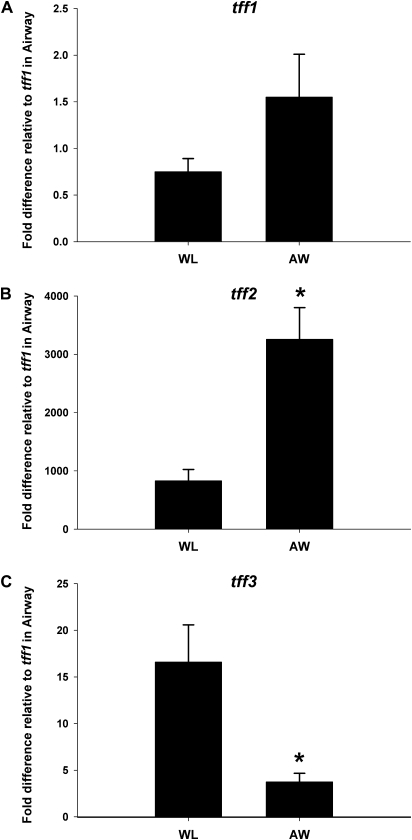
FIG. 1.
Comparison of gene expression for all three tff in airways (AW) versus whole lung (WL) from 24-h oil control mice. (A) tff1 was not differentially expressed in airways compared to whole lung. (B) tff2 was enriched in the airway-specific homogenate threefold. (C) In contrast, tff3 was significantly less abundant in the conducting airways than in a whole-lung homogenate. Results were calculated using the ΔΔCt method. GAPD was the reference gene. For ease of comparison of the different tff with each other, all data are expressed as fold difference from tff1 in the airways. Means and SEs indicate data obtained from eight different animals per end point. *Significantly different from whole lung at p < 0.05.
RESULTS
Comparison of Airway versus Whole-Lung Expression of tff
To facilitate comparison of these data with previous studies, the degree of enrichment or depletion of various tff in whole-lung tissue and microdissected airways from control lung tissue was compared (Fig. 1). tff1 abundance was equivalent in both the whole-lung sample and the airway sample (Fig. 1A), and tff3 was more abundant in the parenchyma as the airway sample had significant depletion compared to whole lung (Fig. 1C). Only tff2 was significantly enriched in the microdissected airway samples (Fig. 1B). In these uninjured tissue samples, the steady-state abundance of tff2 was the greatest of all three tff analyzed. Both tff1 and tff3 were present at much lower levels than tff2. The relative abundance of the tff in airways and whole lung was tff2 > tff3 > tff1.
TFF Expression 6 h after Naphthalene Exposure
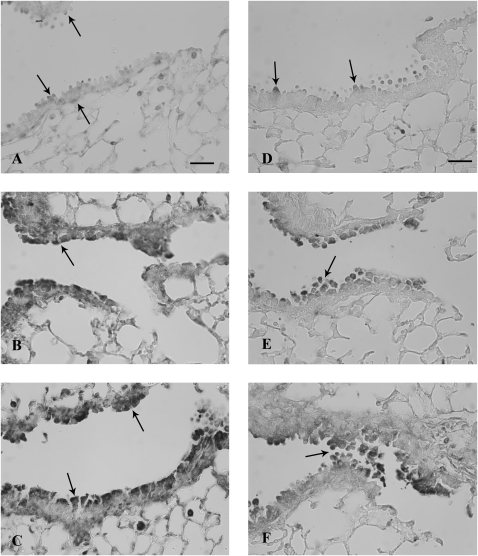
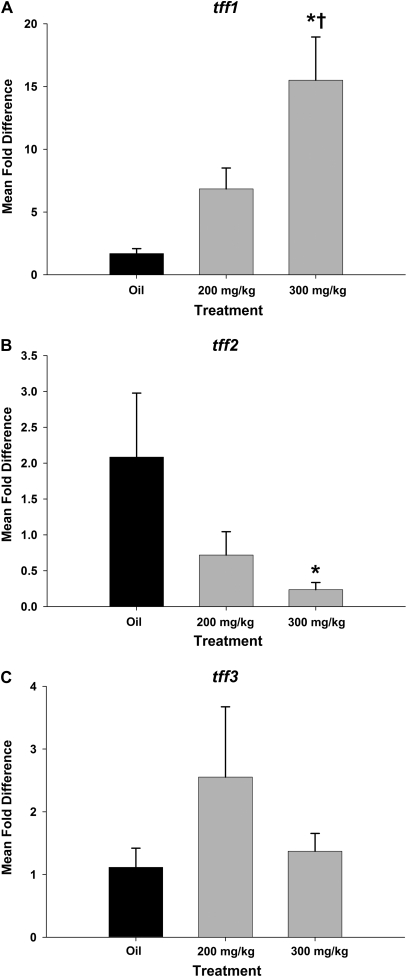
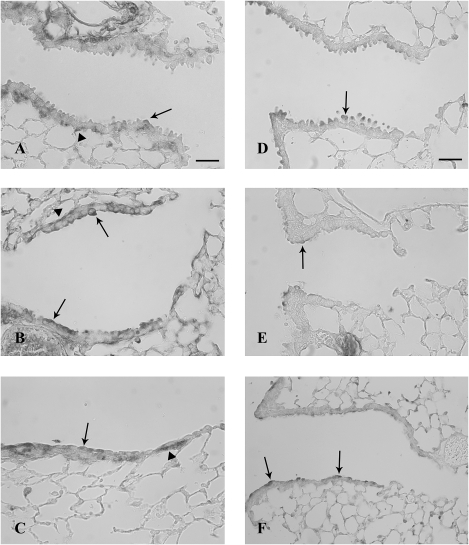
Six hours after systemic naphthalene exposure, Clara cells in the terminal bronchioles were swollen and starting to detach from the basement membrane. This change was similar at both doses of naphthalene; however, the lesion was more extensive at the higher dose, extending proximally from the terminal bronchiole at the 300 mg/kg dose. There were no changes in the terminal bronchioles in the control samples from oil-treated mice. The degenerating Clara cells in the terminal bronchioles had abundant expression of both TFF1 and TFF2 proteins. This signal involved the entire cytoplasm and was often intense (Figs. 2B, 2C, 2E, and 2F). Control animals had minimal to moderate TFF1 and TFF3 expression signals in the terminal bronchioles, which was primarily limited to Clara cells and usually in the apical cytoplasm (Figs. 2A and 2D). Cells consistent in location with peribronchiolar-attenuated fibroblasts expressed TFF1, in both control and exposed animals at all airway levels (Figs. 2A–C). TFF2 protein expression in the tissue was not assessed at any time point due to the lack of an adequate antibody for the mouse. In contrast to the marked increase in focal protein expression at this time point, the mRNA expression from microdissected conducting airways was not significantly different from the oil control animals for all three tff, possibly indicating recruitment of tff protein from other sites (nonairway) for the acute phase of the injury response (Figs. 3A–C). Further the tff expression was not significantly different from other tff at either dose level.
FIG. 2.
TFF protein expression in airways 6 h after systemic naphthalene exposure. Immunohistochemical detection (black staining) of TFF1 (A, B, and C) and TFF3 protein (D, E, and F) in terminal bronchioles. Oil controls (A and D) have light staining on the apex of Clara cells and in the peribronchiolar mesenchyme (arrows). Treatment with either 200 mg/kg naphthalene (B and E) or 300 mg/kg (C and F) increased epithelial staining (arrows) in degenerate Clara cells for both TFF1 and TFF2. TFF3 was also expressed in large round cells in alveoli, consistent with macrophages (C). Three mice were analyzed for each group at this time point (200 and 300 mg/kg naphthalene and time-matched oil control). Bar = 50 μm.
FIG. 3.
tff mRNA expression in airways 6 h after systemic naphthalene exposure. The fold change in tff mRNA expression was calculated by normalizing the raw expression to GAPD (housekeeping gene) and standardizing it to the oil controls. Expression of (A) tff1, (B) tff2, and (C) tff3 was not significantly different from the vehicle (oil) control at 6 h after naphthalene injury at either dose (200 or 300 mg/kg). Results were calculated using the ΔΔCt method. GAPD was the reference gene. Each tff factor is compared to its respective time-matched corn oil control. Means and SEs are from data obtained from a minimum of seven different animals per treatment group.
TFF Expression 24 h after Naphthalene Exposure
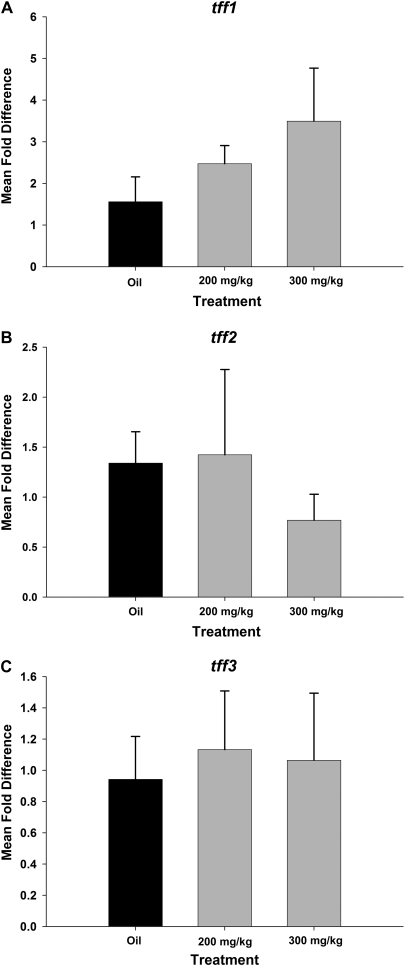
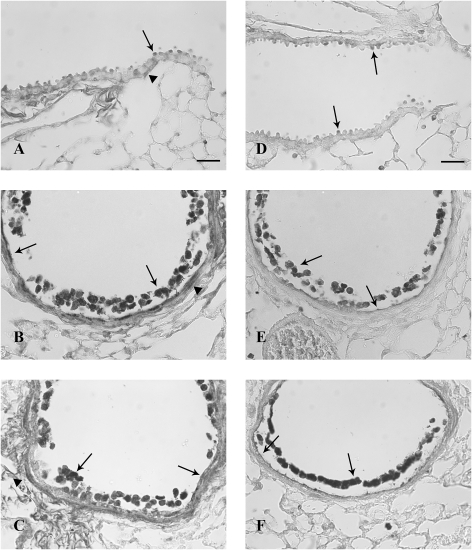
Twenty-four hours after systemic naphthalene exposure, the majority of Clara cells in the terminal bronchioles were sloughed from the basement membrane. The terminal bronchioles were lined with a single layer of squamated cells with little to no associated inflammation. This change was similar in both exposure groups with more extensive proximal airway involvement in the 300 mg/kg group. As with the 6-h time point, exfoliating cells had an intense signal for both TFF1 and TFF3, which was more intense in the sections than the TFF1- and TFF3-positive squamated cells (Figs. 4B, 4C, 4E, and 4F). tff1 expression in the squamated cells often involved the entire cytoplasm and adjacent matrix (Figs. 4B and 4C), while the TFF3 signal was restricted to the apical portion of the squamated cells (Figs. 4E and 4F). Abluminal peribronchiolar cells, possibly attenuated fibroblasts as described by Evans et al. (1993), continued to express TFF1 (Figs. 4A–C). Along with the TFF1 protein expression, the mean fold change in tff1 mRNA expression in pulmonary airways was increased (Fig. 5A). The increase at the 300 mg/kg dose was statistically significant from the oil controls as well as the 200 mg/kg dose level (p < 0.05) (Fig. 5A). In contrast, tff2 gene expression was significantly decreased for the high-dose group (Fig. 5B). tff2 and tff3 mRNA expression in intrapulmonary airways at both exposures was not significantly different from the oil control group (Fig. 5C).
FIG. 4.
TFF protein expression in airways 24 h after systemic naphthalene exposure. Immunohistochemical detection (black staining) of TFF1 (A, B, and C) and TFF3 protein (D, E, and F) in distal bronchioles. Oil controls (A and D) have less intense protein expression than the naphthalene exposed (B, C, E, and F). There does not appear to be a difference in level of expression for TFF1 in degenerate Clara cells in the airway lumen when the two doses (200 mg/kg; B) are compared (300 mg/kg; C). However, there is a dose-dependent difference in the intensity of staining for TFF3 with the 300 mg/kg dose having more intense expression (F) than the 200 mg/kg dose (E). Full arrows indicate expression in normal (A and D), dead, and sloughed Clara cells (B, C, E, and F) and newly squamated cells (B, C, E, and F), while arrowheads show TFF1 expression in the peribronchiolar mesenchyme (A–C). Three mice were analyzed for each group at this time point (200 and 300 mg/kg naphthalene and time-matched oil control). Bar = 50 μm.
FIG. 5.
tff mRNA expression in airways 24 h after systemic naphthalene exposure. tff Fold change in mRNA expression was calculated by normalizing the raw expression to GAPD (housekeeping gene) and standardizing it to the oil controls. tff1 expression (A) was significantly increased only in the 300 mg/kg naphthalene exposure group. In contrast, tff2 (B) expression is significantly decreased at 300 mg/kg. tff3 (C) did not change significantly. *Significantly different from the oil control group, p < 0.05. †Significantly different from 200 mg/kg naphthalene treated, p < 0.05. Results were calculated using the ΔΔCt method. GAPD was the reference gene. Each TFF factor is compared to its respective time-matched corn oil control. Means and SEs are from data obtained from a minimum of six different animals per treatment group.
TFF Expression 4 Days after Naphthalene Exposure
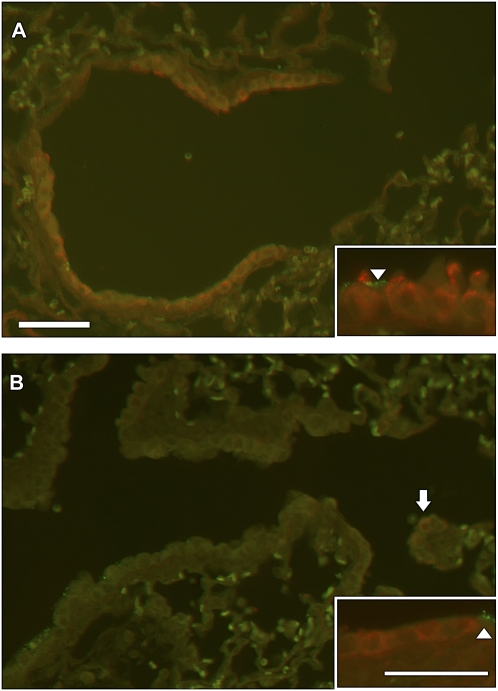
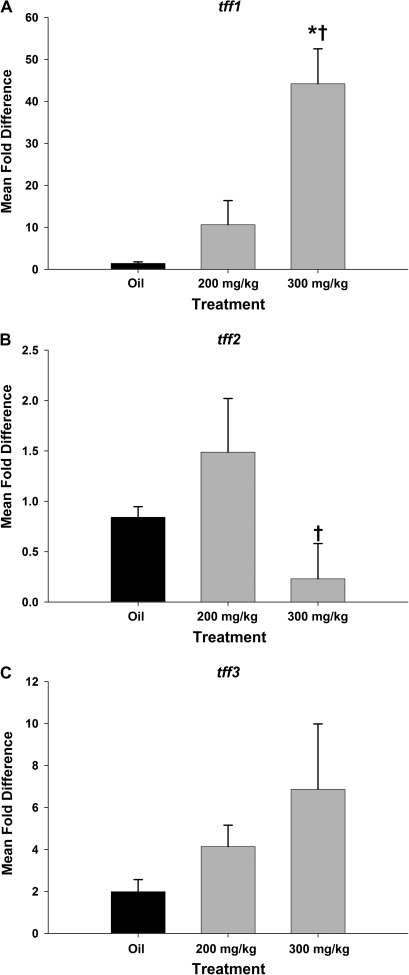
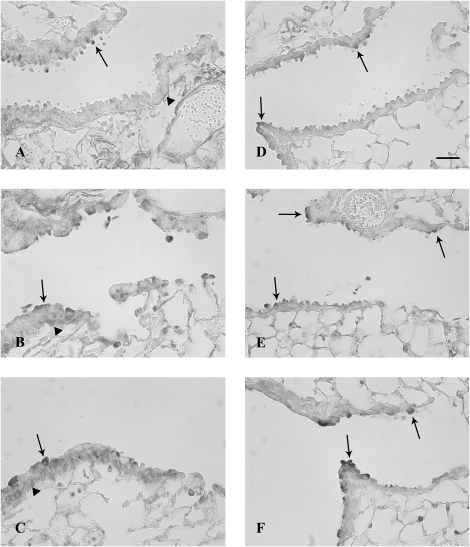
Four days after systemic naphthalene exposure, cells in the terminal bronchioles predominantly were of a low cuboidal morphology for both the 200 and the 300 mg/kg doses. Both TFF1 and TFF3 were expressed in the terminal bronchiolar epithelium of naphthalene-exposed mice (Figs. 6C, 6E, and 6F) at higher levels than oil control mice (Figs. 6A and 6D). In the oil control animals, cells with cytoplasmic expression of TFF1 and TFF3 had the characteristic Clara cell apical protrusions into the airway lumen and peribronchiolar cells again expressed TFF1 in all groups (Figs. 6A–C). In some of these cells, the expression was primarily apical, while the entire cytoplasm of a few cells had a signal for TFF1 and TFF3. tff-positive cells often did not have apical blebs characteristic of differentiated Clara cells. Low cuboidal epithelium that lacks the normal differentiated pattern of expression of Clara cell (CCSP positive) and ciliated cell (β-tubulin IV) markers is common at 4 days following napththalene injury as the epithelium is regenerating and redifferentiating at this time point (Figs. 7A and 7B). The mRNA expression of tff1 increased in both the 200 and the 300 mg/kg exposure levels, and this increase was dose dependent with mean fold changes of 10.6 in the 200 group and 44.2 in the 300 group as compared to oil controls (Fig. 8A). The 200 mg/kg mean increase was not statistically significant due to variability between animals. The 300 mg/kg dose was statistically significant from the oil group and the 200 mg/kg group as well (p < 0.05) (Fig. 8A). There were no significant changes in mean tff2 and tff3 fold changes between exposure groups and oil controls (Figs. 8B and 8C).
FIG. 6.
TFF protein expression in airways 4 days after systemic naphthalene exposure. Immunohistochemical detection (black-gray staining) of TFF1 (A, B, and C) and TFF3 protein (D, E, and F) in terminal bronchioles. Oil controls (A and D) have similar staining to the naphthalene exposed (B, C, E, and F). TFF1 expression was localized to the apex of Clara cells (arrows) and peribronchiolar mesenchyme (arrowheads) in both the 200 mg/kg naphthalene (B) and the 300 mg/kg groups (C). TFF3 was focally expressed in the apex of low cuboidal epithelium most prominently in the 300 mg/kg exposure group (F) and at terminal bronchiole bifurcations in the 200 mg/kg (E) group. Three mice were analyzed for each of the three treatment groups at this time point (200 and 300 mg/kg naphthalene and time-matched oil control). Bar = 50 μm.
FIG. 7.
Cell differentiation in the terminal bronchiole at 4 days after injury from 200 mg/kg naphthalene. CCSP (red staining) for differentiated Clara cells and β-tubulin IV as a marker for cilia (green staining) in the mouse terminal bronchiole of an oil-treated control (A) and a naphthalene injured and repairing airway (B). The control airway contains abundant differentiated Clara cells with characteristic apical domes (inset in A) protruding into the airway and ciliated cells (arrowheads). Terminal bronchiole from the naphthalene-treated animal does not contain abundant CCSP or β-tubulin IV (B). Clara cells that are positive for CCSP (arrow) do not have the domed apical protrusions and are low cuboidal (inset in B). These were found at the terminal bronchiole alveolar duct junction (arrowhead) and in larger more proximal airways including bifurcations. A minimum of three mice were analyzed for each of the treatment groups. Bar = 50 μm.
FIG. 8.
tff mRNA expression in airways 4 days after systemic naphthalene exposure. tff fold change in mRNA expression was calculated by normalizing the raw expression to GAPD (housekeeping gene) and standardizing it to the oil controls. tff1 (A) gene expression significantly increased >40-fold in the group exposed to a single high dose of naphthalene (300 mg/kg) compared to both oil controls and the low-dose group. In contrast, tff2 gene expression (B) was significantly decreased when the high-dose group was compared to the low-dose group. tff3 expression (C) is not changed. *Significant from oil control. †Significantly different from 200 mg/kg naphthalene treated (p < 0.05). Results were calculated using the ΔΔCt method. GAPD was the reference gene. Each tff factor is compared to its respective time-matched corn oil control. Means and SEs are from data obtained from a minimum of six different animals per treatment group.
TFF Expression 7 Days after Naphthalene Exposure
Seven days after systemic naphthalene, cells in the terminal bronchioles were cuboidal and occasionally had a domed appearance. The cells in the 300 mg/kg group had a low cuboidal appearance. The TFF1 expression was similar to that in oil controls (Figs. 9A and 9D) in that the signal was restricted to the apical portion, especially in the 200 mg/kg group. However, there were a few cells in the terminal bronchiole that had TFF1 and TFF2 signals in the entire cytoplasm. This was more prominent in the 300 mg/kg dose groups (Figs. 9B, 9C, 9E, and 9F). Cells at the branch points nearest the terminal bronchiole had a more intense TFF3 signal in both naphthalene dose groups versus the oil controls (Figs. 9E and 9F). The peribronchiolar cells continued to express TFF1 (Figs. 9A–C). There was a statistically significant increase in tff1 mRNA expression in the high-dose naphthalene group from the oil control group (Fig. 10A). However, the fold increase was less than at the previous time point (9-fold vs. a previous high of 40-fold increase over controls). There were no significant differences in fold change tff2 mRNA from oil controls in either exposure group, although the two naphthalene-treated groups were different from each other (Fig. 10B). tff3 mRNA expression was nearly increased significantly in the 200 mg/kg group versus the oil (p = 0.058; Fig. 10B). There was also an increase in tff3 mRNA in the 300 mg/kg group with a mean fold change of 10 (1–25), but this was not statistically significant. Along with the increase of tff3 mRNA at 7 days, there was also an increase in ciliated cell marker foxj1 mRNA expression (Fig. 10D). The foxj1 increases were statistically significant from the oil controls in all four time points and both dose groups at the 6-, 24-h, and 4-day time points (except for the 200 mg/kg group at 4 days) (data not shown).
FIG. 9.
TFF protein expression in airways 7 days after systemic naphthalene exposure. Immunohistochemical detection (black staining) of TFF1 (A, B, and C) and TFF3 protein (D, E, and F) in terminal bronchioles. Oil controls (A and D) have lighter more diffuse staining than the naphthalene exposed (B, C, E, and F). TFF1-positive cuboidal Clara cells (full arrows) and peribronchiolar mesenchymal cells (arrowheads) were lightly stained but well distributed throughout the terminal bronchiole (B and C) in the naphthalene-exposed groups. TFF3-positive Clara cells (arrows) tended to be more intensely stained and to cluster at airway bifurcations and at the bronchoalveolar duct junction. This was more obvious in the 300 mg/kg naphthalene-treated group (F). Three mice were analyzed for each treatment group at this time point (200 and 300 mg/kg naphthalene and time-matched oil control). Bar = 50 μm.
FIG. 10.
tff mRNA expression in airways 7 days after systemic naphthalene exposure. tff fold change in mRNA expression was calculated by normalizing the raw expression to GAPD (housekeeping gene) and standardizing it to the oil controls. tff1 (A) gene expression remained significantly elevated >eightfold in the group exposed to a single high dose of naphthalene (300 mg/kg) compared to both oil controls and the low-dose group. While tff2 (B) gene expression was unchanged compared to oil controls for either treatment group. However, the high-dose naphthalene group (300 mg/kg) was significantly different from the low-dose group (200 mg/kg). tff3 expression was not significantly different from corn oil controls for either treatment group, although the low-dose group just missed significant at p = 0.06. foxj1, the ciliated cell regeneration marker was significantly elevated at this time point in both groups that had received naphthalene treatment. *Significant from oil control. †Significantly different from 200 mg/kg naphthalene treated (p < 0.05). Results were calculated using the ΔΔCt method. GAPD was the reference gene. Each gene is compared to its respective time-matched corn oil control. Means and SEs are from data obtained from a minimum of seven different animals per treatment group for A, B, and C. Means and SEs are from data obtained from three corn oil control animals and four naphthalene-treated animals in D.
Overview of TFF Protein Expression during Naphthalene Injury and Repair
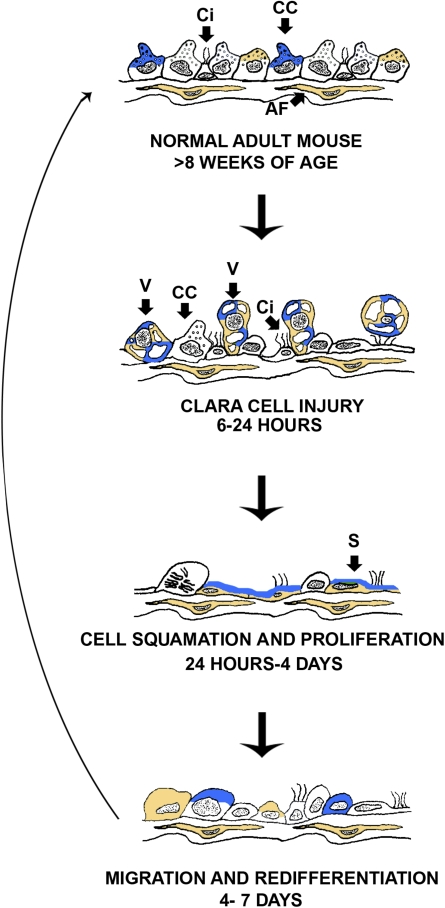
Expressions of TFF1 and TFF3 protein increased at 6 and 24 h after 200 and 300 mg/kg of naphthalene. This protein expression was most evident in the degenerate (6 h) and dead cells (24 h) along with the squamated cells at 24 h (Fig. 10) where TFF1 was punctate and in the entire cytoplasm and TFF3 was in the apical portion of the squamated cells. The TFF1 and TFF3 protein expressions at 4 and 7 days after naphthalene showed slight differences from the oil control animals at the same time points with prominent expression at airway branch points, and the cytoplasmic distribution was primarily apical (Fig. 11).
FIG. 11.
Temporal expression of TFF1 and TFF3 in terminal bronchioles after systemic naphthalene. This is an illustration of the four time points and controls (steady state) examined. TFF1 is represented by the color gold and TFF3 by the color blue. Both TFF1 and TFF3 are expressed in the apical portion of Clara cells when the terminal bronchiole is in the steady state. At 6–24 h (Clara cell injury), swollen vacuolated Clara cells express both TFF1 and TFF3. At 24 h to 4 days (Ciliated cell squamation and cell proliferation), the dead Clara cells as well as the squamated cells express both TFF1 and TFF3. TFF1 is expressed throughout the squamated cell cytoplasm, while TFF3 is just in the apical portion. At 4–7 days (migration and redifferentiation), TFF1 and TFF3 primarily return to the apical portion of the cells with the occasional cell expressing them throughout the cytoplasm. At all time points, attenuated fibroblasts express tff1. CC, Clara cell; Ci, ciliated cell; AF, attenuated fibroblast.
DISCUSSION
This is the first study to document the conducting airway-specific tissue and mRNA expression of all three tff during repair of acute bronchiolar epithelial injury. tff expression in the naphthalene-treated groups was often dose dependent, and greater significance for the gene expression studies was achieved in the high-dose group, likely due to the greater involvement of more proximal airways in the bronchiolar tree than at the low dose. Injury following the 300 mg/kg naphthalene extended to the major daughter bronchioles, while the 200 mg/kg dose affected only distal bronchioles (Plopper et al., 1992). tff1 mRNA expression increased at all time points after naphthalene exposure with the greatest increases during the squamation and cell migration phases (4 days) of repair (Van Winkle et al., 1997). tff3 mRNA increased during the early differentiation phase (7 days), while tff2 was significantly decreased at the end of cell damage and the beginning of the proliferation phase (24 h), possibly correlating with the loss of differentiated Clara cells. As the cells regenerated, the levels of tff2 gene expression approached baseline levels (4–7 days). These results indicate that changes in tff expression, in particular the robust increase in tff1, are good markers of airway epithelial damage and repair. Figure 11 summarizes the expression pattern of TFF protein during the injury and repair process. In summary, all three TFF were found in the airways and whole lung of Swiss mice. All three tff underwent shifts in cellular expression and relative abundance during the injury repair process: TFF1 and TFF3 increased and TFF2 decreased.
Despite a paucity of information of how TFF cause their effects, tff have been implicated as potential modifiers of allergic lung disease and lung function, possibly through interactions with receptors on cells, although none specific to tff have been identified. TFF3 is thought to regulate ciliated cell differentiation via interactions with the EGFr (LeSimple et al., 2007). EGFr has previously been shown to be increased during naphthalene injury and repair (Van Winkle et al., 1997). However, the role of TFF in the epithelium in response to injury by an environmental toxicant has not previously been described. Mouse models of allergic lung disease have found that both TFF1 (Kouznetsova et al., 2007) and TFF2 (Nikolaidis et al., 2003, 2006) are increased. TFF expression is associated with transdifferentiation of Clara cells to mucous cells in these allergic disease models (Hoffmann, 2005, 2007; Kouznetsova et al., 2007) and TFF1 stabilizes mucins by binding to their cysteine-rich von Willebrand factor C domains (Tomasetto et al., 2000). The naphthalene injury/repair model results in an acute injury that repairs over time to return to steady state (Van Winkle et al., 1997). Mucous cells are not present. What our current study shows is that TFF are involved in restitution of epithelial injury even without mucous cells. The large increases (and low relative background levels) of tff1 further indicate that expression of tff1 is an excellent marker of airway epithelial injury from as early as 24 h following exposure out to 7 days. tff2 has been linked to a QTL on chromosome 17 associated with developmental differences in lung function in inbred mouse strains (Ganguly, 2007). Naphthalene injury has been shown to impair lung function 12 h after injection (Yildirim et al., 2008). There is a significant decrease in tff gene expression at the 24-h time point, which might indicate a role for tff2 in lung function impairment caused by naphthalene. Based on these observations, future investigation of the role of TFF2 in lung development as well as normal lung function appears warranted.
tff are central players in mucosal restitution after injury through their effects on cell proliferation and/or apoptosis. The degenerate epithelium in the terminal bronchioles in this study strongly expressed proteins for both TFF1 and TFF3 6 h after naphthalene exposure. However, tff gene expression was not significantly changed for all three tff at this time point. There are several possible explanations for this apparent discrepancy between gene and protein expressions. The increase in local TFF protein may occur post-translationally within the cells, by protein or message stabilization or reduced secretion of the protein, or may be the result of TFF produced at nonairway sites. The latter point is supported by a gradient of TFF1 protein expression between airway vasculature and the airway itself (Fig. 4C). Given the high levels of protein expression in the degenerate Clara cells 6 h after naphthalene, it is also possible that tff gene expression, especially that of tff1 and tff3, was increased before the 6-h time point, the first time point at which the message was assessed in this study. The elevated amounts of TFF protein in degenerate Clara cells may be involved in prevention of anoikis (anchorage-dependent apoptosis). TFF1 has been shown to prevent chemical-induced apoptosis and anoikis by reducing the activities of caspases-3, -6, -8, and -9 (Bossenmeyer-Pourie et al., 2002), whereas TFF3 prevents anoikis by activating nuclear factor kappa-light-chain-enhancer of activated B cells (NF-κB) (Chen et al., 2000). Following naphthalene injury, Clara cells are lost by necrosis, which is characterized by vacuolization and cell swelling (Plopper et al., 1992, 2001; Van Winkle et al., 1995, 1999). Future assessment of the role of TFF1 and TFF3 in suppression of anoikis would need to include earlier time points.
Following injury, the epithelium must proliferate to repopulate the mucosa after Clara cell loss (Stripp et al., 1995; Van Winkle et al., 1995). Twenty-four hours after naphthalene exposure, squamated cells expressed both tff along with TFF1 and TFF3 in the dead cells. However, TFF1 was more extensively expressed in the entire cytoplasm of the squamated cell, whereas tff3 was just in the apical portion. At 24 h after 200 mg/kg naphthalene exposure, surviving cells within the terminal bronchioles are just starting to proliferate, as are more cuboidal cells in the proximal airways (Lawson et al., 2002; Van Winkle et al., 1995). The increased gene and protein expressions of TFF1 and slight increase of TFF3 protein expression in cells that are beginning to proliferate indicates a possible role of these TFF during proliferation. In the GI tract, TFF1 has been shown to have both antiproliferative and antiapoptotic activities, which are paradoxical (Bossenmeyer-Pourie et al., 2002). Human neoplasms have an increased expression of TFF3, which may indicate its proproliferative activity (Leung et al., 2002; Taupin et al., 2001). The dual expression of TFF1 and TFF3 protein in the surviving squamous cells after naphthalene injury may indicate synergism in promoting proliferation of the squamated cells or they could be counterbalancing each other with antiproliferative and proproliferative activities.
Epidermal growth factor (EGF), EGFr, and transforming growth factor alpha (TGF alpha) are abundant in squamated cells 24 h after naphthalene exposure (Van Winkle et al., 1997). TFF interact with TGF alpha, EGF, and EGFr in the gut and in cell culture systems. TFF3 has also been shown to transactivate the EGFr through an unknown mechanism (Taupin et al., 1999). Mice that overexpress TGF alpha in the pancreas have a marked increase in TFF1 gene and protein expressions in pancreatic ducts, whereas wild-type mice had little to no TFF1 (Ebert et al., 1999). A similar TFF1 increase was seen in the gastric mucosa of mice that generally overexpressed TGF alpha after induction of that gene (Goldenring et al., 1996). Early increases in gene expression of tff1 along with TGF alpha and EGF (as shown in study Van Winkle et al., 1997) may indicate that TGF alpha and EGF induce TFF1 expression. The presence of tff1 mRNA and protein expressions immediately following squamation and in early proliferation may indicate an important role for TFF1 during airway epithelial proliferation following cell injury and loss.
Four to 7 days after naphthalene exposure, surviving cells have finished proliferating and are beginning their migration/spreading and early differentiation (Van Winkle et al., 1997). In the terminal bronchioles, the flattened and low cuboidal cells have few markers of differentiated distal airway cells, cilia, or CCSP expression at 2–4 days following naphthalene injury. TFF1 and TFF3 immunoreactive protein was more intense in subpopulations of cells in the terminal bronchioles after naphthalene when compared to oil controls. This was especially notable for cells at airway bifurcations and at the terminal bronchiole alveolar duct junction, two foci of progenitor cells defined in previous studies (Giangreco et al., 2002; Stripp et al., 1995). In this model, these cells are the most differentiated at this time point. Possibly, these tff may regulate the involvement of these key sites in the repair response. tff1 gene expression was very greatly increased in the high-dose naphthalene-exposed group at the 4-day (40-fold) and 7-day time points. TFF1 may either promote migration of cells and/or regulation of differentiation or may be involved in termination of proliferative signals. Given the role that TFF1 plays in the stomach in allowing undifferentiated gastric cells to differentiate to mucous, parietal, or chief cells, TFF1 may have a similar role in the lung.
At 7 days, Clara cells are also redifferentiating, with CCSP and cytochrome P450 starting to be expressed (Van Winkle et al., 1996). The cells in both exposure groups were primarily cuboidal or low cuboidal, and the cells were not fully differentiated Clara or ciliated cells. Like the 4-day time point, those cells that expressed TFF1 and TFF3 in the terminal bronchioles after naphthalene had a more intense signal when compared to oil controls. TFF3 expression was more abundant at branch points near the terminal bronchioles. Interestingly, there is a suggestive increase in tff3 that is mirrored by an increase in expression of foxj1 (which increases with ciliated cell differentiation). tff3 has been shown to be involved in ciliated cell differentiation in tracheal xenografts (LeSimple et al., 2007), and this early increase in mRNA coincides the onset of cellular differentiation in the epithelium at 7 days (Lawson et al., 2002; Van Winkle et al., 1995). TFF3 added to EGF-depleted cell cultures resulted in more ciliated cells, and this increased number of cells was abrogated when EGFr was blocked (LeSimple et al., 2007). Given the robust cell redifferentiation that is taking place in terminal bronchioles at the 7-day time point, which includes regeneration of both Clara cells and ciliated cells, the increase of tff3 mRNA is not surprising.
Attenuated fibroblasts are flat thin fibroblasts with long processes that reside just beneath the basal lamina of the entire airway tree (Evans et al., 1999). These cells communicate with the basement membrane zone, surrounding nerves and airway stroma. This fibroblast population can produce cytokines and chemokines in response to various insults (Evans et al., 1999). Their role after epithelial injury has not been defined. Attenuated fibroblasts have increased cell processes 4 days after naphthalene exposure, but whether this is due to an increase in cell number or just cell processes is not known (Van Winkle et al., 1995). TFF1 expression in peribronchiolar cells with a similar appearance and anatomic location to attenuated fibroblasts was evident at all airway levels, and there was no obvious difference at the different time points and between experimental groups. Confirming evidence would need use high-resolution light microscopy or electron microscopy. Constitutive expression of these factors in the peribronchiolar-associated matrix at all time points of repair may indicate that this area functions as a depot for this growth factor expression.
This study is the first to define the temporal pattern TFF1 and TFF3 mRNA and protein expressions in the mouse during repair of acute airway epithelial injury. tff2 mRNA was also present and was significantly decreased during acute injury. All three growth factors exhibited temporal patterns in expression following injury. Because TFF1 is of relatively low abundance in whole lung and airways in steady state but shows a pronounced increase with airway epithelial damage that persists for some time, this TFF may represent a good biomarker for airway damage following exposure to toxic pollutants. Further studies are needed to determine the function of all three tff in wound healing in the lung as well as their role in lung function and response to other toxic agents. Future work using knockout mice or selective inhibition of the tff could determine if they work together or act as checks for each other during repair of airway epithelium. In summary, TFF1, TFF2, and TFF3 appear to be involved in both the cellular response to acute airway epithelial injury and subsequent repair in the airway epithelium in a species, the mouse, where mucous cells are rare and the primary secretory cell type is the Clara cell.
SUPPLEMENTARY DATA
Supplementary data are available online at http://toxsci.oxfordjournals.org/.
FUNDING
National Institute of Environmental Health Sciences training (ES007055) to M.A.G.; National Institutes of Environmental Health Sciences R01s (ES006700 to C.G.P., ES012720 to L.S.V.); UC Davis was an National Institute of Environmental Health Sciences Center for Environmental Health Sciences and supported core facilities used in imaging tissues for this project (ES005700). Although the research described in the article has been funded in part by the United States Environmental Protection Agency through grant RD-83241401-0 to the University of California, Davis, it has not been subject to the Agency’s required peer and policy review and therefore does not necessarily reflect the views of the Agency and no official endorsement should be inferred.
Supplementary Material
Acknowledgments
We thank Dr Dennis Wilson for critically reading early versions of the manuscript, Aaron Schelegle for assistance with RNA isolation and immunohistochemistry, Tammie Harrington for the histotechnology expertise, Trenton Combs for digital image manipulation, and Jackie Chan for assistance and advice with image capture and immunohistochemistry.
References
- Baker GL, Shultz MA, Fanucchi MV, Morin DM, Buckpitt AR, Plopper CG. Assessing gene expression in lung subcompartments utilizing in situ RNA preservation. Toxicol. Sci. 2004;77:135–141. doi: 10.1093/toxsci/kfh002. [DOI] [PubMed] [Google Scholar]
- Bergstrom KS, Guttman JA, Rumi M, Ma C, Bouzari S, Khan MA, Gibson DL, Vogl AW, Vallance BA. Modulation of intestinal goblet cell function during infection by an attaching and effacing bacterial pathogen. Infect. Immun. 2008;76:796–811. doi: 10.1128/IAI.00093-07. [DOI] [PMC free article] [PubMed] [Google Scholar]
- Bossenmeyer-Pourie C, Kannan R, Ribieras S, Wendling C, Stoll I, Thim L, Tomasetto C, Rio MC. The trefoil factor 1 participates in gastrointestinal cell differentiation by delaying G1-S phase transition and reducing apoptosis. J. Cell Biol. 2002;157:761–770. doi: 10.1083/jcb200108056. [DOI] [PMC free article] [PubMed] [Google Scholar]
- Buckpitt A, Buonarati M, Avey LB, Chang AM, Morin D, Plopper CG. Relationship of cytochrome P450 activity to Clara cell cytotoxicity. II. Comparison of stereoselectivity of naphthalene epoxidation in lung and nasal mucosa of mouse, hamster, rat and rhesus monkey. J. Pharmacol. Exp. Ther. 1992;261:364–372. [PubMed] [Google Scholar]
- Buckpitt A, Chang A, Weir A, Van Winkle L, Duan X, Philpot R, Plopper C. Relationship of cytochrome P450 activity to Clara cell cytotoxicity. IV. Metabolism of naphthalene and naphthalene oxide in microdissected airways from mice, rats and hamsters. Mol. Pharmacol. 1995;47:74–81. [PubMed] [Google Scholar]
- Chen YH, Lu Y, De Plaen IG, Wang LY, Tan XD. Transcription factor NF-kappaB signals antianoikic function of trefoil factor 3 on intestinal epithelial cells. Biochem. Biophys. Res. Commun. 2000;274:576–582. doi: 10.1006/bbrc.2000.3176. [DOI] [PubMed] [Google Scholar]
- dos Santos Silva E, Ulrich M, Doring G, Botzenhart K, Gott P. Trefoil factor family domain peptides in the human respiratory tract. J. Pathol. 2000;190:133–142. doi: 10.1002/(SICI)1096-9896(200002)190:2<133::AID-PATH518>3.0.CO;2-B. [DOI] [PubMed] [Google Scholar]
- Ebert MP, Hoffmann J, Haeckel C, Rutkowski K, Schmid RM, Wagner M, Adler G, Schulz HU, Roessner A, Hoffmann W, et al. Induction of tff1 gene expression in pancreas overexpressing transforming growth factor alpha. Gut. 1999;45:105–111. doi: 10.1136/gut.45.1.105. [DOI] [PMC free article] [PubMed] [Google Scholar]
- Evans MJ, Guha SC, Cox RA, Moller PC. Attenuated fibroblast sheath around the basement membrane zone in the trachea. Am. J. Respir. Cell Mol. Biol. 1993;8:188–192. doi: 10.1165/ajrcmb/8.2.188. [DOI] [PubMed] [Google Scholar]
- Evans MJ, Van Winkle LS, Fanucchi MV, Plopper CG. The attenuated fibroblast sheath of the respiratory tract epithelial-mesenchymal trophic unit. Am. J. Respir. Cell Mol. Biol. 1999;21:655–657. doi: 10.1165/ajrcmb.21.6.3807. [DOI] [PubMed] [Google Scholar]
- Fanucchi MV, Murphy ME, Buckpitt AR, Philpot RM, Plopper CG. Pulmonary cytochrome P450 monooxygenase and Clara cell differentiation in mice. Am. J. Respir. Cell Mol. Biol. 1997;17:302–314. doi: 10.1165/ajrcmb.17.3.2774. [DOI] [PubMed] [Google Scholar]
- Ganguly K, Stoeger T, Wesselkamper SC, Reinhard C, Sartor MA, Medvedovic M, Tomlinson CR, Bolle I, Mason JM, Leikauf GD, Schulz H. Candidate genes controlling pulmonary function in mice: transcript profiling and predicted protein structure. Physiol Genomics. 2007;31:410–421. doi: 10.1152/physiolgenomics.00260.2006. [DOI] [PubMed] [Google Scholar]
- Giangreco A, Reynolds SD, Stripp BR. Terminal bronchioles harbor a unique airway stem cell population that localizes to the bronchoalveolar duct junction. Am. J. Pathol. 2002;161:173–182. doi: 10.1016/S0002-9440(10)64169-7. [DOI] [PMC free article] [PubMed] [Google Scholar]
- Goke M, Podolsky DK. Regulation of the mucosal epithelial barrier. Baillieres Clin. Gastroenterol. 1996;10:393–405. doi: 10.1016/s0950-3528(96)90049-4. [DOI] [PubMed] [Google Scholar]
- Goldenring JR, Poulsom R, Ray GS, Wright N, Meise KS, Coffey RJ., Jr Expression of trefoil peptides in the gastric mucosa of transgenic mice overexpressing transforming growth factor-alpha. Growth Factors. 1996;13:111–119. doi: 10.3109/08977199609034571. [DOI] [PubMed] [Google Scholar]
- Hertel SC, Chwieralski CE, Hinz M, Rio MC, Tomasetto C, Hoffmann W. Profiling trefoil factor family (tff) expression in the mouse: identification of an antisense tff1-related transcript in the kidney and liver. Peptides. 2004;25:755–762. doi: 10.1016/j.peptides.2003.11.021. [DOI] [PubMed] [Google Scholar]
- Hoffmann W. Trefoil factors tff (trefoil factor family) peptide-triggered signals promoting mucosal restitution. Cell. Mol. Life Sci. 2005;62:2932–2938. doi: 10.1007/s00018-005-5481-9. [DOI] [PMC free article] [PubMed] [Google Scholar]
- Hoffmann W. tff (trefoil factor family) peptides and their potential roles for differentiation processes during airway remodeling. Curr. Med. Chem. 2007;14:2716–2719. doi: 10.2174/092986707782023226. [DOI] [PubMed] [Google Scholar]
- Karam SM, Tomasetto C, Rio MC. Trefoil factor 1 is required for the commitment programme of mouse oxyntic epithelial progenitors. Gut. 2004;53:1408–1415. doi: 10.1136/gut.2003.031963. [DOI] [PMC free article] [PubMed] [Google Scholar]
- Kindon H, Pothoulakis C, Thim L, Lynch-Devaney K, Podolsky DK. Trefoil peptide protection of intestinal epithelial barrier function: cooperative interaction with mucin glycoprotein. Gastroenterology. 1995;109:516–523. doi: 10.1016/0016-5085(95)90340-2. [DOI] [PubMed] [Google Scholar]
- Kinoshita K, Taupin DR, Itoh H, Podolsky DK. Distinct pathways of cell migration and antiapoptotic response to epithelial injury: structure-function analysis of human intestinal trefoil factor. Mol. Cell. Biol. 2000;20:4680–4690. doi: 10.1128/mcb.20.13.4680-4690.2000. [DOI] [PMC free article] [PubMed] [Google Scholar]
- Kouznetsova I, Chwieralski CE, Balder R, Hinz M, Braun A, Krug N, Hoffmann W. Induced trefoil factor family 1 expression by trans-differentiating Clara cells in a murine asthma model. Am. J. Respir. Cell Mol. Biol. 2007;36:286–295. doi: 10.1165/rcmb.2006-0008OC. [DOI] [PubMed] [Google Scholar]
- Lawson GW, Van Winkle LS, Toskala E, Senior RM, Parks WC, Plopper CG. Mouse strain modulates the role of the ciliated cell in acute tracheobronchial airway injury-distal airways. Am. J. Pathol. 2002;160:315–327. doi: 10.1016/S0002-9440(10)64375-1. [DOI] [PMC free article] [PubMed] [Google Scholar]
- LeSimple P, van Seuningen I, Buisine MP, Copin MC, Hinz M, Hoffmann W, Hajj R, Brody SL, Coraux C, Puchelle E. Trefoil factor family 3 peptide promotes human airway epithelial ciliated cell differentiation. Am. J. Respir. Cell Mol. Biol. 2007;36:296–303. doi: 10.1165/rcmb.2006-0270OC. [DOI] [PubMed] [Google Scholar]
- Leung WK, Yu J, Chan FK, To KF, Chan MW, Ebert MP, Ng EK, Chung SC, Malfertheiner P, Sung JJ. Expression of trefoil peptides (tff1, tff2, and tff3) in gastric carcinomas, intestinal metaplasia, and non-neoplastic gastric tissues. J. Pathol. 2002;197:582–588. doi: 10.1002/path.1147. [DOI] [PubMed] [Google Scholar]
- Liu D, el-Hariry I, Karayiannakis AJ, Wilding J, Chinery R, Kmiot W, McCrea PD, Gullick WJ, Pignatelli M. Phosphorylation of beta-catenin and epidermal growth factor receptor by intestinal trefoil factor. Lab. Invest. 1997;77:557–563. [PubMed] [Google Scholar]
- Livak KJ, Schmittgen TD. Analysis of relative gene expression data using real-time quantitative PCR and the 2(-Delta Delta C(T)) Method. Methods. 2001;25:402–408. doi: 10.1006/meth.2001.1262. [DOI] [PubMed] [Google Scholar]
- Nikolaidis NM, Wang TC, Hogan SP, Rothenberg ME. Allergen induced tff2 is expressed by mucus-producing airway epithelial cells but is not a major regulator of inflammatory responses in the murine lung. Exp. Lung Res. 2006;32:483–497. doi: 10.1080/01902140601059547. [DOI] [PubMed] [Google Scholar]
- Nikolaidis NM, Zimmermann N, King NE, Mishra A, Pope SM, Finkelman FD, Rothenberg ME. Trefoil factor-2 is an allergen-induced gene regulated by Th2 cytokines and STAT6 in the lung. Am. J. Respir. Cell Mol. Biol. 2003;29:458–464. doi: 10.1165/rcmb.2002-0309OC. [DOI] [PubMed] [Google Scholar]
- Oertel M, Graness A, Thim L, Buhling F, Kalbacher H, Hoffmann W. Trefoil factor family-peptides promote migration of human bronchial epithelial cells: synergistic effect with epidermal growth factor. Am. J. Respir. Cell Mol. Biol. 2001;25:418–424. doi: 10.1165/ajrcmb.25.4.4429. [DOI] [PubMed] [Google Scholar]
- Plopper CG, Suverkropp C, Morin D, Nishio S, Buckpitt A. Relationship of cytochrome P-450 activity to Clara cell cytotoxicity. I. Histopathologic comparison of the respiratory tract of mice, rats and hamsters after parenteral administration of naphthalene. J. Pharmacol. Exp. Ther. 1992;261:353–363. [PubMed] [Google Scholar]
- Plopper CG, Van Winkle LS, Fanucchi M, Malburg S, Nishio S, Chang A, Buckpitt A. Early events in naphthalene-induced acute Clara cell toxicity. II. Comparison of glutathione depletion and histopathology by airway location. Am. J. Respir. Cell Mol. Biol. 2001;24:272–281. doi: 10.1165/ajrcmb.24.3.4247. [DOI] [PubMed] [Google Scholar]
- Ribieras S, Tomasetto C, Rio MC. The pS2/tff1 trefoil factor, from basic research to clinical applications. Biochim. Biophys. Acta. 1998;1378:F61–F77. doi: 10.1016/s0304-419x(98)00016-x. [DOI] [PubMed] [Google Scholar]
- Stripp BR, Maxson K, Mera R, Singh G. Plasticity of airway cell proliferation and gene expression after acute naphthalene injury. Am. J. Physiol. 1995;269(6 Pt 1):L791–L799. doi: 10.1152/ajplung.1995.269.6.L791. [DOI] [PubMed] [Google Scholar]
- Taupin D, Pedersen J, Familari M, Cook G, Yeomans N, Giraud AS. Augmented intestinal trefoil factor (tff3) and loss of pS2 (tff1) expression precedes metaplastic differentiation of gastric epithelium. Lab. Invest. 2001;81:397–408. doi: 10.1038/labinvest.3780247. [DOI] [PubMed] [Google Scholar]
- Taupin D, Podolsky DK. Trefoil factors: initiators of mucosal healing. Nat. Rev. Mol. Cell Biol. 2003;4:721–732. doi: 10.1038/nrm1203. [DOI] [PubMed] [Google Scholar]
- Taupin D, Wu DC, Jeon WK, Devaney K, Wang TC, Podolsky DK. The trefoil gene family are coordinately expressed immediate-early genes: EGF receptor- and MAP kinase-dependent interregulation. J. Clin. Invest. 1999;103:R31–R38. doi: 10.1172/JCI3304. [DOI] [PMC free article] [PubMed] [Google Scholar]
- Taupin DR, Kinoshita K, Podolsky DK. Intestinal trefoil factor confers colonic epithelial resistance to apoptosis. Proc. Natl. Acad. Sci. U.S.A. 2000;97:799–804. doi: 10.1073/pnas.97.2.799. [DOI] [PMC free article] [PubMed] [Google Scholar]
- Tomasetto C, Masson R, Linares JL, Wendling C, Lefebvre O, Chenard MP, Rio MC. pS2/tff1 interacts directly with the VWFC cysteine-rich domains of mucins. Gastroenterology. 2000;118:70–80. doi: 10.1016/s0016-5085(00)70415-x. [DOI] [PubMed] [Google Scholar]
- Ulaganathan M, Familari M, Yeomans ND, Giraud AS, Cook GA. Spatio-temporal expression of trefoil peptide following severe gastric ulceration in the rat implicates it in late-stage repair processes. J. Gastroenterol. Hepatol. 2001;16:506–512. doi: 10.1046/j.1440-1746.2001.02469.x. [DOI] [PubMed] [Google Scholar]
- Van Winkle LS, Buckpitt AR, Nishio SJ, Isaac JM, Plopper CG. Cellular response in naphthalene-induced Clara cell injury and bronchiolar epithelial repair in mice. Am. J. Physiol. 1995;269(6 Pt 1):L800–L818. doi: 10.1152/ajplung.1995.269.6.L800. [DOI] [PubMed] [Google Scholar]
- Van Winkle LS, Isaac JM, Plopper CG. Repair of naphthalene-injured microdissected airways in vitro. Am. J. Respir. Cell Mol. Biol. 1996;15:1–8. doi: 10.1165/ajrcmb.15.1.8679213. [DOI] [PubMed] [Google Scholar]
- Van Winkle LS, Isaac JM, Plopper CG. Distribution of epidermal growth factor receptor and ligands during bronchiolar epithelial repair from naphthalene-induced Clara cell injury in the mouse. Am. J. Pathol. 1997;151:443–459. [PMC free article] [PubMed] [Google Scholar]
- Van Winkle LS, Johnson ZA, Nishio SJ, Brown CD, Plopper CG. Early events in naphthalene-induced acute Clara cell toxicity: comparison of membrane permeability and ultrastructure. Am. J. Respir. Cell Mol. Biol. 1999;21:44–53. doi: 10.1165/ajrcmb.21.1.3630. [DOI] [PubMed] [Google Scholar]
- Wiede A, Jagla W, Welte T, Kohnlein T, Busk H, Hoffmann W. Localization of tff3, a new mucus-associated peptide of the human respiratory tract. Am. J. Respir. Crit. Care Med. 1999;159:1330–1335. doi: 10.1164/ajrccm.159.4.9804149. [DOI] [PubMed] [Google Scholar]
- Wong WM, Playford RJ, Wright NA. Peptide gene expression in gastrointestinal mucosal ulceration: ordered sequence or redundancy? Gut. 2000;46:286–292. doi: 10.1136/gut.46.2.286. [DOI] [PMC free article] [PubMed] [Google Scholar]
- Wright NA. Interaction of trefoil family factors with mucins: clues to their mechanism of action? Gut. 2001;48:293–294. doi: 10.1136/gut.48.3.293. [DOI] [PMC free article] [PubMed] [Google Scholar]
- Yildirim AO, Veith M, Rausch T, Muller B, Kilb P, Van Winkle LS, Fehrenbach H. Keratinocyte growth factor protects against Clara cell injury induced by naphthalene. Eur. Respir. J. 2008;32:694–704. doi: 10.1183/09031936.00155107. [DOI] [PMC free article] [PubMed] [Google Scholar]
Associated Data
This section collects any data citations, data availability statements, or supplementary materials included in this article.


