Abstract
Microglia and astrocytes are transformed into reactive glia (RG) by brain disease and normal function. Eicosanoids and nitric oxide (NO), two intercellular mediators, may influence gliosis. We investigated how drugs that alter production, of these paracrine signals effect induction of glial reactivity from spreading depression. Unilateral (left) neocortical spreading depression was induced in 95 halothane anesthetized rats by intracortical injections of 0.5 M KCl, with or without drug treatment (five animals/group). Immunohistochemical staining (IS) intensity using the OX-42 and anti-glial fibrillary acidic protein (GFAP) antibodies determined reactivity in microglia and astrocytes, respectively. After 3 days, brains were processed for OX-42 and GFAP-IS and mean optical densities (OD) of IS were measured. Average OD’s (for OX-42) and the log ratio (left/right) of OD’s (OX-42 and GFAP) were compared to normal animals. Spreading depression induced significant log ratios for both OX-42- and GFAP-IS (P’s < 0.01). However, dexamethasone (a glucocorticoid), nordihydroguaiaretic acid (a lipoxygenase inhibitor), and nitroprusside (a NO donor) prevented significant left sided and log ratio OD values for microglia (P’s > 0.05). L-Name, a NO synthase inhibitor, caused significant increases in left and right OD’s for microglia (P’s < 0.05). Mepacrine, a phospholipase A2 inhibitor, Indomethacin, a cyclooxygenase inhibitor, and phenylephrine, an adrenergic agonist, did not prevent induction of significant OX-42 log ratios (P’s < 0.01, 0.05, 0.01), and resulted in increases in left side OD’s (P’s < 0.01, 0.05, 0.05). Significant GFAP log ratios occurred after spreading depression in all drug groups, P’s < 0.01. Thus, induction of reactivity in microglia is more sensitive to eicosanoids and NO than in astrocytes.
Indexing terms: cyclooxygenase, lipoxygenase, prostaglandins, leukotrienes, arachidonic acid
Microglia and astrocytes are dynamic cells within the brain that alter their structural and physiologic capacities in response to the functional state of neural tissue. Such changes may directly influence diverse aspects of neural function under normal and pathological conditions (Boje and Arora, 1992; Lees, 1993; Peterson et al., 1994). Typically these alterations in form and function are used to define the transformation of these cells into so-called “reactive” species after injury. For example, with destruction of neural tissue, microglia change from a ramified form to an ameboid shape, proliferate, and alter their expression of several surface markers typically associated with inflammation (Graeber et al., 1988a,b; Morioka and Streit, 1991). Astrocytes, on the other hand, increase their size, expression of glial fibrillary acidic protein (GFAP) and proliferate after irreversible neural injury (Petito et al., 1990). Astrocytes also hypertrophy in association with motor task learning (Anderson et al., 1994). Thus, injury alone may not be an essential prerequisite for reactive glial changes. Indeed spreading depression, a benign perturbation of susceptible neural tissue, transforms microglia (Gehrmann et al., 1993) and astrocytes (Kraig et al., 1991) into reactive cells (microgliosis and astrogliosis, respectively).
The molecular and cellular mechanisms by which microglia and astrocytes become reactive are incompletely defined (Kettenmann and Ransom, 1995). The lack of cell death from spreading depression suggests it may be an ideal means with which to examine tissue-based mechanisms that trigger reactive gliosis (Kraig et al., 1995a). Spreading depression is a propagating wave of electrical silence associated with a large interstitial negative DC potential (Leão, 1944), and consists of many biophysical and biochemical changes similar to those that occur during ischemia (for review, see Bureš et al., 1974; Nicolson and Kraig, 1981). Nonetheless, recurrent spreading depression does not result in any irreversible injury of brain cells (Nedergaard and Hansen, 1988; Kraig et al., 1991).
Microglia and astrocytes are responsive to a host of diverse ionic and chemical mediators (for review, see Graeber et al., 1993; Kettenmann and Ransom, 1995). Mounting evidence suggests changes in eicosanoid and nitric oxide (NO) levels are two important means by which glial structure and function can be changed. Eicosanoids and NO are powerful paracrine and autocrine signals with both synergistic and antagonistic effects (for review, see Needleman et al., 1986; Vincent, 1994; Snyder, 1994). Furthermore, mammalian central nervous system (CNS) tissues produce both eicosanoids (Needleman et al., 1986) and NO (Iadecola et al., 1994; Faraci and Brian, 1994; Vincent, 1994) under basal and stimulated states. Briefly, arachidonic acid is released from membrane phospholipids by phospholipase A2 (PLA2) and other phospholipases, and converted to the various eicosanoids via cyclooxygenases, lipoxygenases, and other enzymes. Nitric oxide is produced from L-arginine by nitric oxide synthases (NOS).
We investigated how modulation of eicosanoid and NO metabolism effects the induction of microgliosis and astrogliosis from a spreading depression stimulus to begin to explore potential mechanisms that trigger reactive gliosis. To alter these pathways we used dexamethasone (Dx), a glucocorticoid previously shown to inhibit CR3 (the OX-42 antigen) expression (Hartnell et al., 1992), mepacrine (Mp) a PLA2 inhibitor, indomethacin (In) a cyclooxygenase inhibitor, nordihydroguaiaretic acid (Ng), a lipoxygenase inhibior, Nω-nitro-l-arginine methyl ester (Ln), a nitric oxide synthase antagonist, phenylephrine hydrochloride (Pe), an adrenergic agonist, or sodium nitroprusside with phenylephrine (Np), a non-enzymatic NO donor. Our results show that the induction of reactivity in microglia (but not astrocytes) is significantly sensitive to various changes in these paracrine/autocrine systems. Lipoxygenase blockade prevented the induction of reactivity in microglia from spreading depression, while PLA2 or nitric oxide synthase blockade, and to a lesser extent cyclooxygenase blockade enhanced the microglial reactivity following spreading depression. We were not able to prevent astrogliosis with any of the drug treatments. These results show that early reactive changes of microglia can be separated from those of astrocytes by modulation of eicosanoid and NO metabolism.
This work has been presented in preliminary form (Caggiano and Kraig, 1995a,b).
MATERIALS AND METHODS
Animal preparation and recording
Animals were prepared as previously described (Kraig et al., 1991; Moskowitz et al., 1993) with minor modifications as described below. Wistar male rats (250–450 gm; Harland Sprague-Dawley, Indianapolis, IN and Charles River, Wilmington, MA) were housed in individual cages maintained on a 12-hour day/night cycle with food and water available ad libitum. Animals (n=95), fasted for 16 hours, were anesthetized via inhalation with halothane (5% induction, 3% during surgical procedures, and 1.0–2.5% during electro-physiological recordings) via a 20% oxygen-nitrogen gas mixture. Animals were maintained at 37 ± 0.5°C while anesthetized and allowed to breathe spontaneously.
Spreading depression was induced as follows: A skin incision was made over the skull from near the right eye to the lateral extent of the left lambdoid skull suture. Two small craniotomies for recording electrodes (1 mm diameter) were drilled 3 mm anterior to bregma and 2 mm to either side of the sagittal sutures. A third craniotomy for KCl micro-injection was drilled at 6 mm caudal to bregma and 4.5 mm lateral to the midline. The dura was left intact at all craniotomies. A tail artery was cannulated for the sampling of arterial blood and monitoring the arterial blood pressure. Before spreading depression induction, animals were transferred to a standard stereotaxic setup.
Spreading depression (n=5) was induced by injection of 0.5 M KCl via a glass micropipette (number 6010 glass; A-M, Corporation, Everett WA) with a tip diameter of 12 μm at 30 p.s.i. for 2–8 seconds every 9 minutes for 3 hours. This group was designated Sd. Sham (Sh) control animals (n=5) received analogous micro-injections of 0.5 M NaCl. Spreading depression (and its absence) was monitored by DC recording electrodes (number 6030 glass; A-M Corporation, Everett WA) broken to tip diameters of 2–8 μm and filled with 150 mM NaCl. All electrodes were lowered 750 μm below the pial surface. Recording electrodes were connected to an Axoprobe A-1 amplifier system (Axon Instruments, Burlingame, CA), filtered at 2 Hz and displayed on a chart recorder. During experiments animals were maintained at 37 ± 0.5°C with a body water jacket and warmed Ringer solution (flowing at 1–3 ml/minute) applied to the exposed skull. Body temperature was monitored with a rectal probe. Ringer solution contained (in mM): Na+ 143.5; K+ 3.0; Ca2+ 1.5; Mg2+ 1.5; Cl− 115; HCO3− 26.4; gluconate 9.6; and glucose 5.0, which when aerated with 95% oxygen and 5% carbon dioxide had a pH of 7.3–7.4 (modified from Bretag, 1969). Arterial carbon dioxide tension (PaCO2), oxygen tension (PaO2) and pH were monitored every 30–60 minutes with a Corning blood gas analyzer (model 238; Ciba Corning Diagnostics, Medfield, MA). Blood glucose was also monitored (Glucometer; Miles Laboratory, Naperville, IL). After 3 hours of spreading depression, electrodes were removed and the head wound closed with wound clips. The tail artery cannula was plugged and covered with a tape bandage. Animals were allowed to recover under the same housing conditions described above.
A second set of animals (n=35 or 5/group) was treated 1 hour before surgery with either Dx, Mp, In, Ng, Ln, Pe, or Np, Dx and Ln were purchased from Merck Sharp and Dohme (West Point, PA) and Mp, Ng, In, Pe, and Np from Sigma (St. Louis, MO). Control animals (n=35 or 5/group) for the drug treatment groups were given the above agents but spreading depression was not induced. In addition, normal animals (Nm; n=5) were included in analyses as controls. A third subset of animals was treated with Ng (n=5) or Ln (n=5) 1 day before and for three days following surgery. Other than the drug treatment regimen, all groups of animals were treated identically.
Drugs were administered as follows. The single dose drug treatments were given one hour before surgery via an intraperitoneal injection. Doses were as follows: Dx, 2 mg/kg; Mp, 10 mg/kg; In, 5 mg/kg; Ng, 10 mg/kg; Ln, 30 mg/kg. Ng was dissolved in 0.01 M NaOH, Mp in water, Ln in PBS, and all other drugs were dissolved in normal saline. Animals treated for 4 days were given daily intraperitoneal injections of either Ng or Ln at the above dosages.
The fact that the predominant action of these drugs at the given dosages is as stated in the Introduction is well documented in the literature. We derived our dosages from previous published studies as follows: for Mp, Torda et al., 1981; for In, Ting, 1990, Chen et al., 1991, and Suzuki et al., 1994; for Ng, Rao et al., 1987, Chen et al., 1991, and Suzuki et al., 1994; for Ln, Iadecola et al., 1994; for Np, Zhang et al., 1994; and for Dx, Kiefer and Kreutzberg, 1991, and Marx, 1995. These references also demonstrate the specificity and efficacy of the drug actions. For example, while In and Ng have certain inhibitory actions on both cyclooxygenase and lipoxygenase, Ting (1990) showed that In at the dosages used in the present experiment decreases production of cyclooxygenase products while increasing production of lipoxygenase products. Similarly, Suzuki (1994) demonstrated that PGE2 production was significantly decreased by 5 mg/kg In, but increased with 5 mg/kg Ng. Studies conclusively show that Mp inhibits PLA2 (Flowers and Blackwell, 1976) in several systems, including brain (Samochocki and Strosznajder, 1989). Also, while Dx has been shown to have some PLA2 inhibitory action, its immune suppressive effects (for example complement receptor suppression) appear to act via transcriptional activation and inhibition (Marx, 1995; Scheinman et al., 1995; Auphan, et al., 1995). Furthermore, the anti-inflammatory action of Dx has been shown to act in a manner separate from PLA2 inhibition (Supko and Johnston, 1994). The efficacy of Ln and Np are documented in Iadecola et al. (1994) and Zhang et al. (1994), respectively. Thus while these drugs may have many actions, their application in these experimental methods is appropriate for the desired effects.
Pe and Np were delivered according to the methods described by Zhang et al. (1994). The left external carotid artery was cannulated with a catheter directed toward the carotid bifurcation. The left femoral artery was also cannulated. A subcutaneous injection (0.1 ml) of a long-acting local anesthetic (Bupivacaine; Abbott, Chicago, IL) was administered at the incision for each catheter site. Wounds were closed with stainless steel wound clips. Np was administered (3 mg/kg/hour) via the carotid cannula at a rate of 0.51 ml/hour. As arterial blood pressure fell from this NO donor administration, Pe (0.04%) infusion was given via the femoral cannula to maintain normal pressure. Pe infusion was recurrently adjusted (0.25–0.51 ml/hour) to keep arterial blood pressure in a normal range. Ten minutes after infusions began, recurrent spreading depression was started. After 3 hours all cannulae were plugged, and animals were allowed to recover as described above. Sham-control animals here (n=5) consisted of infusion of Pe alone without spreading depression. Normal saline (0.51 ml/hr for 3 hours) was infused through the carotid cannula.
Immunohistochemistry
Immunohistochemical staining (IS) followed procedures of Breder et al. (1995) with modifications described below. Three days following spreading depression, animals were transiently anesthetized with halothane and then deeply anesthetized with pentobarbital (50 mg/kg i.p.). Anesthetized animals were given an intracardiac injection of heparin (100 units in 0.1 ml) via an opened thorax and killed by transcardial perfusion with 200–300 ml normal saline followed by 500 ml fixative [2% paraformaldehyde, 0.075 M lysine-HCl, 0.010 M sodium periodate, in 37 mM phosphate buffer (PB), pH 6.2]. Brains were removed and postfixed in the same fixative for 2 hours at 4°C. Brains were then transferred to 10% sucrose in PB for 2 hours and finally into 20% sucrose in PB for 48 hours. Each brain was blocked and frozen in isopentane at −35°C and stored at −80°C until sectioned for use.
OX-42
Forty micrometer coronal sections were cut from blocks extending rostrally from the chiasm with a cryostat microtome (model number 855; Reichert-Jung, Cambridge Instruments, Heildelberg, Germany), incubated in PBS containing 0.3% H2O2 and 0.25% Triton X-100 (Sigma, St. Louis, MO) for 30 minutes, rinsed in PBS, and then incubated for 1 hour in a blocking solution containing 3% normal goat serum (Colorado Serum Co., Denver, CO), 0.25% Triton X-100 and 0.001% sodium azide in PBS (PGT + Azide) at room temperature (RT) with gentle agitation. Tissue was then incubated for 18–20 hours in the primary antibody (M.C. OX-42; Cerotic, Oxford, England) solution (1:20,000 dilution in PGT + Azide) at 4°C with gentle agitation.
GFAP
Tissue was treated as for OX-42-IS with the following important exception. Cut sections were collected from the cryostat knife and floated on the surface of PBS + Azide for 20–30 minutes, letting the surface tension flatten each section. Sections were then similarly placed on the surface of 4% paraformaldehyde in 0.1 M PB for 20 minutes. This procedure reduced or eliminated curling of sections that otherwise occurred from sectioning of tissue perfused with lysine-periodate-based fixative. It was our impression that excessive section curling caused GFAP-IS to be mottled. Such mottling did not occur with use of the above floating maneuver.
GFAP-IS followed the procedures outlined above for OX-42-IS. The anti-GFAP antibody (number 814–369; Boehringer Mannheim, Indianapolis, IN) was used at a dilution of 1:150 in PGT + Azide.
It should be noted that we used the lysine periodate-based fixative because it substantially improved the quality of OX-42-IS compared with sections processed from fresh frozen brains or brains fixed in either ethanol or 4% paraformaldehyde in PB. Lysine periodate-based fixation also allowed primary antibody concentrations that were 2 orders of magnitude more dilute than required with other fixation methods. Staining quality was empirically assessed by the intensity, detail, and regional distribution of OX-42 marking. Curling did not influence the distribution of OX-42-IS in either control or experimental brain sections. We present evidence below to show that OX-42-IS by our method is so reproducible that comparisons between sections stained at different times can be accurately made without normalization via within section control staining densities.
Antibody detection
Sections were incubated in a peroxidase labeled anti-mouse (1:50 in PGT) IgG antibody (Bio-source International, Cameriool, CA) at RT for 1 hour with gentle agitation. The peroxidase label was visualized by incubating the tissue in PBS containing 0.05% diaminobenzidine dihydrochloride (DAB; Sigma, St. Louis, MO) and 0.01% H2O2 for 7.5 minutes at RT with agitation. Tissue was rinsed and mounted on gelatin-coated slides.
The peroxidase reaction is well suited for semi-quantitative analyses. The horse-radish peroxidase reaction has been used successfully in many enzyme immuno-assay systems, where direct quantitation can be made using standards. Furthermore, the ability to make semi-quantitative analyses from histological tissue specimens has been demonstrated using an image analysis system with an identical sensitivity range to our own (Fujita, 1983; Agnati and Fuxe, 1984). As detailed in Reis et al. (1982), the dilutions of the primary and secondary antibody, as well as the DAB incubation time, were optimized for reproducibility of densitometry measurements.
Stained sections air dried on slides, were dehydrated in increasing ethanol concentrations (50%, 70%, 95%, 95%, 100%, and 100%; 2 minutes each) and cleared overnight in xylenes. Slides were then re-hydrated and transferred into distilled water in preparation for silver intensification of IS as described by Breder et al. (1992). Slides were cover slipped with DPX mountant (Poole, England).
Computer-based image analysis
Computer-based image analysis software, Image Pro Plus’ (version 1.2; Media Cybernetics, Silver Springs, MD) was used to quantitate IS. Whole brain sections were trans-illuminated through a 540/40 nm bandpass filter (Chroma Technology Corp., Brattleboro, VT) using an Intralux 4000 fiber-optic flat light source (Volpi MFG, Co., Auburn, NY). Electronic images (1,024 × 1,024 pixels) were acquired using a 200 mm zoom lens attached to a 12-bit cooled, charge coupled camera (CH250; Photometrics, Tucson, AZ). The camera was run under a Windows’ (3.1) environment on a 486 AST’ computer (AST Research, Inc., Irvine, CA) using PMIS’ software (version 3.0; Photometrics, Inc., Tucson, AZ). Images were stored on a Pinnacle Micro optical drive (Sierra 1.3GB; Pinnacle Micro, Inc. Irvine, CA). Electrical power for the light source and all related electronics was stabilized with mini uninterruptible power systems (MUPSA-1000; Philtek Power Corp., Blaine, WA).
Before capturing images, five bias images were taken to remove residual charge from the camera sensor. Next, a sharp focus of an image was obtained. Then, camera sensor gain was calibrated by adjusting the exposure time so that the mean intensity acquired from the filtered light source (no image present) was a constant value (exposure times were 320–410 msec). For each animal, a dark field current (Id; same exposure time with a closed shutter), a reference image (Ir; blank slide with DPX and coverslip) and five brain section images (Io) were acquired and stored.
Optical density (OD) values were determined from electronic images as follows (personal communication from Mr. Christian Stone, Media Cybernetic, Silver Springs, MD): The dark field current was subtracted from the brain section (Io − Id) and from the reference image (Ir − Id). A corrected image (Ic) was then generated by reference correction of the experimental image according to
where M equals the mean pixel value of the corrected reference image. Areas of interest were drawn around each neocortical hemisphere and the mean OD of each area recorded (e.g., left experimental and right control cortices). The intensity scale (0–4,096) for OD measurements was set to a constant dark and light limit range (e.g., 1,500–3,000) that bracketed light intensity values from all brain sections. In this way, the range of OD measurements was narrowed to that of the experimental data to optimize signal-to-noise values. To test the reproducibility of the entire imaging process, a single set of images was analyzed five times. Each analysis was begun from a cold start. This included turning on all electronics, including the camera, and allowing the camera to reach its optimum operating temperature of less than −40°C. The maximum variability between any two of the trials was 0.004%.
Data analysis
OD values for OX-42-IS (or GFAF-IS) were determined from five left and five right hemi-neocortical sections averaged for each animal. Measurements were made with the operator blinded to experimental conditions. Microglial and astrocytic reactivity from each experimental and control group is reported in two ways. First, the log ratio of the OD of OX-42 and GFAP staining of the experimental (left) neocortex to the OD of the control (right) neocortex was used as a measure of reactivity of microglia and astrocytes, respectively (Kraig et al., 1991). In this way, equal left and right staining would result in a log ratio of zero, while increased IS of the left, experimental neocortex compared with the contralateral, right control neocortex would result in a log ratio greater than zero. However, since the log ratio of OD is sensitive to changes in both the experimental and control neocortices, the actual OD’s of the left and right neocortices were also compared between groups for OX-42-IS.
This second method of comparison became necessary when pretreatment of some animals clearly increased immunohistochemical staining intensity in both left, experimental and right, control neocortices. Meaningful comparisons of individual (e.g., left or right) neocortices could be made between experimental groups and normal controls without normalization. This was due to the highly reproducible staining with the OX-42 antibody (by using lysine periodate-based fixative) and the reproducibility of the image analysis system. The latter it should be noted, requires that the camera has been precalibrated as described above (personal communication from G.J. Caggiano). To insure equal processing between groups, tissues from animals from different groups were processed together and tissues from animals within a single group were not all processed simultaneously.
As we were interested in preventing the induction of gliosis above a normal resting state, each experimental group was compared with the normal group (Nm) by using the Dunnett test for multiple comparisons to insure that the chances of encountering a type one error were not increased due to multiple groupings. Drug groups were not compared with the Sd group as significant reductions could be encountered in the presence of significant elevations above normal. As we were interested in maintaining the glial reactivity at a normal resting state, we believe this is the most appropriate comparison. Furthermore, due to the inherent variability of whole animal studies and the multi- factorial nature of spreading depression, it is unlikely that significant differences from the Sd group could be shown without the use of extremely large animal numbers. However, demonstrating that a drug induced enough variability and prevented significant elevations above normal at the same power level (i.e., animal numbers) logically demonstrates that this drug inhibits the induction of that state. Also, we analysed the data in two ways. The OD values demonstrate any large changes and are an accurate representation of intensities actually encountered, while the log ratio of left and right OD values is a powerful technique that uses within animal comparisons. Failure to show significant elevation above normal with both of these techniques, clearly demonstrates that these groups are close to a normal state.
The arterial blood pressure, temperature, PaCO2, PaO2, pH, blood glucose, and number of spreading depressions for each animal group were analyzed in the same manner. Statistics were calculated by using Systat’ software (version 5; Systat, Inc., Evanston, II) and histograms made by using Sigma Plot’ software (version 2.0; Jandel Scientific, San Rafael, CA). Means and standard errors are shown in all histograms.
Illustrations of IS were prepared from electronic images in concert with recent discussions (Anderson, 1994). Specifically, images (1,024 × 1,024 pixels) were captured with exposure optimized so that intensity values extended over the widest range of a 12-bit (e.g., 0–4,096) scale using PMIS’ software. A reference image was also captured and stored. The latter consisted of a blank image derived from light passing through a microscope slide, mountant, and coverslip under the precise lighting and exposure conditions as for the associated experimental image. All images were photographed through a 540/40 nm bandpass filter. This reduced visualization of out-of-focus staining. Then, images were processed using Image Pro Plus’ software. First, the reference image was subtracted from the experimental image to balance image lighting. Then images were sharpened using a sharpening filter (5 × 5 pixel matrix at 50% strength and two passes). Final images were printed using a dye sublimation printer (XLT-7720; Eastman Kodak, Rochester, NY). Low-power images (e.g., 2A, 4, 7A, and 9) were superimposed on a white background to accentuate image contrast.
RESULTS
Spreading depressions were elicited in the left neocortices of experimental animals. Contralateral neocortices served as intra-animal controls where spreading depression was never seen. DC potentials recorded in frontal neocortices confirmed the occurrence of spreading depression. An example of spreading depression is shown in Figure 1. This example is from an animal of the Dx group. The upper record of each pair is from the experimental (left) neocortex, and the lower record is from the control (right) neocortex. Each single drug treatment group averaged between 15 and 22 spreading depressions (see Table 1). None of the experimental single dose drug group spreading depression frequencies were significantly different (P’s > 0.05) according to ANOVA and post-hoc Tukey analysis (see Table 1). The sham-operated group experienced no spreading depressions. The four-day Ng and Ln drug treatment groups experienced an average of 19 and 10 spreading depressions, respectively. The 10 spreading depressions of the Ln group is significantly different (P < 0.05) from the other groups.
Fig. 1.
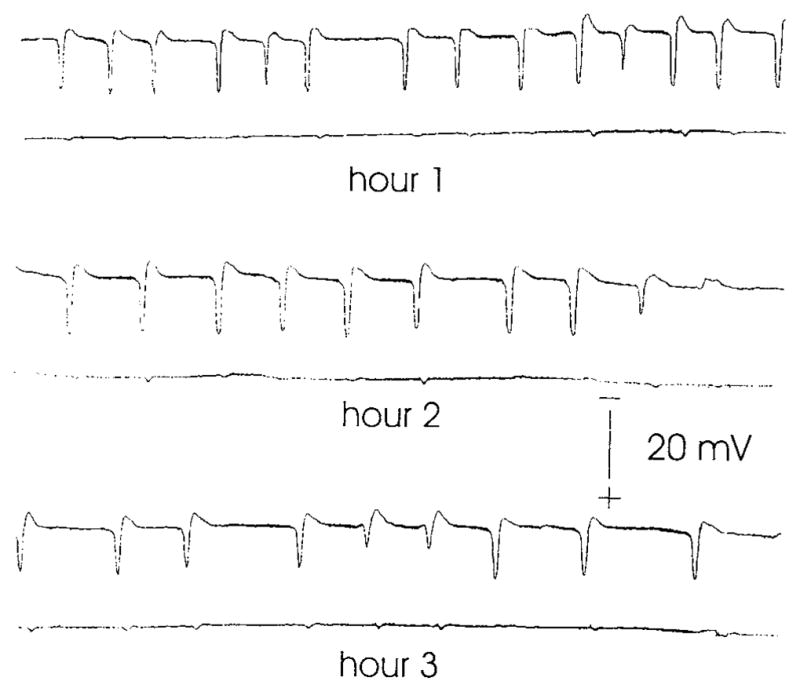
Spreading depression frequency. DC potential records shown were recorded from frontal neocortices during 3 hour period of recurrent spreading depression. Each pair of records represents an hour period. The upper record of each pair is from the left, experimental neocortex that experienced spreading depression, and the lower record of each pair is from the right, control neocortex, which never experienced spreading depression. Spreading depression was induced by micro-injection of 0.5 M KCl every 9 minutes for 3 hours within parietal cortex. At the conclusion of recording periods animals were allowed to survive for 3 days. Then they were re-anesthetized and processed for immunohistochemical staining (IS)for either OX-42 or anti-glial fibrillary acidic protein (GFAP). Sham control animals received similar injections of 0.5 M NaCl and never experienced spreading depression in either neocortex. Other groups of animals received pretreatment before spreading depression with drugs that modulated either eicosanoid or nitric oxide metabolism.
TABLE 1.
Blood Physiologic Variables, Temperature, Anesthesia and Number of SD’s1
| Animal group | pH | PaCO2 (torr) | PaO2 (torr) | Hematocrit (%) | Blood pressure (mrnHg) | Temperature (°C) | Halothane (%) | Sd’s (#) | Glucose (mM) |
|---|---|---|---|---|---|---|---|---|---|
| Sd | 7.28 ± 0.06 | 61 ± 7 | 102 ± 10 | 43 ± 4 | 108 ± 13 | 37.6 ± 0.2 | 1.6 ± 0.3 | 16 ± 3 | 5.6 ± 0.9 |
| Sh | 7.24 ± 0.06 | 65 ± 8 | 101 ±9 | 41 ± 4 | 103 ± 16 | 37.2 ± 0.4 | 1.7 ±0.3 | 0 ± 0** | 5.1 ± 0.5 |
| Dx | 7.29 ± 0.05 | 59 ± 6 | 103 ± 9 | 39 ± 2 | 106 ± 15 | 37.6 ± 0.2 | 1.5 ± 0.2 | 20 ± 11 | 5.3 ± 1.2 |
| Mp | 7.28 ± 0.03 | 58 ± 6 | 100 ± 6 | 39 ± 3 | 100 ± 8 | 37.0 ± 0.2* | 1.4 ± 0.2 | 22 ± 7 | 4.4 ± 1.0 |
| In | 7.24 ± 0.03 | 65 ± 2 | 102 ± 5 | 40 ± 2 | 105 ± 11 | 37.5 ± 0.3 | 1.3 ± 0.2 | 20 ± 11 | 5.4 ± 1.5 |
| Ng | 7.29± 0.06 | 58 ± 9 | 105 ± 17 | 41 ± 4 | 114 ± 10 | 37.4 ± 0.4 | 1.4 ± 0.4 | 18 ± 5 | 5.3 ± 0.9 |
| Pe | 7.29 ± 0.03 | 60 ± 4 | 96 ± 14 | 42 ± 2 | 143 ± 14** | 37.1 ± 0.4 | 1.3 ± 0.2 | 16 ± 5 | 5.7 ± 0.9 |
| NP | 7.25 ± 0.01 | 54 ± 3 | 106 ± 8 | 43 ± 1 | 86 ± 11* | 37.5 ± 0.3 | 1.6 ± 0.1 | 15 ± 2 | 10.6 ± 0.6* |
| Ln | 7.26 ± 0.06 | 60 ± 7 | 102 ± 6 | 40 ± 2 | 116 ± 12 | 37.5 ± 0.3 | 1.4 ± 0.1 | 19 ± 5 | 5.6 ± 0.4 |
| 4Ln | 7.29 ± 0.03 | 57 ± 4 | 93 ± 8 | 45 ± 3 | 125 ± 5* | 37.5 ± 0.3 | 1.7 ± 0.1 | 10 ± 4* | 5.3 ± 1.0 |
| 4Ng | 7.30 ± 0.03 | 57 ± 6 | 92 ± 8 | 39 ± 3 | 98 ± 7 | 37.5 ± 0.1 | 1.7 ± 0.3 | 19 ± 3 | 5.4 ± 0.5 |
Data are means ± standard deviation.
P < 0.05. analyzed using ANOVA and Post-Hoc Tukey
Significantly different from other goups, P < 0.01.
Animals from all experimental groups were in comparable physiologic conditions. Table 1 shows blood physiologic variables, levels of anesthesia and number of spreading depressions for each experimental group. The blood pressures of the Pe, Np (i.e., phenylephrine plus sodium nitroprusside) and 4 day Ln groups are significantly different (P’s < 0.01, 0.05, and 0.05, respectively) from the other groups. These differences likely are due to the vasopressor effects of Pe and Ln-based inhibition of NO production. Chronic treatment with Ln has been reported to alter arterial blood pressure from continued modulation of NO metabolism (Iadecola et al., 1994). The temperature of the Mp group is significantly different (P < 0.05). We do not know of a physiologic basis for this difference. Since cooling might reduce tissue injury and the response to it, one could expect the lowered temperature seen in the Mp group to reduce reactive gliotic changes. However, we do not believe the lowered body temperature seen in the Mp group affected observations within this study (see below). The blood glucose level of the Np group was significant (mean=10.6 mM, P < 0.05). No other significant differences (all P’s > 0.05) are found in any of the groups for pH, PaCO2, PaO2, hematocrit, or level of anesthesia. It should be noted that it is normal for rats under general halothane anesthesia to be slightly hypercarbic; this condition was expected and found. Furthermore, consistent with our previous experiments on spreading depression-induced gliosis, all animals displayed normal grooming, feeding/drinking, and ambulatory behavior after awakening from anesthesia.
SPREADING DEPRESSION AND MICROGLIA
Increased left to right OX-42-IS from spreading depression
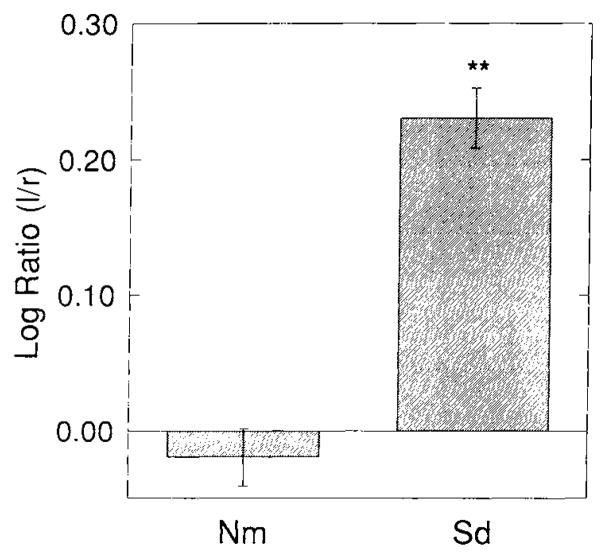
Spreading depression induced an increase in OX-42-IS within animals in the experimental (left) compared to control (right) neocortices. This change is shown in Figure 2. Figure 2A shows a low-power image analogous to those used for computer-based OD measurements. The increase of left neocortical OX-42-IS intensity compared with its right-hand counterpart is evident. Higher-power images taken from corresponding entorhinal cortices (Fig. 2B) illustrate the basis for this increased OX-42-IS. More cells with thicker, albeit shorter processes are evident in the left, experimental cortex compared with the right, control cortex. Qualitatively, the cell bodies in the experimental neocortices also appear larger. The left to right neocortical log ratio of the OX-42-IS OD in this Sd group is significantly different (P < 0.01) from the log ratio of Nm animals according to the Dunnett test for multiple comparisons (Fig. 3, top). While this change is small, as indicated by a non-significant increase in left side experimental compared to left side control optical densities (Fig. 3, bottom), it is highly consistent and significant when normalized as a left to right neocortical OD ratio whose variance is reduced through log-transformation (Fig. 3).
Fig. 2.
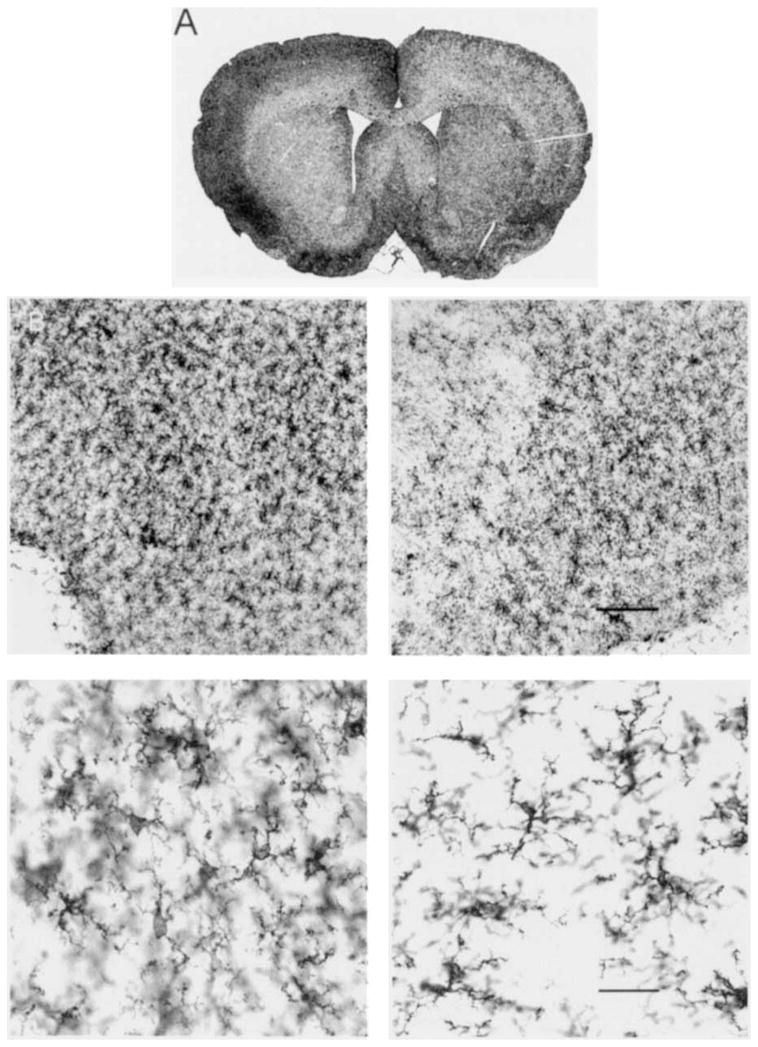
Bright-field photomicrographs of OX-42-IS following spreading depression. Images show OX-42-IS 3 days after 3 hours of recurrent spreading depression in (left) experimental neocortex compared with contralateral (right) neocortex, which did not experience spreading depression. Low-power coronal image (A) is analogous to magnification used for all computer-based optical density analyses. Increased OX- 42-IS intensity is evident throughout left, compared to right, neocortex. Higher power images (B) taken from corresponding left and right entorhinal cortices, where reactive glial changes are accentuated, illustrate basis for IS differences. For example, notice that OX-42-positive microglia are larger and more densely localized after spreading depression. Thus although their processes are shortened, the overall regional immunostaining intensity is elevated after spreading depression consistent with the transformation of these cells by spreading depression into so-called “reactive” species. Calibration bars in right-hand images apply equally to their left-hand counterpart and are 75 μm (2B, top)and 30 μm (2B, bottom).
Fig. 3.
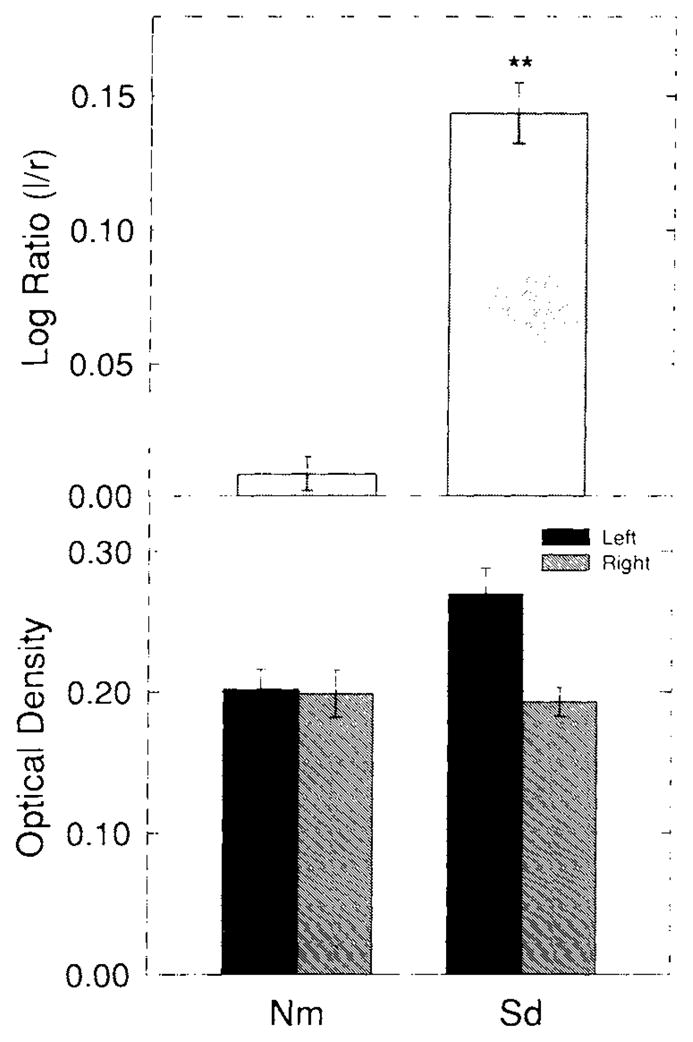
Top: Log ratios of OX-42-IS optical density (OD)values for normal (Nm) and spreading depression (Sd) groups. OD values were determined from experimental images captured at a uniform camera gain. Experimental images were corrected with reference images for background illumination. In addition both types of images were corrected for “dark” and “bias current” variations. These maneuvers produced highly reproducible OD values. For example in a series of test trials, maximum variability was 0.004% for recurrent OD’s (n=5J measured from a single image. Experimental, left OD values were normalized by division with contralateral, right OD values and logarithms taken of the resultant values to stabilize variances. In this way IS that showed no left-to-right differences would result in a value of zero while increased experimental IS would result in a positive value. It should be noted that a decrease in OX-42-IS has not been reported for any physiologic or pathologic phenomena. The log ratio of experimental compared with contralateral control OX-42-IS within neocortex is significantly greater than normal (Nm) animals 3 days after 3 hours of recurrent spreading depression. Bottom: Left and right mean neocortical ODs for OX-42-IS for normal (Nm) and spreading depression (Sd) groups. Each neocortical side (left or right) was compared to its Nm counterpart using the Dunnett test for multiple comparisons. Notice that no significant increase is seen for left or right OD for Sd. The basis for this may lie in the fact that spreading depression is a weak stimulus for microgliosis since no brain cells are destroyed in the process. Normalization of OD values from spreading depression through division by contralateral (non-Sd) OD levels and transformation to logarithmic values reduced variances so that significant changes from spreading depression alone could be illustrated (see top panel).
Drug treatments: log ratios
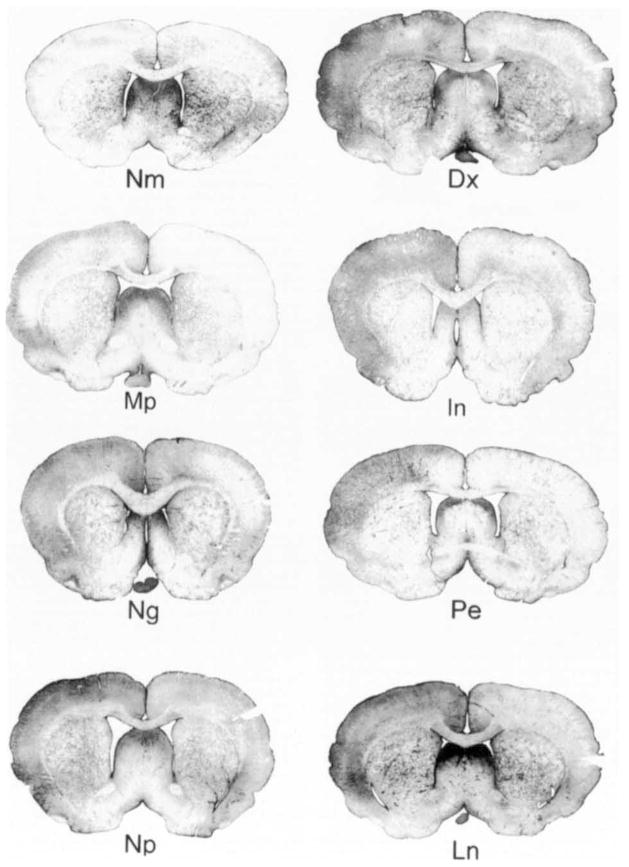
Visual inspection of example coronal images from each experimental group (Fig. 4) illustrates the statistical results shown in Figures 5 and 6. Significant left-to-right side OX-42-IS log ratios from spreading depression are evident in animals pretreated with Mp (P < 0.01), In (P < 0.05), and Pe (P < 0.05) (Fig 5). On the other hand, spreading depression in groups pre-treated Dx, Ng, Np, or Ln did not induce a significant log ratio of OX-42-IS (P’s > 0.05) (Fig. 5). Sh animals also did not show significant OX-42-IS log ratios (P’s > 0.05) (data not shown). Mean log ratios for each group (n=5/group) were compared to log ratios from the Nm group by the Dunnett test.
Fig. 4.
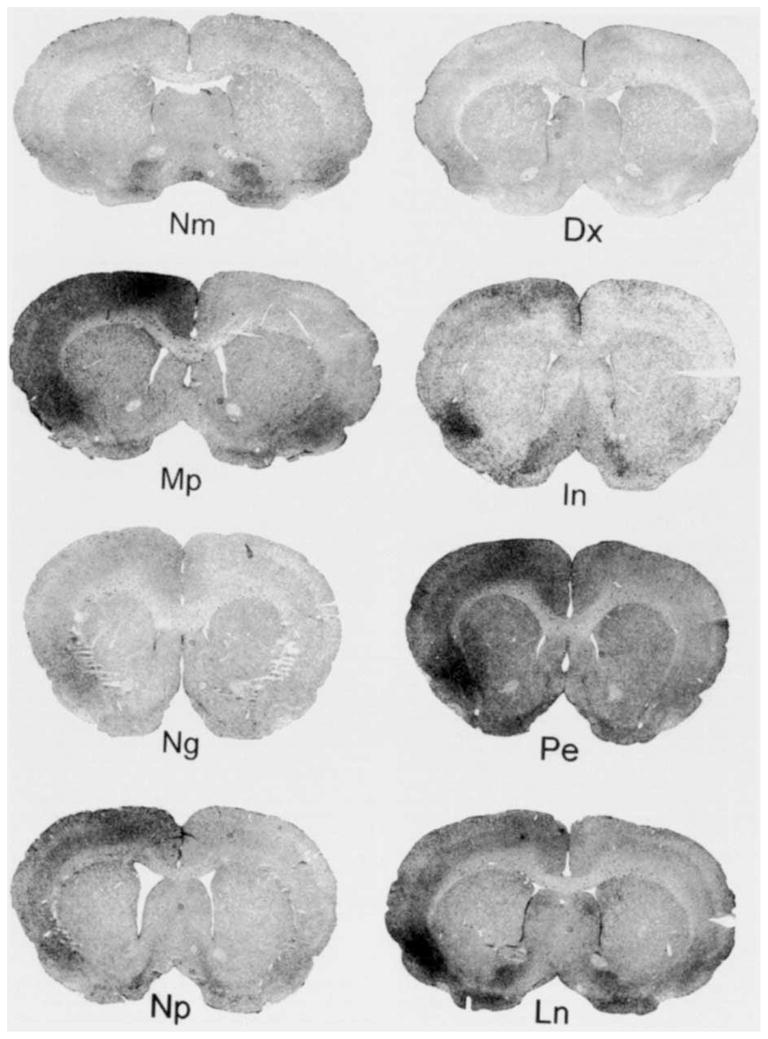
Representative coronal sections of OX-42-IS from each experimental group. One hour before a three hour period of spreading depression, drug treatment animals were given a single, intraperitoneal injection either of dexamethasone (Dx), a glucocorticoid; mepacrine (Mp), a phospholipase A2 inhibitor; Indomethacin (In), a cyclooxygenase inhibitor; nordihydroguaiaretic acid (Ng), a lipoxygenase inhibitor; phenylephrine (Pe), an alpha-adrenergic agonist; sodium nitroprusside with PE (Np) an NO donor; and Nω,-nitro-l-arginine methyl ester (Ln), a NO synthase inhibitor. IS for drug treatment animals also was examined after 3 days of recovery. Pretreatment with drugs that influenced either eicosanoid or NO metabolism, altered OX-42-IS from spreading depression. For example, pretreatment with Dx, Ng, Np, or Ln prevented the left-to-right neocortical staining difference from spreading depression while Mp, In, and Pe did not prevent this difference. Notice that the OX-42-IS in all right, control neocortices is similar (except Ln). In fact, OX-42-IS is so reproducible in control neocortices that comparisons of OX-42-IS OD could be made without normalization (e.g., see Fig. 6).
Fig. 5.
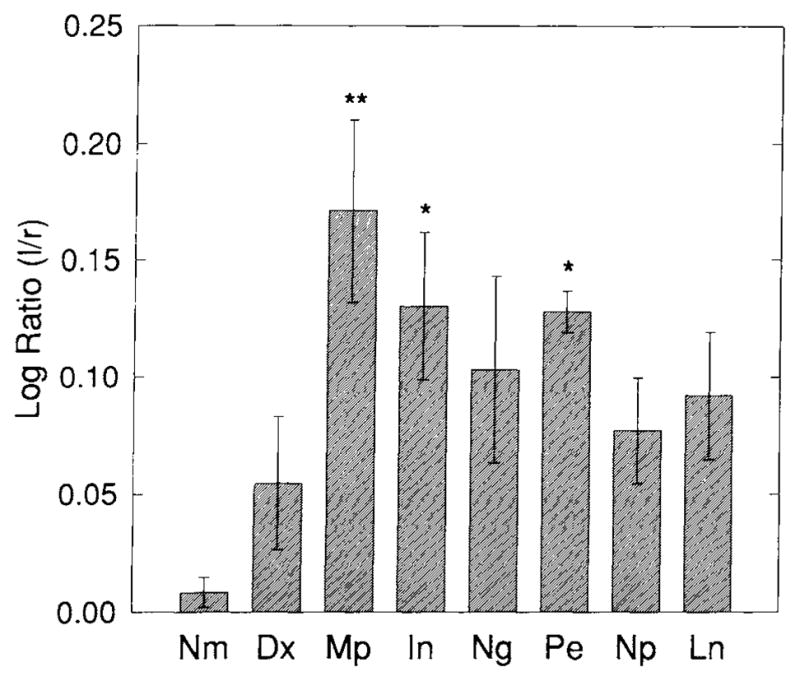
Log ratios of OX-42 optical density (OD) values following spreading depression for all drug treatment groups. OD values were determined as with Nm and Sd (see Fig. 3). A significant increase in OX-42-IS log ratio compared with Nm is still evident despite pretreatment with Mp, In, or Pe. Pretreatment with Dx, Ng, Np, or Ln, however, did not result in a significant increase in OX-42-IS compared with Nm. These results begin to show that induction of microglial reactivity from spreading depression can be modulated by altering eicosanoid and NO homeostasis. Significance levels are indicated by P < .05 (*) and P < .01(**) according to the Dunnett test for multiple comparisons. All groups consist of five animals.
Fig. 6.
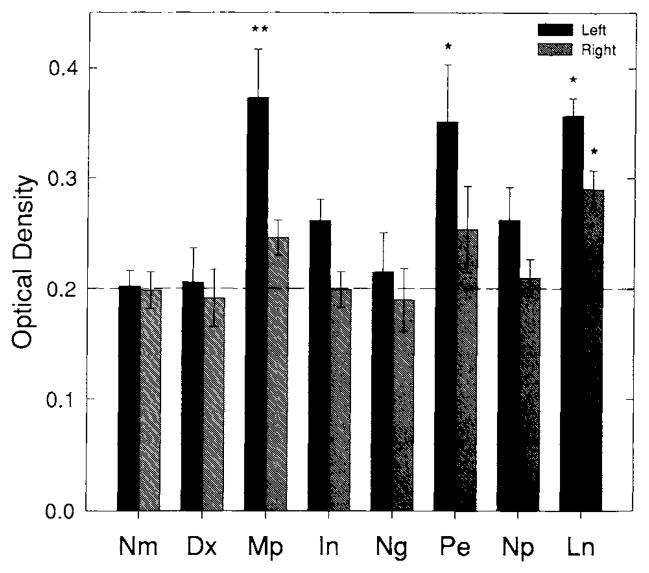
Left and right mean neocortical ODs for OX-42-IS. All abbreviations as in Figure 5. Each neocortical side (left or right) was compared to its Nm counterpart using the Dunnett test for multiple comparisons. Significance levels of P<0.05 (*) and P < 0.01 (**) are indicated. Notice the high reproducibility of right, control mean OD. Ln produced an OX-42 staining OD that is significantly greater than the Nm right side while right-sided ODs from Mp or In pretreatment tended to be slightly above Nm. On the left (the spreading depression side) Mp, Ln, and Pe each caused a significant increase in OX-42-IS compared to left, Nm levels. These changes were so dramatic that significance was reached without log transformation. The significant left and right increase in Ln staining intensity accounts for why no significant increase in the log ratio of left versus right OX-42-IS is seen (see Fig. 5). Notice that the Dx and Ng group are nearly identical to the normal group, the Np group is slightly elevated (perhaps due to Pe treatment), but despite the power of log transformation and within animal comparison, this change could not reach significance (see Fig. 5), indicating that the gliosis in this group is only slightly above that of normal animals (the Nm group).
Controls for the drug treatment groups consisted of animals (n = 5 per group) treated with drugs (e.g., Dx, Mp, In, Ng, Pe, Np, and Ln) but not experiencing spreading depression. None of these animals (n=35) show significant left-to-right log ratios of OX-42-IS compared to Nm animals (data not shown).
Drug treatment: Single side comparisons
Average OX-42-IS intensities of the left- and right-sided neocortices for each experimental group are shown in Figure 6. Comparisons of these intensities (expressed as ODs) to same-side IS intensities from the Nm (e.g., non-spreading depression group) were made using the Dunnett test for multiple comparisons. Ipsilateral comparisons between experimental and control animal groups were possible because the high reproducibility of the OX-42-IS intensity measurements.
Significant increases in IS intensities of the left (experimental) neocortices above normal are found in the Mp (P < 0.01), Pe (P < 0.05), and Ln (P<.05) treated groups (Fig. 6). This increase in IS intensity is also evident upon visual inspection (Fig. 4). No significant increases in the IS intensities of left neocortices are found in any other groups (e.g., Dx, In, Ng, Np) (P’s>.05). Notice that the values for Dx and Ng are virtually indistinguishable from the Nm group (Fig. 6).
A significant increase in IS intensity was found in the control right (control) neocortex of only the Ln pretreated group (P<0.05) (see Figs. 4 and 6). Thus, the non-significant log ratio of IS intensity in animals treated with Ln (Fig. 5) was not the result of preventing the induction of microgliosis. Instead, it was because the control (right) neocortex showed a parallel increase in IS intensity compared with the experimental (left) side. This resulted in preventing the log ratios of this group from reaching significant values (Figs. 4–6). No significant changes in the IS intensity of the right cortex are seen in any other groups (n’s=5 and P’s> 0.05). Right-sided IS intensities were highly reproducible and averaged approximately 0.2 OD units with little difference in standard error among groups (Fig. 6). The dotted line in Figure 6 represents a value midway between the left and right average OD of the Nm group. A trend toward increased IS intensity is seen in those animal groups (e.g., Mp, Ln, and Pe) with significant left-sided changes. Spreading depression alone had less of an impact on OX-42-IS intensity, inducing a small but consistent left-to-right increase in OX-42-IS intensity that required a “within animal control” to reach significance (see Fig. 3); this was not the case with Mp, Ln, and Pe where significant left side increases were reached without within animal log-transformation.
No change in left or right OD values from Nm were encountered in any of the drug control groups. Thus these data are not shown.
Four day drug treatments
Single injections of either Ng and Ln were effective in preventing the log ratios of OX-42-IS intensities from reaching significant differences between left and right sides. To demonstrate that this action was occurring at the time of induction and to see if more protracted treatment could reduce these values even closer to Nm values and reduce the variability, two groups of animals were injected with either Ng (4Ng) or Ln (4Ln) beginning 1 day before and continuing 3 days after 3 hours of spreading depression. The results for these groups are shown in Figure 11 (top and bottom). Both drugs (Fig. 11, top) prevented the log ratios of OX-42 staining intensity from reaching significant values over the normal group, P’s>0.05 (Dunnett test). As with the single dose drug treatment, the 4Ln group showed significant increases in OX-42-IS intensity in both the left-hand and right-hand neocortices compared to corresponding neocortical sides in the Nm group (P’s< 0.05; Dunnett test). The 4Ng group did not show significant increases in either cortex, P’s > 0.05 (Dunnett test) (Fig. 11, bottom). Histologic sections of these groups were not different from single treatment animals and are not shown.
Fig. 11.
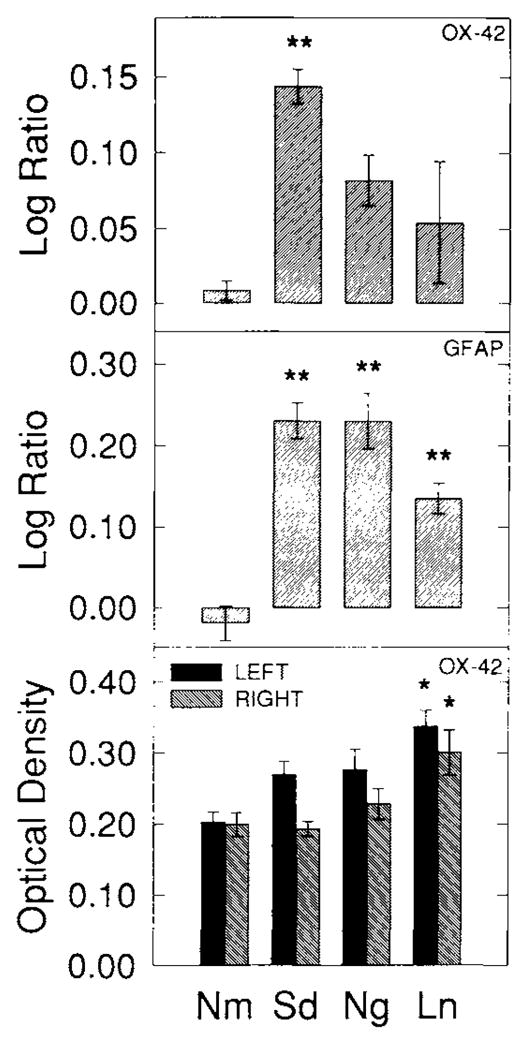
OX-42-IS and GFAP-IS summary following spreading depression and 4 day drug treatments. Ng and Ln prevented the rise in the log ratio of OX-42-IS from spreading depression from reaching significant values compared with Nm. To test whether more protracted treatment could result in values even closer to normal, animals were treated with either Ng or Ln beginning 1day before and extending to 3 days after 3 hours of recurrent spreading depression. The log ratios of left, experimental vs. right, control OX-42-IS are shown in top histogram. Ng or Ln again prevented the increase in left, experimental OX-42-IS compared to right, control levels from reaching significant levels. Thus, 4 days of treatment with Ng or Ln appears only similarly effective as single treatment in altering OX-42-IS from spreading depression. Also, the middle histogram shows that GFAP-IS was still significantly greater than Nm in spite of 4 days of treatment with either Ng or Ln. OX-42-IS and GFAP-IS log ratios are compared with normal animal left versus right neocortical-IS log ratios by the Dunnett test. The bottom histogram shows left and right neocortical OX-42-IS OD. Results closely parallel those seen from a single treatment with either Ng or Ln. Group mean ODs from each neocortical side are compared with its corresponding value from the Nm group by the Dunnett test. Significance levels are indicated by P < 0.05 (*) and P < 0.01 (**). Each group consisted of five animals.
Spreading depression and astrocytes
Spreading depression caused increased left to right GFAP staining
Spreading depression induced an increase in GFAP-IS intensity in the experimental compared to control neocortices in the Sd group, as previously reported (Kraig et al., 1991, 1995a,b). This change is shown in Figure 7A,B. The left-to-right log ratio of the GFAP-IS intensity is significant when compared with the log ratio of Nm animals (P< 0.01) according to the Dunnett test for multiple comparisons (Fig. 8). No significant differences were found in the Sh group (n=5, P > .05) (data not shown).
Fig. 7.
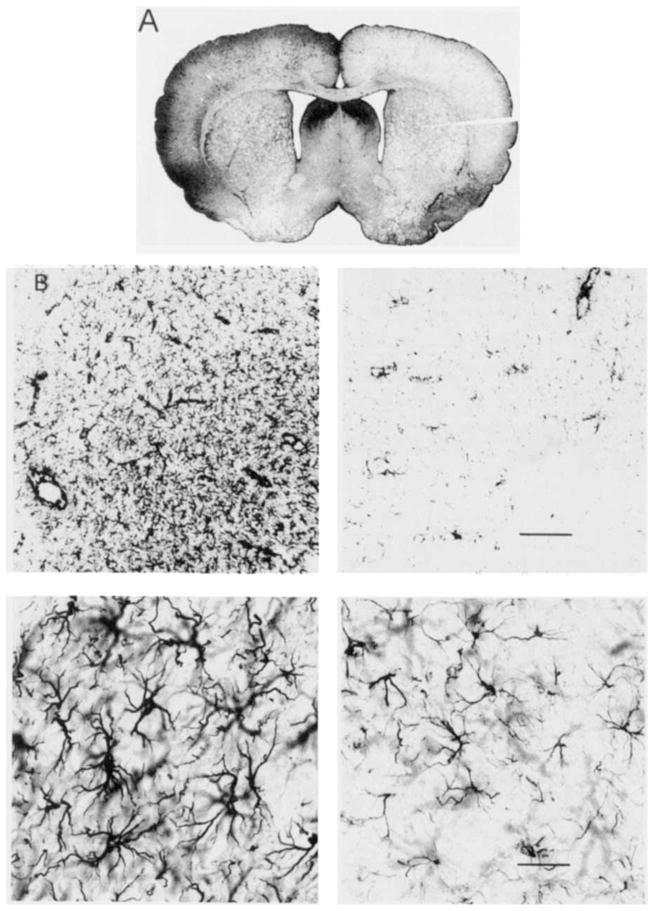
Bright-field photomicrographs of GFAP-IS following spreading depression. Images show GFAP-IS 3 days after 3 hours of recurrent spreading depression in (left) experimental neocortex compared with contralateral (right) neocortex, which did not experience spreading depression. Low-power coronal image (A) is analogous to magnification used for all computer-based optical density analyses. Increased GFAP-IS is evident throughout left, compared to right, neocortex. Higher power images (B) taken from corresponding left and right entorhinal cortices, where reactive glial changes are accentuated, illustrate the basis for IS differences. GFAP-positive astrocytes are larger and more numerous after spreading depression compared with contralateral controls. Calibration bars in right-hand images apply equally to their left-hand counterpart and are 75 μm (B, top) and 30 μm (B, bottom).
Fig. 8.
The log ratio of experimental compared with contralateral control GFAP-IS within neocortex was significantly greater than normal 3 days after 3 hours of recurrent spreading depression. All abbreviations as in Figure 3. Significance levels are indicated by P < 0.05 (*) and P < 0.01 (**) according to the Dunnett test for multiple comparisons. All groups consist of five animals per group.
Drug treatments
An example coronal section from each of the drug treated groups is shown in Figure 9. Note the obvious left/right IS intensity difference in all groups other than Nm. Significant log ratios (p’s < 0.01) were induced by spreading depression in all drug-treated groups compared with the normal no-spreading depression group (Fig. 10). The 4-day drug treatments with either Ng or Ln also failed to prevented significant log ratio values from spreading depression compared with Nm (Fig. 11, middle).
Fig. 9.
Representative coronal sections of GFAP-IS from each experimental drug group. All abbreviations are as in Figure 4. Left-right neocortical GFAP-IS staining differences were induced in each group despite the pretreatment with drugs that influence eicosanoid or NO metabolism. Quantitative OD analyses (e.g., Fig. 10) confirmed this impression.
Fig. 10.
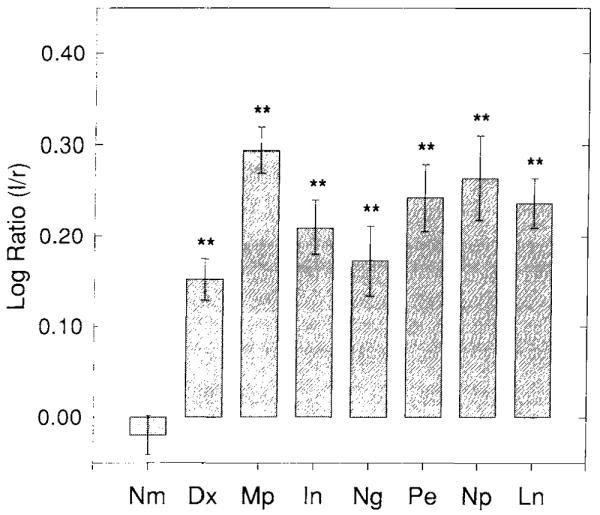
The log ratio of experimental compared with contralateral control GFAP-IS within neocortex was significantly greater than normal 3 days after 3 hours of recurrent spreading depression for all drug groups. All abbreviations as in Figure 9. Significance levels are indicated by P < 0.05 (*) and P <0.01 (**) according to the Dunnett test for multiple comparisons. All groups consist of five animals per group.
Analysis of single-side GFAP-IS intensities revealed no significant differences for any of the experimental groups compared with same side normal controls (data not shown). This may be due, however, to the less reliable GFAP-IS, which thus required a “within animal control” (i.e., left vs. right log ratio, Fig. 10). In contrast to the OX-42 staining, visual inspection suggested no obvious correlation between drug group and staining intensity. For these reasons, the results of the GFAP staining are only reported as left vs. right log ratios.
DISCUSSION
Despite the limitations and caveats of information based exclusively on pharmacologic manipulation, this work provides clear evidence for the involvement of eicosanoid and nitric oxide mediators in the induction of reactive microgliosis. Furthermore, we have demonstrated that induction of reactive changes in microglia can be can be pharmacologically separated from those in astrocytes. Gerhmann and colleagues (1993) suggested that microgliosis from spreading depression might induce astrogliosis. This conclusion was based on their observation that microglial changes seem to occur before and at a lower threshold than astroglial changes from spreading depression. Our results, however, begin to refute this notion. Through modulation of eicosanoid and NO metabolism we can prevent the significant increase in microglial reactivity that is otherwise seen after spreading depression. Alterations in these inter-cellular mediators, however, did not effect astroglial changes from spreading depression (compare Figs. 4 and 5 with 9 and 10).
Our results show that after 3 days, spreading depression induced a significant left-over-right neocortical log ratio of OX-42-IS intensity in the Sd group compared with normal animals (Fig. 3). Dexamethasone (Dx), nordihydroguaiaretic acid (Ng), Nω-nitro-l-arginine methyl ester (Ln) and sodium nitroprusside (Np) with phenylephrine (Pe) prevented the induction of a significant OX-42 log ratio of IS intensity (Fig. 5). Mepacrine (Mp), Indomethacin (In), and Pe (alone) all failed to inhibit significant log ratio values. Sd alone induced significant log-ratios of GFAP-IS intensity (Fig. 8)and none of the drug treatments could prevent this induction (Fig. 10). This demonstrates convincingly that the induction of reactive microgliosis is more sensitive to eicosanoid and nitric oxide modulation than is the induction of astrogliosis. Indeed, in several animals within the Dx, Ng, and Np experimental groups, left-to-right OX-42-IS intensity was indistinguishable from normal animals. Quantitation confirmed this impression (Fig. 6). Perhaps microglial activation (as evidenced by enhanced OX-42-IS) alone is not a prerequisite for activation of astrocytes from spreading depression. Instead, parallel processes may occur with spreading depression that can induce astrocytes independent of microglial changes. Our pharmacologic results indicate that if these processes are not truly parallel, they may at least be modulated to have differential effects on microglia and astrocytes.
Previous work from our laboratory used the log-ratio of left-over-right neocortical GFAP-IS intensity as a measure of astrogliosis from spreading depression (Kraig et al., 1991). We have gone on to show that this increase in GFAP-IS is due to a true increase in GFAP protein content (Kraig et al., 1995b). Furthermore, this increase in GFAP-IS is due to a significant increase in astroglial size and not the number of cells that stain positively for GFAP (Kraig et al., 1995b). A left, experimental vs. right, control normalization of GFAP-IS intensity and logarithm transformation of this value was done to reduce variability of intensity measurements and enhance our ability to detect significant differences in experimental side IS intensity from spreading depression.
OX-42-IS intensity showed a very low variability even in tissues processed up to one year apart, as seen by the small standard errors in Figure 6 showing left and right IS intensities. These consistent values were due to several factors. First, the lysine-periodate-based fixation was essential for highly reproducible OX-42-IS. No other fixative used (refer to methods) could produce the quality of results seen with this fixative. Second, a 1:20,000 dilution of the OX-42 primary antibody allowed all antibody solutions to be derived from the same stock solution, thus avoiding potential mixing errors. Third, tissue was processed identically for every animal. Finally, a high resolution and sensitive cooled CCD camera, following “gain” calibration, allowed us to make OD measurements that were reproducible to within four one-thousandths of a percent. Together these factors allowed us to make accurate comparisons of IS for microglia without normalization from control data.
Inspection of microglial (OX-42) IS from the Ln group suggested that IS intensity of the left, experimental neocortex was elevated despite a lack of significant elevation of the log ratio of IS intensity (Fig. 5). Single-sided analysis of OX-42-IS intensity showed that the reason the Ln log ratios were only elevated to non-significant values was due to significant increases in IS intensities in both the experimental and control neocortices compared to their Nm counterparts (Fig. 6). Mp and Pe also demonstrated significant increases in IS intensity on the experimental side (Fig. 6). Notice in Figure 6 that the left (experimental) and right (control) side OX-42-IS intensities for Ng and Dx are nearly identical to Nm. This type of comparison demonstrates the subtle change in OX-42- IS induced by the benign perturbation of spreading depression. While the left-to-right change in IS intensity in animals of the Sd group is consistent and significant (Fig. 3), the increase in single-side staining intensity is not much greater than the small, but unavoidable variability in staining and is thus not significantly greater than same-side comparisons to controls (Fig. 3). With the addition of Mp, Ln, or Pe, however, this increase in single-side staining with spreading depression becomes so dramatic (Figs. 4, 6) that single side comparisons become significant. This type of comparison also allows one to begin to hypothesize potential mechanistic pathways responsible for the initiation of microglial reactive changes.
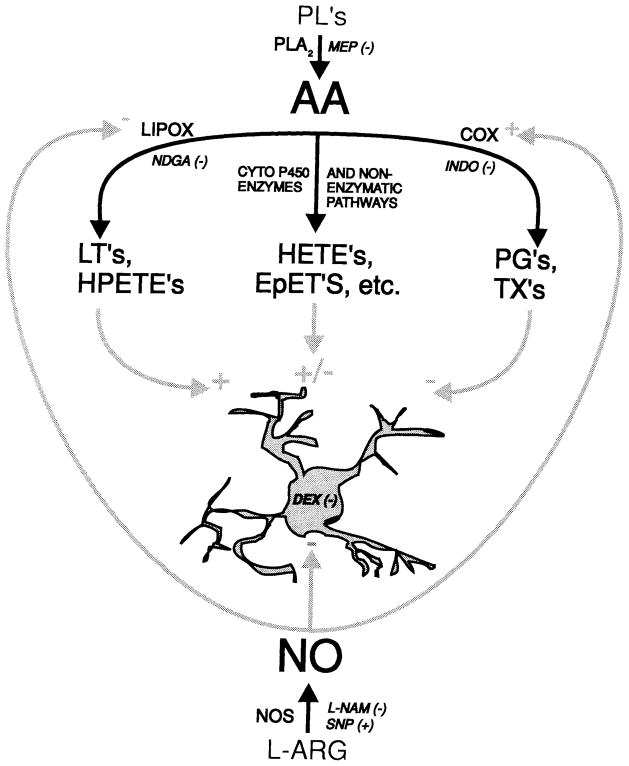
We remain uncertain as to the precise mechanism(s) by which alterations in eicosanoid metabolism effect microgliosis. However, we do believe these data suggest that the lipoxygenase and cyclooxygenase pathway products from the arachidonic acid cascade have differential effects upon the induction of microgliosis. Taken together, our results and the recognized effects of drugs used in this study upon eicosanoid pathways allow us to propose the following conservative and preliminary synthesis (see Fig. 12). Lipoxygenase products [leukotrienes (LT’s) and hydroperoxides (HPETE’s)] may act to induce or enhance early microglial reactive changes (e.g., enhanced IS for the CR3 receptor as evidenced by increase OX-42-IS). This is supported by our data demonstrating blockade of induced gliosis by inhibition of the lipoxygenase pathway (Ng) (Figs. 4–6). Furthermore, cyclooxygenase products (prostaglandins (PG’s) and thromboxanes (TX’s)) may prevent induction of, or reduce microgliosis, as inhibition of the cyclooxygenase pathway (In) resulted slightly increased microgliosis. The overall effect of the eicosanoids appears to inhibit the induction of microgliosis, as PLA2 inhibition (Mp) resulted in large increases in microglial reactivity. This scenario is supported by work with peripheral macrophages (Suzuki et al., 1994), demonstrating cyclooxygenase inhibition increases the reactivity of macrophages while lipoxygenase inhibitors decreases macrophage reactivity.
Fig. 12.
Schematic diagram of arachidonic acid cascade and nitric oxide metabolism with their possible interactions and roles in reactive microgliosis. Cell represents a microglia. Black arrows indicate known metabolic pathways. Gray arrows show the pathways by which we propose these products may influence reactive gliosis. Small black italic letters indicate pharmacologic agents used in this investigation. Stimulatory action is indicated by + and inhibitory action by −. PL, membrane phospholipids; PG’s, prostaglandins; TX’s, thromboxanes; LT’s, leukotrienes; HPETE’s, hydroperoxy-eicosatetraenoic acids; HETE’s, hydroxy-eicosatetraenoic acids; EpET’s, epoxy-eicosatrienoic acids; Cyto P450, Cytochrome P450; L-ARG, L-Arginine; NOS, Nitric Oxide Synthases; all other abbreviations are as in text and Figure 4. The results show that lipoxygenase blockade largely prevented microgliosis (Figs. 4–6), suggesting that lipoxygenase products enhance or induce microgliosis. On the other hand, cyclooxygenase blockade slightly enhanced microgliosis. Furthermore, the results suggests that the overall effect of the eicosanoids inhibits the induction of microgliosis, as Mp pre-treatment produced large increases in microglia reactivity (Figs. 4–6). Our results also support the emerging evidence that NO inhibits lipoxygenase and stimulates cyclooxygenase, as blockade of NO production via Ln enhanced microgliosis (Figs. 4, 6), while NO production (Np) prevented the induction of significant gliosis (Figs. 4–6). Dexamethasone, as expected, can prevent induction of reactive gliosis, perhaps through transcriptional modulation (Figs. 4–6).
Astrocytes and neurons may play a role in inducing reactivity in microglia. Several in vitro studies show that astrocytes secrete eicosanoids, particularly of the 12-lipoxygenase pathway (Ishizaki and Murota, 1991; Amruthesh et al., 1993). In addition, the arachidonic acid cascade may be functional in astrocytes in vivo since PLA2 is localized to astrocytes within acute brain slices (Stephenson et al., 1994). Thus, astrocytes might be a source of LT’s and HPETE’s that induce the transformation of microglia into reactive species. Neurons might also affect the reactivity of microglia. Distributions of the two eicosanoid producing enzymes (e.g., constitutive and inducible cyclooxygenase), characterized by Breder et al. (1992) and Breder et al. (1995), have been shown to exhibit neuronal-like patterns.
We also have demonstrated that modulation of NO production influences the reactivity of microglia. NO likely effects these cells through several mechanisms. Evidence exists that NO has regulatory effects on two of the AA cascade enzymes investigated in this study. NO has inhibitory effects upon the activity of lipoxygenase (Kanner et al., 1992; Nakatsuka and Osawa, 1994) and both stimulatory (Salvemini et al., 1993; Franchi et al., 1994) and inhibitory effects upon cyclooxygenase (Stadler et al., 1993). These opposing effects likely depend upon microenvironmental conditions. The results presented here are consistent with NO inhibiting lipoxygenase and enhancing cyclooxygenase following spreading depression in vivo. In support of this view, NO production through Np reduced the induction of microglial reactivity, similar to Ng (Fig. 6), perhaps by inhibiting lipoxygenase and/or stimulating cyclooxygenase. Small increases in OX-42 IS intensity are likely due to the necessary co-treatment with Pe (Fig. 6). On the other hand, blockade of NO production through Ln treatment resulted in enhanced microglial reactivity, perhaps through a disinhibition of lipoxygenase and/or reduced activation of cyclooxygenase (Fig. 6). Finally, evidence exists that adrenergic agonists can block induction of inducible NO synthase (Feinstein et al., 1993). Accordingly, then adrenergic agonists, such as Pe, might increase microgliosis in a manner similar to that of Ln. This possibility is also supported by our results (Fig. 6).
Figure 12 is a schematic representation of the arachidonic acid cascade and its possible role in reactive microgliosis, and possible interactions with NO. Each of the gray arrows and sign indicators are supported by the literature and the results of this work. Evidence for each section of this diagram is described in the above discussion. In summary, we believe that the two major branches of the arachidonic acid cascade may have opposing effects upon reactive microgliosis, with lipoxygenase products enhancing or inducing reactivity and cyclooxygenase products preventing or reducing reactivity. NO may reduce microglial reactivity by inhibiting lipoxygenase activity and enhancing cyclooxygenase activity. While these results are not definitive for an action of NO upon lipoxygenase or cyclooxygenase, they are consistent with our proposed model and the work of others.
Acknowledgments
This work was supported by a grant from the National Institute of Neurological Disorders and Stroke (NS-19108), the American Heart Association of Metropolitan Chicago, and the Brain Research Foundation of the University of Chicago. A.O.C. was supported by a Medical Scientist National Research Service Award (T32-GM-07281) from the National Institute of General Medical Health. We also thank several members of our laboratory for their assistance in this project. Ms. Marcia P. Kraig provided assistance in animal experiments. Dr. P.E. Kunkler and C.D. Lascola provided critical advice throughout the experiments and read a final version of the manuscript. C.D. Breder participated in preliminary experiments. R. Hulse participated in the computer-based image analyses. We also wish to acknowledge the assistance of Mr. Gerard J. Caggiano for his insight related to electronic camera technology as used in our experiments.
Contributor Information
ANTHONY O. CAGGIANO, Committee on Neurobiology, The University of Chicago, Chicago, Illinois 60637
RICHARD P. KRAIG, Departments of Neurology and Pharmacological and Physiological Sciences, and Committee on Neurobiology, The University of Chicago, Chicago, Illinois 60637
LITERATURE CITED
- Agnati LF, Fuxe K. Computer-assisted morphometry and microdensitometry of transmitter-identified neurons with special reference to the mesostriatal dopamine pathway. Acta Physiol Scand. 1984;532:4–36. [PubMed] [Google Scholar]
- Anderson BJ, Li LX, Alcantara AA, Isaacs KR, Black JE, Greenough WT. Glial hypertrophy is associated with synaptogenesis following motor-skill learning; but not with angiogenesis following exercise. Glia. 1994;11:73–80. doi: 10.1002/glia.440110110. [DOI] [PubMed] [Google Scholar]
- Anderson C. Easy-to-alter digital images raises fears of tampering. Science. 1994;263:317–318. doi: 10.1126/science.8278802. [DOI] [PubMed] [Google Scholar]
- Amruthesh SC, Boerschell MF, McKinney JS, Willoughby KA, Ellis EF. Metabolism of arachidonic acid to epoxyeicosatrienoic acids, hydroxyeicosatetraenoic acids, and prostaglandins in cultured rat hippocampal astrocytes. J Neurochem. 1993;61:150–159. doi: 10.1111/j.1471-4159.1993.tb03550.x. [DOI] [PubMed] [Google Scholar]
- Auphan N, DiDonato JA, Rosette C, Helmberg A, Karin M. Immunosuppression by glucocorticoids: Inhibition of NF-κB activity through induction of IκB synthesis. Science. 1995;270:286–290. doi: 10.1126/science.270.5234.286. [DOI] [PubMed] [Google Scholar]
- Boje KM, Arora PK. Microglial-produced nitric oxide and reactive nitrogen oxides mediate neuronal cell death. Brain Res. 1992;587:250–256. doi: 10.1016/0006-8993(92)91004-x. [DOI] [PubMed] [Google Scholar]
- Breder CD, Smith WL, Raz A, Masferrer JL, Seibert K, Needleman P, Saper CB. The distribution and characterization of cyclooxygenase-like immunoreactivity in ovine brain. J Comp Neurol. 1992;322:409–438. doi: 10.1002/cne.903220309. [DOI] [PubMed] [Google Scholar]
- Breder CD, Dewitt D, Kraig RP. Characterization of inducible cyclooxygenase in rat brain. J Comp Neurol. 1995;355:296–315. doi: 10.1002/cne.903550208. [DOI] [PMC free article] [PubMed] [Google Scholar]
- Bretag AH. Synthetic interstitial fluids for isolated mammalian tissue. Life Sci. 1969;8:319–329. doi: 10.1016/0024-3205(69)90283-5. [DOI] [PubMed] [Google Scholar]
- Bureš J, Burešová O, Křivánek J, editors. The Mechanism and Applications of Leāo’s Spreading Depression of Electroencephalographic Activity. New York: Academic Press, Inc; 1974. [Google Scholar]
- Caggiano AO, Kraig RP. Effects of eicosanoid and nitric oxide mediators on microglial reaction to spreading depression. Soc Neurosci (Abstract) 1995a;21:1080. [Google Scholar]
- Caggiano AO, Kraig RP. Eicosanoids and nitric oxide modulate reactive gliosis in microglia but not astrocytes. Neurotrauma Soc (Abstract) 1995b;12:981. doi: 10.1002/(SICI)1096-9861(19960520)369:1<93::AID-CNE7>3.0.CO;2-F. [DOI] [PMC free article] [PubMed] [Google Scholar]
- Chen F, Pararajasegaram G, Sevanian A, Rao NA. Treatment of S antigen uveoretinitis with lipoxygenase and cyclo-oxygenase inhibitors. Ophthal Res. 1991;23:84–91. doi: 10.1159/000267094. [DOI] [PubMed] [Google Scholar]
- Faraci MF, Brian JE. Nitric oxide and the cerebral circulation. Stroke. 1994;25:692–703. doi: 10.1161/01.str.25.3.692. [DOI] [PubMed] [Google Scholar]
- Feinstein DL, Galea E, Reis DJ. Norepinephrine suppresses inducible nitric oxide synthase activity in rat astroglial cultures. J Neurochem. 1993;60:1945–1948. doi: 10.1111/j.1471-4159.1993.tb13425.x. [DOI] [PubMed] [Google Scholar]
- Flower RJ, Blackwell GJ. The importance of phospholipase-A2 in prostaglandin biosynthesis. Biochem Pharmacol. 25:285–291. doi: 10.1016/0006-2952(76)90216-1. [DOI] [PubMed] [Google Scholar]
- Franchi AM, Chaud M, Rettori V, Suburo A, McCann SM, Gimeno M. Role of nitric oxide in eicosanoid synthesis and uterine motility in estrogen-treated rat uteri. Proc Natl Acad Sci USA. 1994;91:539–543. doi: 10.1073/pnas.91.2.539. [DOI] [PMC free article] [PubMed] [Google Scholar]
- Fujita S. The microcomputer-based color image analyzer and its application to histochemistry. J Histochem Cytochem. 1983;31:238–40. [PubMed] [Google Scholar]
- Gehrmann J, Mies G, Bonnekoh P, Banati R, Iijima T, Kreutzberg GW, Hossmann KA. Microglial reaction in the rat cerebral cortex induced by cortical spreading depression. Brain Pathol. 1993;3:11–17. doi: 10.1111/j.1750-3639.1993.tb00720.x. [DOI] [PubMed] [Google Scholar]
- Graeber MB, Kreutzberg GW, Streit WJ, editors. Special issue: Microglia. Glia; 1993. pp. 71–120. [Google Scholar]
- Graeber MB, Streit WJ, Kreutzberg GW. Axotomy of the rat facial nerve leads to increased CR3 complement receptor expression by activated microglial cells. J Neurosci Res. 1988a;21:18–24. doi: 10.1002/jnr.490210104. [DOI] [PubMed] [Google Scholar]
- Graeber MB, Tetzlaff W, Streit WJ, Kreutzberg GW. Microglial cells by not astrocytes undergo mitosis following rat facial nerve axotomy. Neurosci Lett. 1988b;85:317–321. doi: 10.1016/0304-3940(88)90585-x. [DOI] [PubMed] [Google Scholar]
- Hartnell A, Kay AB, Wardlaw AJ. Interleukin-3-induced up-regulation of CR3 expression on human eosinophils in inhibited by dexamethasone. Immunol. 1992;77:488–493. [PMC free article] [PubMed] [Google Scholar]
- Iadecola C, Pelligrino DA, Moskowitz MA, Lassen NA. Nitric oxide synthase inhibition and cerebrovascular regulation. J Cereb Blood Flow Metab. 1994;14:175–192. doi: 10.1038/jcbfm.1994.25. [DOI] [PubMed] [Google Scholar]
- Ishizaki Y, Murota S. Arachidonic acid metabolism in cultured astrocytes: Presence or 12-lipoxygenase activity in the intact cells. Neurosci Lett. 1991;131:149–152. doi: 10.1016/0304-3940(91)90600-x. [DOI] [PubMed] [Google Scholar]
- Kanner J, Harel S, Granit R. Nitric oxide, an inhibitor of lipid oxidation by lipoxygenase, cyclooxygenase and hemoglobin. Lipids. 1992;27:46–49. doi: 10.1007/BF02537058. [DOI] [PubMed] [Google Scholar]
- Kiefer R, Kreutzberg GW. Effects of dexamethasone on microglial activation in vivo: Selective downregulation of major histocompatibility complex class II expression in regenerating facial nucleus. J Neuroimmunol. 1991;34:99–108. doi: 10.1016/0165-5728(91)90119-r. [DOI] [PubMed] [Google Scholar]
- Kraig RP, Dong L, Thisted R, Jaeger CB. Spreading depression increases immunohistochemical staining of glial fibrillary acidic protein. J Neurosci. 1991;11:2187–2198. doi: 10.1523/JNEUROSCI.11-07-02187.1991. [DOI] [PMC free article] [PubMed] [Google Scholar]
- Kraig RP, Lascola CD, Caggiano AO. Glial response to brain ischemia. In: Ransom B, Kettenmann H, editors. Neuroglial Cells. New York: Oxford Press; 1995a. pp. 964–976. [Google Scholar]
- Kraig RP, Lascola CD, O’Callaghan J. Reactive astrocytosis from spreading depression occurs with a transient increase in glial fibrillary acidic protein. Soc Neurosci (Abstract) 1995b;19:268. [Google Scholar]
- Leāo AAP. Spreading depression of activity in the cerebral cortex. J Neurophysiol. 1944;7:359–390. doi: 10.1152/jn.1947.10.6.409. [DOI] [PubMed] [Google Scholar]
- Lees GJ. The possible contribution of microglia and macrophages to delayed neuronal death after ischemia. J Neurol Sci. 1993;114:119–122. doi: 10.1016/0022-510x(93)90285-7. [DOI] [PubMed] [Google Scholar]
- Marx J. How the glucocorticoids suppress immunity. Science. 1995;270:232–233. doi: 10.1126/science.270.5234.232. [DOI] [PubMed] [Google Scholar]
- Morioka T, Streit WJ. Expression of immunomolecules on microglial cells following neonatal sciatic nerve axotomy. J Neuroimmunol. 1991;35:21–30. doi: 10.1016/0165-5728(91)90158-4. [DOI] [PubMed] [Google Scholar]
- Moskowitz MA, Nozaki K, Kraig RP. Neocortical spreading depression provokes the expression of c-fos protein-like immunoreactivity within trigeminal nucleus caudalis via trigeminovascular mechanisms. J Neurosci. 1993;13:1167–1177. doi: 10.1523/JNEUROSCI.13-03-01167.1993. [DOI] [PMC free article] [PubMed] [Google Scholar]
- Nakatsuka M, Osawa Y. Selective inhibition of the 12-lipoxygenase pathway of arachidonic acid metabolism by L-arginine or sodium nitroprusside in Intact human platelets. Biochem Biophys Res Commun. 1994;200:1630–1634. doi: 10.1006/bbrc.1994.1638. [DOI] [PubMed] [Google Scholar]
- Nedergaard M, Hansen AJ. Spreading depression is not associated with neuronal injury in rat brain. Brain Res. 1988;449:395–398. doi: 10.1016/0006-8993(88)91062-1. [DOI] [PubMed] [Google Scholar]
- Needleman P, Turk J, Jakschik BA, Morrison AR, Lefkowith JB. Arachidonic acid metabolism. Annu Rev Biochem. 1986;55:69–102. doi: 10.1146/annurev.bi.55.070186.000441. [DOI] [PubMed] [Google Scholar]
- Nicolson C, Kraig RP. The behavior of extracellular ions during spreading depression. In: Zeuthen T, editor. The Application of Ion-Selective Microelectrodes. Amsterdam: Elsevier/North-Holland; 1981. pp. 217–238. [Google Scholar]
- Peterson PK, Hu S, Anderson R, Chao CC. Nitric oxide production and neurotoxicity mediated by activated microglia from human versus mouse brain. J Infect Dis. 1994;170:457–460. doi: 10.1093/infdis/170.2.457. [DOI] [PubMed] [Google Scholar]
- Petito CK, Morgello S, Felix JC, Lesser MI. The two patterns of reactive astrocytosis in postischemic brain. J Cereb Blood Flow Metab. 1990;10:850–859. doi: 10.1038/jcbfm.1990.141. [DOI] [PubMed] [Google Scholar]
- Ransom B, Kettenmann H, editors. Neuroglial Cells. New York: Oxford Press; 1995. [Google Scholar]
- Rao NA, Patchett R, Fernandez MA, Sevanian A, Kunkel SL, Marak GE. Treatment of experimental granulomatous uveitis by lipoxygenase and cyclo-oxygenase inhibitors. Arch Ophthalmol. 1987;105:413–415. doi: 10.1001/archopht.1987.01060030133043. [DOI] [PubMed] [Google Scholar]
- Reis DJ, Benno RH, Tucker LW, Joh TH. Quantitative immunocytochemistry of tyrosine hydroxylase in brain. In: Chan-Palay V, Palay SL, editors. Cytochemical Methods in Neuroanatomony. New York: Alan R. Liss, Inc; 1982. pp. 205–228. [Google Scholar]
- Salvemini D, Misko TP, Masferrer JL, Seibert K, Currie MG, Needleman P. Nitric oxide activates cylcooxygenase enzymes. Proc Natl Acad Sci USA. 1993;90:7240–7244. doi: 10.1073/pnas.90.15.7240. [DOI] [PMC free article] [PubMed] [Google Scholar]
- Samochocki M, Strosznajder J. Regulation of arachidonic acid release be enzyme (s) of rat brain cortex. Acta Biochem Pol. 1989;37:93–97. [PubMed] [Google Scholar]
- Scheinman RI, Cogswell PC, Lofquist AK, Baldwin AS., Jr Role of transcriptional activation of IκBα in mediation of immunosuppression by glucocorticoids. Science. 1985;270:283–286. doi: 10.1126/science.270.5234.283. [DOI] [PubMed] [Google Scholar]
- Snyder SH. Nitric oxide: More jobs for that molecule. Nature. 1994;372:504–505. doi: 10.1038/372504a0. [DOI] [PubMed] [Google Scholar]
- Stadler J, Harbrecht BG, Di Silvio M, Curran RD, Jordan ML, Simmons RL, Billiar TR. Endogenous nitric oxide inhibits the synthesis of cyclooxygenase products and interleukin-6 by rat Kupffer cells. J Leukoc Biol. 1993;53:165–172. doi: 10.1002/jlb.53.2.165. [DOI] [PubMed] [Google Scholar]
- Stephenson DT, Manetta JV, White DL, Chiou XG, Cox L, Gitter B, May PC, Sharp JD, Kramer RM, Clemens JA. Calcium-sensitive cytosolic phospholipase A2 (cPLA2) is expressed in human brain astrocytes. Brain Res. 1994;637:97–105. doi: 10.1016/0006-8993(94)91221-1. [DOI] [PubMed] [Google Scholar]
- Supko DE, Johnston MV. Dexamethasone potentiates NMDA receptor-mediated neuronal injury in the postnatal rat. Eur J Pharmacol. 1994;270:105–113. doi: 10.1016/0926-6917(94)90086-8. [DOI] [PubMed] [Google Scholar]
- Suzuki M, Li J, Asakura T, Arai K. Opposing effects of indomethacin and nordiydroguaiaretic acid on macrophage function and tumor growth. Jpn J Cancer Res. 1994;85:306–314. doi: 10.1111/j.1349-7006.1994.tb02098.x. [DOI] [PMC free article] [PubMed] [Google Scholar]
- Ting P. Indomethacin attenuates early postischemic vasogenic edema and cerebral injury. Adv Neurol. 1990;52:119–126. [PubMed] [Google Scholar]
- Torda T, Yamaguchi I, Hirata F, Kopin IJ, Axelrod J. Mepacrine treatment prevents immobilization-induced desensitization of beta-adrenergic receptors in rat hypothalamus and brain stem. Brain Res. 1981;205:441–444. doi: 10.1016/0006-8993(81)90358-9. [DOI] [PubMed] [Google Scholar]
- Vincent SR. Nitric oxide: A radical neurotransmitter in the central nervous system. Prog Neurobiol. 1994;42:129–160. doi: 10.1016/0301-0082(94)90023-x. [DOI] [PubMed] [Google Scholar]
- Zhang F, White JG, Iadecola C. Nitric oxide donors increase blood flow and reduce brain damage in focal ischemia: Evidence that nitric oxide is beneficial in the early stages of cerebral ischemia. J Cereb Blood Flow Metab. 1994;14:217–226. doi: 10.1038/jcbfm.1994.28. [DOI] [PubMed] [Google Scholar]


