

SUMMARY
In the few days prior to eye-opening in mice, the excitatory drive underlying waves switches from cholinergic to glutamatergic. Here, we describe the unique synaptic and spatiotemporal properties of waves generated by the retina’s glutamatergic circuits. First, knockout mice lacking vesicular glutamate transporter type 1 do not have glutamatergic waves, but continue to exhibit cholinergic waves, demonstrating for the first time that the two wave generating circuits are linked. Second, simultaneous outside-out patch and whole-cell recordings reveal that retinal waves are accompanied by transient increases in extrasynaptic glutamate, directly demonstrating the existence of glutamate spillover during waves. Third, the initiation rate and propagation speed of retinal waves, as assayed by calcium imaging, are sensitive to pharmacological manipulations of spillover and inhibition, demonstrating a role for both signaling pathways in shaping the spatiotemporal properties of glutamatergic retinal waves.
Keywords: bolus loading, calcium imaging, TBOA, retinal ganglion cell, bipolar cell, development
INTRODUCTION
Spontaneous activity in developing circuits plays a multitude of important roles. For example, in the developing visual system spontaneous activity in the retina is critical for neuronal survival (Goldberg et al., 2002), neuronal path finding (Nicol et al., 2007), and in the refinement and maintenance of visual maps (for reviews, see Huberman et al., 2008; Torborg and Feller, 2005; Wong, 1999). Indeed, similar functions have been assigned to spontaneous activity in the cochlea (Tritsch et al., 2007), spinal cord (Gonzalez-Islas and Wenner, 2006; Hanson et al., 2008), hippocampus and cortex (Leinekugel, 2003; Mohajerani and Cherubini, 2006), indicating that spontaneous activity may represent a general strategy used by the developing nervous system to assemble neural circuits (Feller, 1999).
We study this phenomenon in the developing retina, which exhibits propagating bursts of action potentials termed retinal waves. Retinal waves persist in a period of development during which the retina is rapidly maturing (Morgan and Wong, 2006; Sernagor et al., 2001). These changes in retinal circuitry are reflected by changes in the mechanisms that mediate waves, which have been divided into three stages (for review, see Torborg and Feller, 2005). Stage I retinal waves (embryonic day 16 – postnatal day 0 [P0] in mice) are blocked by gap junction blockers but are only weakly affected by antagonists to fast neurotransmitter receptors. Stage II waves (P0-P10) are blocked by nicotinic acetylcholine receptor (nAChR) antagonists. Stage III waves (P10-P14) are blocked by ionotropic glutamate receptor antagonists and not nAChR antagonists. The transition from Stage II to Stage III waves occurs when bipolar cell axons begin to make synapses within the inner plexiform layer (Fisher, 1979; Morgan et al., 2008) and light responses are first detected (Demas et al., 2003; Tian and Copenhagen, 2003).
The mechanisms underlying Stage II waves and their role in visual system development have been well characterized (Huberman et al., 2008; Torborg and Feller, 2005). However, there is little understanding of Stage III waves. Recently, it has been proposed that glutamate acting outside of the synaptic cleft provides a source of depolarization before mature synaptic structures are established (Demarque et al., 2002). There is also evidence that glutamate spillover, in which glutamate spills out of the synaptic cleft and activates extrasynaptic glutamate receptors, plays a role in circuit development. Spillover in hippocampus has been detected as early as P14, with a developmental reduction in glutamate spillover correlated with an increase in the expression of glutamate transporters (Diamond, 2005), and may be critical for activation of “silent synapses” (Balland et al., 2008). In developing neocortex (Demarque et al., 2004; Milh et al., 2007), hippocampus (Cattani et al., 2007) and brainstem (Sharifullina and Nistri, 2006) blockade of glutamate transporters profoundly alters spontaneous firing patterns, indicating that regulation of spillover has implications for network function. Furthermore, ambient levels of extracellular glutamate regulate spontaneous activity in perinatal neocortex (Allene et al., 2008).
Here, we describe several experiments that provide key insights into the mechanisms underlying glutamatergic Stage III waves. First, we use a knockout mouse lacking glutamate release from bipolar cells to demonstrate that the maturation of glutamate signaling is required for the cessation of cholinergic Stage II waves. Second, we use glutamate receptor-containing outside-out patches to establish that Stage III waves induce spontaneous increases in glutamate spillover. Third, we use calcium imaging to determine how manipulating glutamate spillover and inhibition alters the spatiotemporal properties of waves.
RESULTS
RGCs receive excitatory and inhibitory input during waves
Throughout this study we use synaptic inputs onto RGCs to monitor retinal waves. Therefore it is critical to establish the correspondence between synaptic inputs and network activation. We performed simultaneous current and voltage clamp recordings from neighboring RGCs while monitoring spontaneous calcium increases in the region around these cells (Fig. 1A,B). Because bath-loading of calcium indicators is significantly less effective in mouse retinas older than P4 (Bansal et al., 2000) we used the multicell bolus loading method to label cells in the RGC layer of P10-P13 mouse retinas with Oregon Green BAPTA-1-AM (Ohki et al., 2005; Stosiek et al., 2003). Simultaneous calcium imaging, whole-cell voltage clamp (Vhold=−60 mV) and current clamp recordings revealed that correlated increases in calcium indicative of retinal waves were concurrent with RGCs firing bursts of action potentials and receiving excitatory input (Fig. 1B,C). Retinal waves were always accompanied by compound excitatory synaptic currents (cEPSCs) in RGCs (n=6 cells in 6 retinas). Hence, Stage III waves represent waves of depolarization in RGCs that are driven by synaptic input, and cEPSCs reliably indicate the presence of retinal waves.
Figure 1. Simultaneous calcium imaging and whole-cell recording show compound excitatory and inhibitory synaptic inputs are correlated with retinal waves.

(A) Fluorescence image of retinal ganglion cell layer loaded with the calcium indicator OGB-1 AM using the multicell bolus loading technique. Pseudocolor overlay represents the fractional change in fluorescence over baseline (ΔF/F) in a single frame at the peak of a retinal wave (frame taken from the wave marked by an asterisk in B). Black triangles represent whole-cell patch clamp electrodes. Scale bar: 15 μm
(B) Simultaneous calcium imaging (top), whole-cell current (middle) and voltage (bottom, Vm = −60mV) clamp traces recorded over 3 min. Time course of ΔF/F is averaged over the entire field of view. Vertical scale: 4% ΔF/F, 25mV, 100pA; Horizontal scale: 30 s.
(C) Simultaneous calcium imaging (top), whole-cell current (middle) and voltage (bottom, Vm = −60 mV) clamp traces recorded during the wave in the boxed region of B. Dots on calcium imaging trace represent the average fluorescence intensity at each time point, with no filtering. Vertical scale: 2% ΔF/F, 20mV, 70pA; Horizontal scale: 2 s.
(D) Left, whole-cell voltage clamp recordings from two neighboring RGCs reveal that RGCs receive both excitatory (−60 mV, top) and inhibitory (0 mV, bottom) compound synaptic inputs (cEPSCs and cIPSCs) during retinal waves. Recording is 3 min long.
Right, Whole-cell voltage clamp recordings from the same pair as in left panel, in the presence of 20 μM DNQX and 50 μM AP5. Recording is 3 min long. Numbered boxes represent events expanded in F. Vertical scale bar: 100 pA for top trace, 500 pA for bottom trace; Horizontal scale bar: 30 s.
(E) Dual whole-cell voltage clamp recording of wave-associated cEPSCs (top; Vm = −60 mV) and cIPSCs (bottom; Vm = 0mV) in control (left), in 4 μM strychnine (middle), and in the presence of 5 μM gabazine and 4 μM strychnine (right). Recordings in each condition are 2.5 minutes long. Vertical scale bar: 200 pA; Horizontal scale bar: 20 s.
(F) Expanded timescale of the boxed areas in D. Top: −60 mV; Bottom: 0 mV. Small currents in top trace of (3) are unclamped IPSCs. Scale bar for (1) and (2): Vertical: 50 pA for top traces, 250 pA for bottom traces; Horizontal: 1 s. Scale bar for (3): Vertical: 20 pA for top trace, 100 pA for bottom trace; Horizontal: 125 ms
(G) Histogram of intervals between peaks of wave-associated cEPSCs. Bin size is 2 s. n = 2,654 intervals from 46 cells.
What inputs do RGCs receive during retinal waves? Simultaneously monitoring excitatory currents in one RGC (Vhold = −60 mV) and inhibitory currents in another (Vhold = 0 mV) revealed that RGCs receive both excitatory and inhibitory synaptic inputs during retinal waves (Fig. 1D). Wave-associated cEPSCs were blocked by a combination of the AMPA/Kainate receptor antagonist DNQX (20–50 μM) and the NMDA receptor antagonist AP5 (50 μM, n=6 pairs; Fig. 1D), suggesting that during retinal waves RGCs receive direct excitatory inputs from bipolar cells, which are the primary glutamatergic input to RGCs (Bansal et al., 2000; Demas et al., 2006; Syed et al., 2004; Wong et al., 2000). Wave-associated inhibitory synaptic currents (cIPSCs) were also blocked by DNQX and AP5, indicating that RGCs receive feedforward inhibition from amacrine cells during retinal waves.
The GABAA antagonist gabazine (5 μM) and the glycine antagonist strychnine (4 μM) together (n=11), but neither alone (n=6 cells in gabazine, n=5 cells in strychnine), blocked all cIPSCs recorded from RGCs, establishing that RGCs receive both GABAergic and glycinergic inputs during waves (Fig. 1E).
In the recordings of the excitatory synaptic inputs RGCs receive during retinal waves, we observed that some cEPSCs and cIPSCs occurred in clusters (Fig. 1F), which is visible in a histogram of inter-cEPSC intervals (Fig. 1G).
Transition between Stage II and Stage III waves requires VGLUT1 but not VGLUT3
Stage III waves are blocked by ionotropic glutamate receptor antagonists, but the source of glutamate is not known. In the adult retina, bipolar cells are the primary source of glutamatergic inputs to RGCs, but there is a class of amacrine cells which express vesicular glutamate transporter 3 (VGLUT3) on their synaptic vesicles and form synapses onto RGCs (Haverkamp and Wassle, 2004; Johnson et al., 2004). Bipolar cells express only VGLUT1 (Fremeau et al., 2004; Wassle et al., 2006). (Photoreceptors also express VGLUT1, however they are not thought to contribute to Stage III waves since our experiments are carried out in bright light, which hyperpolarizes photoreceptors.) To determine which cell supplies the glutamate required for Stage III waves, we examined mice lacking either VGLUT1 or VGLUT3.
We monitored retinal waves by recording wave-associated synaptic currents from pairs of RGCs in P10 – P12 VGLUT1 −/− mice and in age-matched littermate VGLUT1 +/− controls (Fig. 2A,C). In VGLUT1 +/− retinas, as in wild type retinas, wave-associated synaptic currents were blocked by a combination of either DNQX (20 μM) or NBQX (20 μM) and AP5 (50 μM, n=10 cells in 5 mice), whereas wave-associated synaptic currents were not blocked by DHβE, a nicotinic acetylcholine receptor antagonist (8 μM, n=11 cells in 5 mice; Fig. 2A,B). Conversely, wave-associated synaptic currents in VGLUT1 −/− retinas were not blocked by DNQX or NBQX and AP5 (n=13 cells in 4 mice), but were instead blocked by DHβE (n=12 cells in 4 mice; Fig. 2C,D), demonstrating that VGLUT1−/− mice do not have Stage III glutamatergic waves but rather have maintained Stage II cholinergic waves. These results indicate that 1) Stage III waves require glutamate release from bipolar cells or photoreceptors and that 2) glutamatergic signaling is necessary for the cessation of Stage II waves.
Figure 2. VGLUT 1 −/− mice lack Stage III glutamate retinal waves but exhibit extended Stage II cholinergic waves.

(A) Dual whole-cell voltage clamp recordings from neighboring RGCs in a P11 VGLUT 1 +/− retina. Wave-associated cEPSCs (top, Vm = −60 mV) and cIPSCs (bottom, Vm = 0 mV) are shown in control (left), in the presence of the glutamate receptor antagonists DNQX (20 μM) or NBQX (20 μM) and D-AP5 (50 μM, middle), and in the presence of the nicotinic acetylcholine receptor antagonist DHβE (8 μM, right). Recordings are 3 min long. n=10 cells in 5 mice for XXQX and AP5, n=11 cells in 5 mice for DHβE. XXQX = DNQX or NBQX. Vertical scale bar: 100 pA for top traces, 200 pA for bottom traces; Horizontal scale bar: 20 s.
(B) Effects of ionotropic glutamate and nicotinic acetylcholine receptor antagonists on frequency of cEPSC clusters in VGLUT1 +/−. Bars are mean±SD, lines are individual cells.
(C) Same experiment as in A in a P12 VGLUT1 −/− retina. Recordings are 3 min long. n=13 cells in 4 mice for XXQX and AP5, n=12 cells in 4 mice for DHβE. XXQX = DNQX or NBQX. Vertical scale bar: 100 pA for top traces, 200 pA for bottom traces; Horizontal scale bar: 20 s.
(D) Effects of ionotropic glutamate and nicotinic acetylcholine receptor antagonists on frequency of cEPSC clusters in VGLUT1 −/−. Bars are mean±SD, lines are individual cells.
In contrast to VGLUT1 −/− RGCs, all compound PSCs were blocked by DNQX and AP5 in both VGLUT3 +/− (n=8 cells in 4 mice) and VGLUT3 −/− RGCs (n=6 cells in 4 mice; data not shown). Hence, we conclude that glutamate release from VGLUT3-positive amacrine cells is not required for Stage III retinal waves and that bipolar cells are the source of glutamatergic currents recorded in RGCs during Stage III waves (Fig. 1).
Outside-out patch recordings detect spillover during waves
Spontaneous release of glutamate from bipolar cells is necessary for the generation of Stage III waves. However, at this age glutamatergic synaptic structures (Morgan et al., 2008; Sherry et al., 2003) and transmission (Tian and Copenhagen, 2001) are not yet mature. We detected very few spontaneous synaptic events in between retinal waves (Fig. 1D), indicating that there are fewer glutamate synapses than detected in later stages of development (Tian and Copenhagen, 2001). We found that cEPSCs associated with retinal waves were extremely slow (Fig. 1D), suggestive of spillover-mediated currents (Bergles et al., 1999).
Is there glutamate spillover during retinal waves? To directly detect extrasynaptic glutamate, we used glutamate receptor-containing outside-out patches (Allen, 1997; Copenhagen and Jahr, 1989; Maeda et al., 1995), a technique that has also been used to detect extrasynaptic ACh (Hume et al., 1983; Young and Poo, 1983) and GABA (Isaacson et al., 1993). Patches of membrane excised from RGC somas in the outside-out patch configuration respond to pressure-applied glutamate, indicating that they contain sufficient numbers of glutamate receptors to detect extrasynaptic glutamate (see Experimental Procedures). To test whether there is glutamate spillover during Stage III retinal waves, we monitored extracellular glutamate in the inner plexiform layer with outside-out patches while monitoring cEPSCs in RGCs (Fig. 3). Most wave-associated cEPSCs were accompanied by glutamate currents in outside-out patches (Fig. 3; currents were present in 6/6 patches; 65±26% of cEPSCs were accompanied by patch currents). Wave-associated patch currents reversed at 0 mV, consistent with activation of glutamate receptors (Fig. 3A). These data indicate that retinal waves are accompanied by episodic increases in the amount of glutamate spillover.
Figure 3. Glutamate spillover occurs during waves.

(A) Simultaneous outside-out patch (top) and whole-cell (bottom) recordings from a single patch-RGC pair. RGC Vm = −60 mV; patch Vm = −40 mV (left), 0mV (middle) and +30 mV (right). Inset, schematic of recording configuration. Outside-out patch pipette was positioned in the IPL near the recorded RGC. Vertical scale bar: 5 pA for top left and middle traces, 25 pA for top right trace, 250 pA for bottom traces; Horizontal scale bar: 2 s.
(B) Thirty-second-long voltage clamp recording from an outside-out patch (top, Vm = −35 mV) and RGC (bottom, Vm = −60 mV) in the presence of 5 μM gabazine (GZ), 4 μM strychnine (STR) and 0 Mg2+. Vertical scale bar: 5 pA for top trace, 250 pA for bottom trace; Horizontal scale bar: 3 s.
There is a significant amount of GABA and glycine release during retinal waves (Figure 1). To ensure that GABA and glycine currents (Isaacson et al., 1993) were not contaminating our recordings we repeated these experiments while blocking GABAA and glycine receptors using solutions containing 5μM gabazine and 4μM strychnine. In addition, to increase the current through NMDA receptors, we also performed these experiments in 0 Mg2+. There was no significant increase in the percent of wave-associated cEPSCs accompanied by measurable spillover currents under these pharmacological conditions (79±6%, n=3 patches, p=.42, unpaired t test vs. control; Fig. 3B), suggesting that GABA and glycine currents do not contribute significantly to wave-associated currents in outside-out patches.
Calcium imaging reveals Stage III waves occur in clusters
We have demonstrated for the first time that Stage III waves are accompanied by robust glutamate spillover (Fig. 3). Our next goal was to assay the role of glutamate spillover in circuit function. To do so we performed a detailed characterization of Stage III wave properties by visualizing intracellular calcium concentration in many cells over several hundred microns simultaneously. This method has been used extensively to determine the spatiotemporal properties of Stage II waves but has been limited in its application to Stage III waves due to poor loading of calcium indicators at older ages (Bansal et al., 2000; Feller et al., 1997; Sernagor et al., 2000; Wong et al., 1995; Zhou and Zhao, 2000). In retinas loaded with the multicell bolus loading technique (Stosiek et al., 2003) (Fig. 1), Stage III waves induced a large change in fluorescence and therefore the time evolution and the spatial boundaries of waves were clearly distinguishable (Fig. 4A; Supplemental Movie 1).
Figure 4. Calcium imaging reveals Stage III waves occur in episodic clusters.

(A) Top Left frame is a fluorescence image showing loading of calcium indicator. Right frames are ΔF/F pseudocolor images during 3 seconds of a retinal wave.
Bottom: Left frame, the spatial extent of propagation of a single wave. Each grayscale value represents the active area in one frame, with a 4 Hz frame rate. White is the first frame in which the wave was detected, dark gray the last. Right frames are binarized wave front (white; see Supplemental Experimental Procedures) showing progression of the same wave as in the top three frames. Scale: 100 μm.
(B) Spatial extent of wave propagation of four waves marked by numbers in C. Colors are as in bottom left frame of A.
(C) Time course of the ΔF/F recorded over 120 s from the 30×30 μm region of interest in B. Waves depicted in B are numbered. The first 5 waves follow within 3–5 seconds of one another. Conversely, the last wave is not followed rapidly by other waves. Vertical scale bar: 2% ΔF/F; Horizontal scale bar: 25 s.
(D) Histogram of inter-wave intervals. Bin size is 2 s. n=22,204 IWIs from 69 retinas.
(E) Histogram of wave velocities. Bin size is 10 s. n=341 waves from 34 retinas.
First, we assayed wave initiation rates. Stage III waves were similar to Stage II waves in that they initiated at several locations across the imaged region, and over time the entire ganglion cell layer participated in waves. However, Stage III waves were different from Stage II waves in that they often occurred in episodes during which a cluster of 2–5 waves initiated rapidly in roughly the same location of the retina (Fig. 4B,C). These episodes were separated by much longer intervals, after which a distinct wave or cluster of waves initiated in a different region of the retina (Fig. 4B–D).
Second, we assayed wave propagation speed (see Supplemental Experimental Procedures and Supplemental Fig. 1), which is reflective of the coupling that underlies the sequential recruitment of bipolar cells into retinal waves. Stage III waves propagate at a mean velocity of 198 μm/s with a very large variability across retinas (standard deviation=68 μm/s, n=341 waves recorded in 34 P10-P13 retinas, Fig. 4E). This high variability indicates that the coupling mechanisms that underlie wave propagation are likely to be easily modulated by environmental factors. These velocities are comparable to those previously reported for mice (Muir-Robinson et al., 2002), rabbit (Syed et al., 2004) and ferret (Feller et al., 1997; Wong et al., 1993), and significantly lower than turtle (Sernagor and Grzywacz, 1999; Sernagor et al., 2003) and previous reports of Stage III waves in mice based on multielectrode array (MEA) recordings (Demas et al., 2003). The different measurements of Stage III wave velocities in mice obtained using calcium imaging and the multielectrode array are due to the methods used to compute velocity (see Supplemental Experimental Procedures).
Enhancing spillover alters wave frequency and speed
Traditionally, glutamate spillover is studied at the level of intercellular communication between pairs of cells. Our goal was to assay the role of glutamate spillover in the function of an entire circuit. To do so we assayed the effects of different manipulations of glutamate spillover on the spatiotemporal properties of Stage III waves.
First, we monitored the effects of enhancing glutamate spillover by blocking excitatory amino acid transporters (EAATs), which remove glutamate from the extracellular space. To characterize the effects of the non-transportable blocker of EAATs TBOA (25 μM) on glutamatergic synaptic input to RGCS and glutamate spillover we used whole-cell voltage clamp and outside-out patch recordings. The presence of TBOA increased the amount of glutamatergic activity recorded in RGCs (Fig. 5A,B), and in TBOA 73±12% of wave-associated cEPSCs were accompanied by measurable glutamate spillover, (a significant increase over control patches; 55±6% in control, n=4 patches, p=.04).
Figure 5. The effects of increased glutamate spillover on spatiotemporal properties of Stage III waves.

(A) Outside-out patch recording (top; Vm = −40 mV) and RGC whole-cell voltage clamp recording of cEPSCs in an RGC (bottom, −60 mV) in control ACSF (left) and in 25 μM TBOA (right). Dotted line represents baseline holding current before TBOA application. Recordings are 2 min long. Vertical scale bar: top, 4 pA; bottom, 100pA. Horizontal scale bar: 20 s.
(B) Cumulative histogram summarizing effects of TBOA on inter-cEPSC interval measured from whole-cell recordings. n=4 cells in control, n=3 cells in 25 μM TBOA, n=3 cells in rinse. Black is control, dotted line is TBOA.
(C) Summary of spontaneous calcium transients during three sequential ten second intervals. Gray value corresponds to the time during which that region of the retina was active. Black is baseline; white is activity at 0 s, with increasing time depicted as darker grays. If a region of the retina was active more than once, the time of the most recent activity is displayed. Top: Control. Bottom: 25 μM TBOA. Scale bar = 100 μm
(D) Time course of ΔF/F averaged over a 30 μm × 30 μm region in the center of the retina in C. Top: Control ACSF; Bottom: TBOA.
(E) Summary cumulative probability distribution of inter-wave intervals (IWIs). Black line is control, dotted line is TBOA. Shaded areas represent standard error of the mean (n=9 retinas).
(F) Summary of effects of TBOA on propagation speed. Individual dots represent single retinas; lines connect a retina’s speed in control and TBOA.
(G) TBOA-induced change in wave propagation speed plotted versus propagation speed in control. Dots represent average speed of all waves in individual retinas; error bars are standard deviation.
The presence of TBOA significantly altered the spatiotemporal properties of retinal waves as assayed by calcium imaging. Waves initiated much more frequently with very few quiescent periods between waves (Fig. 5C,D and Supplemental Movie 2). The presence of TBOA dramatically shifted the distribution of inter-wave intervals such that the vast majority of intervals were less than 10 seconds (Fig. 5E).
A second dramatic effect we observed was that TBOA reduced the variability of wave propagation speed. In contrast to the wide range of propagation speeds recorded in control retinas (Fig. 4E), waves in TBOA propagated within a significantly narrower range of velocities (mean±SD: 145±14 μm/s in TBOA vs. 173±79 μm/s in control, n = 8 retinas; t test, p=0.33; Levene’s test of variance, p=0.001; Fig. 5F). Interestingly, the effect of TBOA depended on control wave propagation speed. For retinas with waves slower than 140 microns per second TBOA significantly increased wave propagation speed (n=3, p<0.02 for each retina), for retinas with waves faster than 200 microns/sec TBOA significantly decreased wave propagation speed (n=4, p<0.02 for each retina), and for one retina with waves propagating near 150 μm/s TBOA had no effect (n=1, p=.16). Indeed, the magnitude of the TBOA-induced change in wave propagation speed was strongly correlated with the control propagation speed (linear regression r2=0.985; Fig. 5G). Furthermore, in a subset of retinas that exhibited waves of widely varying propagation speeds, TBOA reduced the variability across waves within a retina (Supplemental Fig. 2). The dramatic reduction in variability of propagation speed caused by TBOA leads to the hypothesis that variations in ambient levels of glutamate may control the spatial and temporal structure of correlations induced by retinal waves.
Are the TBOA-induced changes in wave properties due to effects of spillover on the Stage III wave-generating circuitry, or does TBOA induce waves generated by a novel mechanisms as observed in developing neocortex, hippocampus and brainstem (Cattani et al., 2007; Demarque et al., 2004; Milh et al., 2007; Sharifullina and Nistri, 2006)? If the retina contains a circuit that supports waves independent of the Stage III wave-generating circuitry, TBOA may induce waves in retinas not capable of generating Stage III waves. To test this, we performed calcium imaging while applying TBOA to retinas during Stage II waves and to adult retinas. TBOA did not induce waves in P5-P6 retinas; on the contrary, it made Stage II waves less frequent (IWI, mean±SD = 107±36 s in control, 226±49 s in TBOA, n=5 retinas, p = .01; Supplemental Fig. 3), and did not induce waves in adult retinas (n=8 P22-P24 retinas). Hence, enhancing glutamate spillover enhanced wave activity only during Stage III. Furthermore, like Stage III waves in the absence of TBOA (Fig. 6; Wong et al., 2000) but unlike TBOA-induced activity in other brain areas, wave-associated cEPSCs in TBOA were not blocked by AP5 alone (n=6/7 cells in 4 retinas) but were blocked by a combination of AP5 and DNQX (n=5/5 cells in 3 retinas). Though these data do not directly implicate glutamate spillover in wave propagation, they are consistent with the model that glutamate signaling via spillover is a component of the Stage III wave generating circuit.
Figure 6. Inter-wave interval, but not propagation speed, is affected by NMDA or AMPA/kainate receptor blockade.

(A) Progression of a wave recorded with calcium imaging during bath application of 20 μM NBQX. Each grayscale value represents the active area in one frame, with a 4 Hz frame rate. White is the first frame in which the wave was detected, dark gray the last. Black square is the 30×30 μm region from which the traces in B are derived. Scale bar = 100 μm.
(B) Time course of the ΔF/F in retinas in control (top) and during bath application of NBQX (bottom). Asterisk indicates the wave shown in A. Vertical scale bar: 5% ΔF/F; Horizontal scale bar: 50 s.
(C) Cumulative probability distribution of inter-wave intervals (IWIs). Black line is control, dotted line is NBQX. Shaded areas represent standard error of the mean.
(D) Summary of effects of NBQX on propagation speed. Individual dots represent single retinas; lines connect a retina’s speed in control and NBQX.
(E) Progression of a wave recorded with calcium imaging during bath application of 50 μM AP5. Colors are as in A. Black square is the 30×30 μm region from which the traces in F are derived. Scale bar: 100 μm.
(F) Time course of the ΔF/F in control (top) and during bath application of 50 μM AP5 (bottom). Asterisk indicates the wave shown in E. Vertical scale bar: 5% ΔF/F; Horizontal scale bar: 50 s.
(G) Cumulative probability distribution of inter-wave intervals (IWIs). Black line is control, dotted line is AP5. Shaded areas represent standard error of the mean.
(H) Summary of effects of AP5 on propagation speed. Individual dots represent single retinas; lines connect a retina’s speed in control and AP5.
As a second manipulation of glutamate spillover, we took advantage of glutamate transporters’ high sensitivity to temperature (Wadiche and Kavanaugh, 1998) by altering the temperature of the ACSF. We found a significant decrease in inter-wave intervals and increase in wave propagation speed for elevated temperatures (Supplemental Fig. 4). However, there was a significant increase in propagation speed and a shift in the IWI distribution as a function of temperature in the presence of TBOA, similar to the temperature effects observed in control solutions. Hence we cannot distinguish whether the effects of elevated temperatures on the spatiotemporal properties of waves were due to glutamate spillover or other temperature-dependent physiological processes.
Waves persist in AMPA/kainate or NMDA receptor blockade
Unfortunately, there is no unambiguous way to block glutamate spillover without also inhibiting conventional synaptic transmission. However, in many parts of the brain, glutamate spillover exerts its effects by preferentially activating NMDA receptors, which have a high affinity for glutamate and are therefore more likely to be activated by the lower concentrations of glutamate outside of the synaptic cleft (Chen and Diamond, 2002; Higgs and Lukasiewicz, 1999). In RGCs, over 90% of NMDA receptors are localized extrasynaptically while AMPA receptors, conversely, are expressed almost exclusively in synapses (Zhang and Diamond, 2006). Therefore, one way to test the role of glutamate spillover in the retinal wave-generating circuit is to block AMPA/Kainate receptors.
Bath application of NBQX, a selective AMPA/kainate receptor antagonist, did not block Stage III waves as assayed with calcium imaging (n=5, Fig. 6A,B). This demonstrates that activation of NMDA receptors provides sufficient depolarization to support retinal waves. This is consistent with previous results from calcium imaging in ferrets (Wong et al., 2000). However, these results differ from a report previous from our lab indicating that CNQX or DNQX are sufficient to block waves (Bansal et al., 2000). This difference could be due to poorer sensitivity in previous calcium imaging experiments or potential non-specificity of CNQX and DNQX.
Though waves persist in AMPA/kainate receptor antagonists, we observed a reduction in their frequency (Fig. 6C). AMPA/kainate receptor antagonists had no effect on wave propagation speed (mean±SD, 229±37μm/s in NBQX vs. 198±17 μm/sec in control, n=5, p=0.22; Fig. 6D), indicating that glutamate signaling via AMPA/kainate receptors determines the initiation rate but not the propagation speed of Stage III waves.
Next, we assayed the role of NMDA receptor activation in determining the spatiotemporal properties of Stage III waves. Similar to blockade of AMPA/kainate receptors and consistent with previous results we found that blockade of NMDA receptors by bath application of AP5 (50 μM) did not block waves or change the speed of wave propagation (205±16μm/s in AP5 vs. 193±35 in control, n=5, p=0.47, Fig. 6E,F,H), although the initiation rate was slightly shifted to higher inter-wave intervals (Fig. 6G).
These results suggest that both synaptic and extrasynaptic glutamate receptors contribute to the depolarizations during Stage III waves. However, they do not distinguish which aspects of wave propagation are mediated by synaptic vs. extrasynaptic glutamate receptor activation. First, the subcellular distribution of AMPA and NMDA receptors in the retina at this age is not known, and it may differ from adult as there is robust reorganization of glutamatergic synapses during development (Morgan et al., 2008). Second, in cerebellum glutamate spillover has been shown to activate AMPA receptors in neighboring synapses (DiGregorio et al., 2002), so an alternative interpretation is that glutamate spillover-mediated activation of both NMDA and AMPA receptors is required for wave propagation. Furthermore, during circuit development the distinction between synaptic and extrasynaptic signaling may represent a false dichotomy given the dramatic rearrangements of glutamate receptors that occur at this age (Morgan et al., 2008).
Disinhibition and enhanced spillover show similar effects
Elevating glutamate spillover increased the initiation rate of retinal waves. Previously, it was established that blocking GABAA and glycine receptors also increased the frequency of Stage III waves (Fischer et al., 1998; Kerschensteiner and Wong, 2008; Syed et al., 2004; Zhou, 2001). Application of gabazine (5 μM) and strychnine (4μM) increased the frequency of cEPSCs recorded in RGCs (Fig. 1E), indicating that GABA and glycine normally suppress glutamate release from bipolar cells. These observations lead to the hypothesis that the initiation rate of retinal waves is determined by the balance of excitation and inhibition at the level of bipolar cells. To test this hypothesis, we compared the effects of TBOA and the blockade of inhibition on the spatiotemporal properties of waves.
Waves initiated much more frequently in GABAA and glycine receptor antagonists (5 μM gabazine and 4 μM strychnine; Fig. 7A–C). As in TBOA, this rapid initiation of waves eliminated the bimodal distribution of inter-wave intervals observed in control conditions, and replaced it with a smooth distribution in which the inter-wave interval for the vast majority of waves is less than 10 seconds.
Figure 7. Effects of blocking inhibition on the spatiotemporal properties of retinal waves.

(A) Summary of spontaneous calcium transients during three sequential 10 second intervals. Gray value corresponds to the time during which that region of the retina was active. Black is baseline; white is activity at 0 s, with increasing time depicted as darker grays. If a region of the retina was active more than once, the time of the most recent activity is displayed. Top: Control. Bottom: 5 μM gabazine (GZ) and 4 μM strychnine (STR). Scale bar = 100 μm
(B) Time course of ΔF/F averaged over a 30 μm × 30 μm region in the center of the retina in A. Top: Control. Bottom: gabazine and strychnine.
(C) Summary cumulative probability distribution of inter-wave intervals (IWIs). Black line is control, dotted line is gabazine and strychnine. Shaded areas represent standard error of the mean.
(D) Effects of gabazine and strychnine on propagation speed. Individual dots represent single retinas; lines connect a retina’s speed in control and GZ + STR. n=8 retinas.
(E) GZ+STR-induced change in wave propagation speed plotted versus propagation speed in control. Dots represent average speed of all waves in individual retinas; error bars are standard deviation.
Blockade of GABAA and glycine receptors slightly reduced wavefront propagation speed (mean±SD 172±18 μm/s in GZ+STR, 199±32 μm/s in control, n=8 retinas, p=.05; Fig. 7D). Furthermore, although the change in propagation speed caused by gabazine and strychnine on a per-retina basis was correlated with the initial propagation speed (linear regression r2 = .7; Fig. 7E), gabazine and strychnine did not reduce the variability in mean wave propagation speed among retinas (Levene test, p=0.1). However, for these experiments variability in propagation speed in control retinas was lower than for the TBOA experiments and therefore direct comparisons cannot be made.
This supports the hypothesis that the depolarization state of bipolar cells, set by spillover and inhibition, is a critical determinant of initiation rate. A schematic of these functional circuits consistent with the pharmacology presented here is provided in Figure 8 and discussed below.
Figure 8. Schematic of functional circuit organization of mammalian retina during Stage III waves.
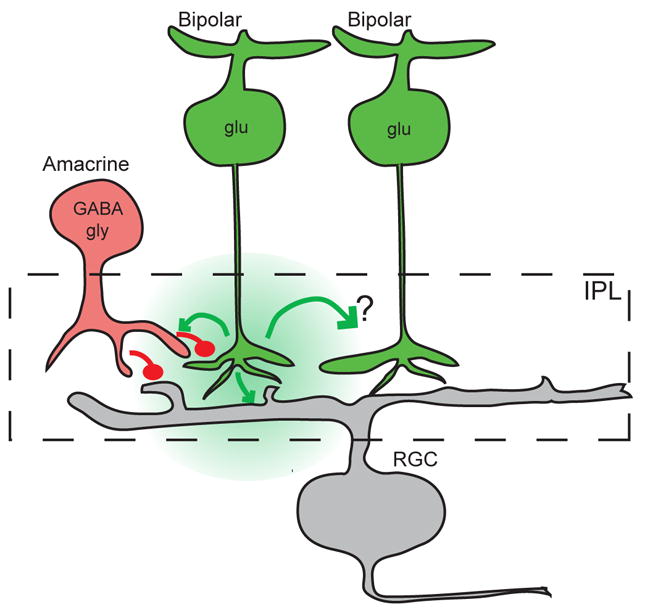
Glutamatergic (glu) bipolar cells (green) provide excitatory input (green) to RGCs (gray) and amacrine cells (red). In turn, glycinergic (gly) and GABAergic (GABA) amacrine cells (here both represented by a generic red cell) provide direct inhibition (red) to RGCs as well as inhibit release from bipolar cells. The mechanism by which glutamate spillover (green cloud) depolarizes neighboring bipolar cells is unknown.
DISCUSSION
We have explored the role of synaptic and extrasynaptic signaling in the generation of Stage III retinal waves. First, knockout mice lacking VGLUT1 did not have glutamatergic retinal waves but continued to exhibit cholinergic waves, demonstrating that glutamatergic signaling causes the disappearance of Stage II waves. Second, we provided direct evidence that glutamate spillover is a robust feature of Stage III retinal waves, demonstrating for the first time spontaneous episodic elevations in extrasynaptic glutamate in the developing retina. Third, elevating levels of glutamate spillover significantly reduced the variance in wave propagation speed, indicating that fluctuating endogenous levels of glutamate influence the propagation properties of retinal waves. In addition, wave initiation rates are reduced by blockade of either NMDA or AMPA receptors, indicating that initiation rates are influenced bidirectionally by levels of glutamate signaling. Last, blocking inhibition had similar effects on the spatiotemporal properties of waves as elevating glutamate spillover, supporting a model in which spontaneous initiation of Stage III waves is dictated by the balance of excitation and inhibition onto bipolar cells.
Role for glutamate signaling in transition from Stage II to Stage III
What role do glutamate waves play in development? Our observation that VGLUT1 −/− retinas do not have normal Stage III waves demonstrates that synaptic transmission from photoreceptors or bipolar cells is necessary for Stage III waves. Interestingly, while VGLUT1 +/−littermates have Stage III waves, VGLUT1 −/− mice have Stage II-like waves. This suggests that in wild type retinas the onset of glutamatergic signaling may turn off the Stage II wave-generating circuitry.
A similar phenomenon has been seen in a mouse lacking choline acetyl transferase (ChAT), the enzyme that synthesizes acetylcholine, in a portion of the retina (Stacy et al., 2005). During the period of development normally occupied by the cholinergic Stage II waves, ChAT-knockout retina exhibits spontaneous activity that is blocked by gap junction blockers but not by nAChR or ionotropic glutamate receptor antagonists (Stacy et al., 2005), indicating a persistence of mechanisms that mediate Stage I waves (for review, see Torborg and Feller, 2005). These findings suggest that the retina turns on a different form of spontaneous activity when one form is blocked, revealing powerful homeostatic mechanisms that ensure spontaneous activity is always present.
Role for glutamate spillover in circuit function
Glutamate spillover has been described in the adult retina (Chen and Diamond, 2002; DeVries et al., 2006; Veruki et al., 2006). A major goal of this study was to determine whether glutamate spillover exists at a stage in development when functional glutamatergic synapses are first forming. We found that retinal waves are accompanied by robust glutamate spillover by using glutamate receptor-containing outside-out patches (Fig. 3). It is possible that the presence of a recording pipette in the inner plexiform layer locally disrupts glutamate clearance, contributing to the spillover currents we see. However, glutamate spillover between pairs of bipolar cells has been measured in the adult retina, consistent with our conclusion that spillover occurs in the IPL (Veruki et al., 2006). This finding may have implications for spontaneous activity in other developing circuits that exhibit glutamate receptor-dependent spontaneous activity while glutamatergic synapses are still being formed, as in cortex (Dupont et al., 2006; Minlebaev et al., 2008) and hippocampus (Ben-Ari et al., 2004; Kasiyanov et al., 2008).
We demonstrated a role for glutamate spillover in shaping the spatiotemporal properties of retinal waves in two ways. First, altering the level of glutamate spillover altered the rate of wave initiations, i.e. the rate at which retinas entered the active state. Reducing signaling via ionotropic glutamate receptors by blocking either AMPA/kainate or NMDA receptors reduced the frequency of wave initiations (Fig. 6), while increasing glutamate spillover by blocking glutamate transporters dramatically increased the frequency of wave initiations (Fig. 5). A similar increase in wave initiations was observed when inhibition was blocked (Fig. 7 and Fischer et al., 1998; Kerschensteiner and Wong, 2008; Syed et al., 2004; Zhou, 2001).
Second, altering the level of glutamate spillover affected wavefront propagation speed. Wavefront propagation is a measure of the rate at which bipolar cells are recruited into waves. In control conditions, Stage III waves propagate with a highly variable wavefront propagation speed. Though wavefront propagation varied across waves within a retina (Supplemental Fig. 2), it varied most significantly across preparations, with a few retinas supporting very rapid waves with propagation speeds greater than 250 μm/s (Fig. 4D, Supplemental Fig. 1). Surprisingly, TBOA reduced the variability in propagation speed by causing all waves to propagate at speeds near 150 μm/s (Fig. 5, Supplemental Fig. 2).
Based on this observation, we propose that glutamate activates two distinct processes: one that positively regulates wave speed, such as activation of ionotropic glutamate receptors, and one that negatively regulates it, such as activation of presynaptic mGluRs. In this scenario variation in propagation speed from retina to retina may have to do with varying ambient levels of glutamate, perhaps due to variations in the effectiveness of transporters. In TBOA, there is maximum activation of both positive and negative regulators of wave speed and therefore there is less variation across retinas.
We propose a model that is consistent with these experimental observations (Figure 8). Stage III waves are initiated by spontaneous depolarizations in bipolar cells, and coupled to surrounding bipolar cells via spillover. In this way, bipolar cells function in a manner similar to starburst amacrine cells during the cholinergic stage II waves. The strong depolarization provided by a wave also excites inhibitory circuits, which contribute to the delay between waves. Hence, the balance of excitation and inhibition onto bipolar cells sets the initiation rate. The question remains – how does spillover couple bipolar cells when its function in the adult retina is to inhibit release from neighboring bipolar cells? More experiments are required to determine whether glutamate release from one bipolar cell directly depolarizes its neighbor during development via conductances that are not described in adult or whether there is an intermediate excitatory cell.
In summary, we have demonstrated that an absence of glutamate signaling prevents the transition from Stage II to Stage III waves. In addition, there is robust inhibitory signaling and glutamate spillover during Stage III waves, both of which shape the spatiotemporal properties of waves. These findings represent key insights into the features of transient circuits that mediate spontaneous activity during development.
EXPERIMENTAL PROCEDURES
Animals
C57Bl/6 mice obtained from Harlan were used for all WT recordings. VGLUT1 knockout mice (Fremeau et al., 2004) and VLGUT3 knockout mice (Seal et al., 2008) were generated as reported previously. Heterozygous littermates were used as controls for experiments using VGLUT1- and VGLUT3-null mice. All animal procedures were approved by the University of California, Berkeley; University of California, San Diego; or University of California, San Francisco Institutional Animal Care and Use Committees and conformed to the National Institutes of Health Guide for the Care and Use of Laboratory Animals, the Public Health Service Policy, and the Society for Neuroscience Policy on the Use of Animals in Neuroscience Research.
Whole-Mount Retinal Preparation
P10 – P24 mice were anesthetized with halothane or isoflurane and decapitated. Retinas were isolated in artificial cerebrospinal fluid (ACSF) (in mM: 119.0 NaCl, 26.2 NaHCO3, 11 glucose, 2.5 KCl, 1.0 K2HPO4, 2.5 CaCl2, 1.3 MgCl2) and mounted RGC side up on filter paper. Retinas were incubated at room temperature in bubbled (95% O2/5% CO2) ACSF until transfer to the recording chamber, where they were constantly superfused with bubbled ACSF (32–34°C unless otherwise specified).
Electrophysiology and Pharmacology
Whole-cell current and voltage clamp recordings were made from whole-mount retinas. Retinas were visualized with differential interference contrast optics on a Zeiss Axioskop 2 FS Plus microscope with an Achroplan 40x water immersion objective. The inner limiting membrane of the retina was removed with a glass recording pipette and RGCs were targeted under control of a micromanipulator (MP-225; Sutter Instruments). RGCs were identified by their large somas and the presence of a voltage-gated sodium conductance. Recording pipettes (Garner Glass or Sutter Instruments) were pulled (PP-830; Narishige) with a tip resistance of 3–6 MΩ and filled with either a cesium gluconate (for all voltage-clamp recordings; in mM: 100 CsOH, 100 gluconic acid, 1.7 CsCl, 40 HEPES, 10 EGTA, 5 MgCl2, 1 QX-314, 2 Na2ATP, and 0.3 Na-GTP; pH adjusted to 7.25 with CsOH; ECl = −60 mV) or potassium gluconate internal solution (for current-clamp recordings; in mM: 98.3 K-gluconate, 40 HEPES, 1.7 KCl, 0.6 EGTA, 5 MgCl2, 2 Na2ATP, and 0.3 Na-GTP; pH adjusted to 7.25 with KOH). Data were acquired using pCLAMP 9 recording software and a Multiclamp 700A amplifier (Molecular Devices), sampled at 5 kHz and low-pass filtered at 1 kHz. 6,7-Dinitroquinoxaline-2,3-dione disodium salt (DNQX), D-(−)-2-Amino-5-phosphonopentanoic acid (AP5), 2,3-Dioxo-6-nitro-1,2,3,4-tetrahydrobenzo [f]quinoxaline-7-sulfonamide disodium salt (NBQX), SR-95531 hydrobromide (gabazine), strychnine, and Dihydro-β-erythroidine hydrobromide (DHβE) were added to ACSF as stock solutions prepared at ≥1000x concentration in water. DL-threo-b-Benzyloxyaspartic acid (TBOA) stock solution was prepared at 1000x in dimethyl sulfoxide. All antagonists were acquired from Tocris; all other chemicals were acquired from Sigma-Aldrich. Data were analyzed in pCLAMP, IGOR Pro (Wavemetrics Inc.) or MATLAB (Mathworks).
To calculate inter-cEPSC intervals in whole-cell voltage clamp recordings, cEPSCs were identified by eye. For Figure 2, a cluster was defined as a series of cEPSCs separated by not more than 10 s.
Outside-out patches were excised from RGC somas > 500 μm away from the simultaneously recorded RGC. Cesium gluconate was used for outside-out patch recordings. To confirm that patches contained glutamate receptors, L-glutamate was pressure-applied (5 psi) to patches at a concentration of 1mM in a solution containing (in mM): 150 NaCl, 2.5 KCl, 10 Hepes, pH 7.4. Patches were inserted to a depth of 10 μm in the inner plexiform layer, within 10 μm of the recorded RGC’s soma. All patch traces included were low-pass filtered (Bessel, 8-pole) at 150 Hz for clarity.
Calcium Imaging
Retinas were bulk loaded with the calcium indicator Oregon Green 488 BAPTA-1 AM (OGB-1 AM; Invitrogen) using the multicell bolous loading technique (Stosiek et al., 2003). OGB-1 AM was prepared at a concentration of 10mM in a solution of 2% pluronic in DMSO, which was then diluted 1/10 in a solution containing (in mM): 150 NaCl, 2.5 KCl, 10 Hepes, pH 7.4 (Stosiek et al., 2003). The OGB-1 AM solution was pressure ejected from a borosilicate glass micropipette (Garner Glass or Sutter Instruments) using a PV-820 Pneumatic PicoPump (World Precision Instruments) at a pressure of 10 – 20 psi. The pipette was positioned just under the inner limiting membrane and dye was injected for 700 ms in 3–5 locations per retina. Epifluorescent calcium imaging was performed on a Zeiss Axioskop 2 FS Plus microscope using a 10x or 40x water immersion objective (Zeiss Achroplan), with illumination provided by a Sutter Lambda LS and controlled by a Uniblitz shutter. Images were acquired at 2–4 Hz in MetaMorph (Universal Imaging Corporation).
Statistics
Paired t-tests were used for all paired comparisons. For multiple comparisons, a repeated measures ANOVA with a Newman-Keuls post hoc test was used. Levene’s test was used to compare variances. Alpha was always 0.05.
Supplementary Material
Acknowledgments
Support contributed by NIH Grants RO1EY013528 (MF), F31NS058167 (AB), EY01869 & NS016033 (DC), NSF Grant IOS-0818983 (MF), Research to Prevent Blindness (DC), That Man May See (DC), NIH (JJ), and Knights Templar Eye Foundation (JJ). We thank Dr. J. Isaacson for suggestions on the design of the experiments and for commenting on previous versions of the manuscript. We also thank Will Barkis for adapting the multicell bolus loading technique to developing retinal tissue.
Footnotes
Publisher's Disclaimer: This is a PDF file of an unedited manuscript that has been accepted for publication. As a service to our customers we are providing this early version of the manuscript. The manuscript will undergo copyediting, typesetting, and review of the resulting proof before it is published in its final citable form. Please note that during the production process errors may be discovered which could affect the content, and all legal disclaimers that apply to the journal pertain.
References
- Allen TG. The ‘sniffer-patch’ technique for detection of neurotransmitter release. Trends Neurosci. 1997;20:192–197. doi: 10.1016/s0166-2236(96)01039-9. [DOI] [PubMed] [Google Scholar]
- Allene C, Cattani A, Ackman JB, Bonifazi P, Aniksztejn L, Ben-Ari Y, Cossart R. Sequential generation of two distinct synapse-driven network patterns in developing neocortex. J Neurosci. 2008;28:12851–12863. doi: 10.1523/JNEUROSCI.3733-08.2008. [DOI] [PMC free article] [PubMed] [Google Scholar]
- Balland B, Lachamp P, Kessler JP, Tell F. Silent synapses in developing rat nucleus tractus solitarii have AMPA receptors. J Neurosci. 2008;28:4624–4634. doi: 10.1523/JNEUROSCI.5355-07.2008. [DOI] [PMC free article] [PubMed] [Google Scholar]
- Bansal A, Singer JH, Hwang BJ, Xu W, Beaudet A, Feller MB. Mice lacking specific nicotinic acetylcholine receptor subunits exhibit dramatically altered spontaneous activity patterns and reveal a limited role for retinal waves in forming ON and OFF circuits in the inner retina. J Neurosci. 2000;20:7672–7681. doi: 10.1523/JNEUROSCI.20-20-07672.2000. [DOI] [PMC free article] [PubMed] [Google Scholar]
- Ben-Ari Y, Khalilov I, Represa A, Gozlan H. Interneurons set the tune of developing networks. Trends Neurosci. 2004;27:422–427. doi: 10.1016/j.tins.2004.05.002. [DOI] [PubMed] [Google Scholar]
- Bergles DE, Diamond JS, Jahr CE. Clearance of glutamate inside the synapse and beyond. Curr Opin Neurobiol. 1999;9:293–298. doi: 10.1016/s0959-4388(99)80043-9. [DOI] [PubMed] [Google Scholar]
- Cattani AA, Bonfardin VD, Represa A, Ben-Ari Y, Aniksztejn L. Generation of slow network oscillations in the developing rat hippocampus after blockade of glutamate uptake. J Neurophysiol. 2007;98:2324–2336. doi: 10.1152/jn.00378.2007. [DOI] [PubMed] [Google Scholar]
- Chen S, Diamond JS. Synaptically released glutamate activates extrasynaptic NMDA receptors on cells in the ganglion cell layer of rat retina. J Neurosci. 2002;22:2165–2173. doi: 10.1523/JNEUROSCI.22-06-02165.2002. [DOI] [PMC free article] [PubMed] [Google Scholar]
- Copenhagen DR, Jahr CE. Release of endogenous excitatory amino acids from turtle photoreceptors. Nature. 1989;341:536–539. doi: 10.1038/341536a0. [DOI] [PubMed] [Google Scholar]
- Demarque M, Represa A, Becq H, Khalilov I, Ben-Ari Y, Aniksztejn L. Paracrine intercellular communication by a Ca2+- and SNARE-independent release of GABA and glutamate prior to synapse formation. Neuron. 2002;36:1051–1061. doi: 10.1016/s0896-6273(02)01053-x. [DOI] [PubMed] [Google Scholar]
- Demarque M, Villeneuve N, Manent JB, Becq H, Represa A, Ben-Ari Y, Aniksztejn L. Glutamate transporters prevent the generation of seizures in the developing rat neocortex. J Neurosci. 2004;24:3289–3294. doi: 10.1523/JNEUROSCI.5338-03.2004. [DOI] [PMC free article] [PubMed] [Google Scholar]
- Demas J, Eglen SJ, Wong RO. Developmental loss of synchronous spontaneous activity in the mouse retina is independent of visual experience. J Neurosci. 2003;23:2851–2860. doi: 10.1523/JNEUROSCI.23-07-02851.2003. [DOI] [PMC free article] [PubMed] [Google Scholar]
- Demas J, Sagdullaev BT, Green E, Jaubert-Miazza L, McCall MA, Gregg RG, Wong RO, Guido W. Failure to maintain eye-specific segregation in nob, a mutant with abnormally patterned retinal activity. Neuron. 2006;50:247–259. doi: 10.1016/j.neuron.2006.03.033. [DOI] [PubMed] [Google Scholar]
- DeVries SH, Li W, Saszik S. Parallel processing in two transmitter microenvironments at the cone photoreceptor synapse. Neuron. 2006;50:735–748. doi: 10.1016/j.neuron.2006.04.034. [DOI] [PubMed] [Google Scholar]
- Diamond JS. Deriving the glutamate clearance time course from transporter currents in CA1 hippocampal astrocytes: transmitter uptake gets faster during development. J Neurosci. 2005;25:2906–2916. doi: 10.1523/JNEUROSCI.5125-04.2005. [DOI] [PMC free article] [PubMed] [Google Scholar]
- DiGregorio DA, Nusser Z, Silver RA. Spillover of glutamate onto synaptic AMPA receptors enhances fast transmission at a cerebellar synapse. Neuron. 2002;35:521–533. doi: 10.1016/s0896-6273(02)00787-0. [DOI] [PubMed] [Google Scholar]
- Dupont E, Hanganu IL, Kilb W, Hirsch S, Luhmann HJ. Rapid developmental switch in the mechanisms driving early cortical columnar networks. Nature. 2006;439:79–83. doi: 10.1038/nature04264. [DOI] [PubMed] [Google Scholar]
- Feller MB. Spontaneous correlated activity in developing neural circuits. Neuron. 1999;22:653–656. doi: 10.1016/s0896-6273(00)80724-2. [DOI] [PubMed] [Google Scholar]
- Feller MB, Butts DA, Aaron HL, Rokhsar DS, Shatz CJ. Dynamic processes shape spatiotemporal properties of retinal waves. Neuron. 1997;19:293–306. doi: 10.1016/s0896-6273(00)80940-x. [DOI] [PubMed] [Google Scholar]
- Fischer KF, Lukasiewicz PD, Wong RO. Age-dependent and cell class-specific modulation of retinal ganglion cell bursting activity by GABA. J Neurosci. 1998;18:3767–3778. doi: 10.1523/JNEUROSCI.18-10-03767.1998. [DOI] [PMC free article] [PubMed] [Google Scholar]
- Fisher LJ. Development of synaptic arrays in the inner plexiform layer of neonatal mouse retina. J Comp Neurol. 1979;187:359–372. doi: 10.1002/cne.901870207. [DOI] [PubMed] [Google Scholar]
- Fremeau RT, Jr, Kam K, Qureshi T, Johnson J, Copenhagen DR, Storm-Mathisen J, Chaudhry FA, Nicoll RA, Edwards RH. Vesicular glutamate transporters 1 and 2 target to functionally distinct synaptic release sites. Science. 2004;304:1815–1819. doi: 10.1126/science.1097468. [DOI] [PubMed] [Google Scholar]
- Goldberg JL, Espinosa JS, Xu Y, Davidson N, Kovacs GT, Barres BA. Retinal ganglion cells do not extend axons by default: promotion by neurotrophic signaling and electrical activity. Neuron. 2002;33:689–702. doi: 10.1016/s0896-6273(02)00602-5. [DOI] [PubMed] [Google Scholar]
- Gonzalez-Islas C, Wenner P. Spontaneous network activity in the embryonic spinal cord regulates AMPAergic and GABAergic synaptic strength. Neuron. 2006;49:563–575. doi: 10.1016/j.neuron.2006.01.017. [DOI] [PubMed] [Google Scholar]
- Hanson MG, Milner LD, Landmesser LT. Spontaneous rhythmic activity in early chick spinal cord influences distinct motor axon pathfinding decisions. Brain Res Rev. 2008;57:77–85. doi: 10.1016/j.brainresrev.2007.06.021. [DOI] [PMC free article] [PubMed] [Google Scholar]
- Haverkamp S, Wassle H. Characterization of an amacrine cell type of the mammalian retina immunoreactive for vesicular glutamate transporter 3. J Comp Neurol. 2004;468:251–263. doi: 10.1002/cne.10962. [DOI] [PubMed] [Google Scholar]
- Higgs MH, Lukasiewicz PD. Glutamate uptake limits synaptic excitation of retinal ganglion cells. J Neurosci. 1999;19:3691–3700. doi: 10.1523/JNEUROSCI.19-10-03691.1999. [DOI] [PMC free article] [PubMed] [Google Scholar]
- Huberman AD, Feller MB, Chapman B. Mechanisms Underlying Development of Visual Maps and Receptive Fields. Annu Rev Neurosci. 2008;31:479–509. doi: 10.1146/annurev.neuro.31.060407.125533. [DOI] [PMC free article] [PubMed] [Google Scholar]
- Hume RI, Role LW, Fischbach GD. Acetylcholine release from growth cones detected with patches of acetylcholine receptor-rich membranes. Nature. 1983;305:632–634. doi: 10.1038/305632a0. [DOI] [PubMed] [Google Scholar]
- Isaacson JS, Solis JM, Nicoll RA. Local and diffuse synaptic actions of GABA in the hippocampus. Neuron. 1993;10:165–175. doi: 10.1016/0896-6273(93)90308-e. [DOI] [PubMed] [Google Scholar]
- Johnson J, Sherry DM, Liu X, Fremeau RT, Jr, Seal RP, Edwards RH, Copenhagen DR. Vesicular glutamate transporter 3 expression identifies glutamatergic amacrine cells in the rodent retina. J Comp Neurol. 2004;477:386–398. doi: 10.1002/cne.20250. [DOI] [PMC free article] [PubMed] [Google Scholar]
- Kasiyanov A, Fujii N, Tamamura H, Xiong H. Modulation of network-driven, GABA-mediated giant depolarizing potentials by SDF-1alpha in the developing hippocampus. Dev Neurosci. 2008;30:285–292. doi: 10.1159/000112520. [DOI] [PubMed] [Google Scholar]
- Kerschensteiner D, Wong RO. A precisely timed asynchronous pattern of ON and OFF retinal ganglion cell activity during propagation of retinal waves. Neuron. 2008;58:851–858. doi: 10.1016/j.neuron.2008.04.025. [DOI] [PMC free article] [PubMed] [Google Scholar]
- Leinekugel X. Developmental patterns and plasticities: the hippocampal model. J Physiol Paris. 2003;97:27–37. doi: 10.1016/j.jphysparis.2003.10.004. [DOI] [PubMed] [Google Scholar]
- Maeda T, Shimoshige Y, Mizukami K, Shimohama S, Kaneko S, Akaike A, Satoh M. Patch sensor detection of glutamate release evoked by a single electrical shock. Neuron. 1995;15:253–257. doi: 10.1016/0896-6273(95)90031-4. [DOI] [PubMed] [Google Scholar]
- Milh M, Becq H, Villeneuve N, Ben-Ari Y, Aniksztejn L. Inhibition of glutamate transporters results in a “suppression-burst” pattern and partial seizures in the newborn rat. Epilepsia. 2007;48:169–174. doi: 10.1111/j.1528-1167.2006.00839.x. [DOI] [PubMed] [Google Scholar]
- Minlebaev M, Ben-Ari Y, Khazipov R. NMDA Receptors Pattern Early Activity in the Developing Barrel Cortex In Vivo. Cereb Cortex. 2008 doi: 10.1093/cercor/bhn115. [DOI] [PubMed] [Google Scholar]
- Mohajerani MH, Cherubini E. Role of giant depolarizing potentials in shaping synaptic currents in the developing hippocampus. Crit Rev Neurobiol. 2006;18:13–23. doi: 10.1615/critrevneurobiol.v18.i1-2.30. [DOI] [PubMed] [Google Scholar]
- Morgan JI, Wong RO. Development of cell types and synaptic connections in the retina. In: Kolb H, Fernandez E, Nelson R, editors. WEBVISION: The organization of the retina and the visual system. Salt Lake City: 2006. http://webvision.med.utah.edu/ [Google Scholar]
- Morgan JL, Schubert T, Wong RO. Developmental patterning of glutamatergic synapses onto retinal ganglion cells. Neural Develop. 2008;3:8. doi: 10.1186/1749-8104-3-8. [DOI] [PMC free article] [PubMed] [Google Scholar]
- Muir-Robinson G, Hwang BJ, Feller MB. Retinogeniculate axons undergo eye-specific segregation in the absence of eye-specific layers. J Neurosci. 2002;22:5259–5264. doi: 10.1523/JNEUROSCI.22-13-05259.2002. [DOI] [PMC free article] [PubMed] [Google Scholar]
- Nicol X, Voyatzis S, Muzerelle A, Narboux-Neme N, Sudhof TC, Miles R, Gaspar P. cAMP oscillations and retinal activity are permissive for ephrin signaling during the establishment of the retinotopic map. Nat Neurosci. 2007;10:340–347. doi: 10.1038/nn1842. [DOI] [PubMed] [Google Scholar]
- Ohki K, Chung S, Ch’ng YH, Kara P, Reid RC. Functional imaging with cellular resolution reveals precise micro-architecture in visual cortex. Nature. 2005;433:597–603. doi: 10.1038/nature03274. Epub 2005 Jan 2019. [DOI] [PubMed] [Google Scholar]
- Seal RP, Akil O, Yi E, Weber CM, Grant L, Yoo J, Clause A, Kandler K, Noebels JL, Glowatzki E, et al. Sensorineural deafness and seizures in mice lacking vesicular glutamate transporter 3. Neuron. 2008;57:263–275. doi: 10.1016/j.neuron.2007.11.032. [DOI] [PMC free article] [PubMed] [Google Scholar]
- Sernagor E, Eglen SJ, O’Donovan MJ. Differential effects of acetylcholine and glutamate blockade on the spatiotemporal dynamics of retinal waves. J Neurosci. 2000;20 doi: 10.1523/JNEUROSCI.20-02-j0004.2000. [DOI] [PMC free article] [PubMed] [Google Scholar]
- Sernagor E, Eglen SJ, Wong RO. Development of retinal ganglion cell structure and function. Prog Retin Eye Res. 2001;20:139–174. doi: 10.1016/s1350-9462(00)00024-0. [DOI] [PubMed] [Google Scholar]
- Sernagor E, Grzywacz NM. Spontaneous activity in developing turtle retinal ganglion cells: pharmacological studies. J Neurosci. 1999;19:3874–3887. doi: 10.1523/JNEUROSCI.19-10-03874.1999. [DOI] [PMC free article] [PubMed] [Google Scholar]
- Sernagor E, Young C, Eglen SJ. Developmental modulation of retinal wave dynamics: shedding light on the GABA saga. J Neurosci. 2003;23:7621–7629. doi: 10.1523/JNEUROSCI.23-20-07621.2003. [DOI] [PMC free article] [PubMed] [Google Scholar]
- Sharifullina E, Nistri A. Glutamate uptake block triggers deadly rhythmic bursting of neonatal rat hypoglossal motoneurons. J Physiol. 2006;572:407–423. doi: 10.1113/jphysiol.2005.100412. [DOI] [PMC free article] [PubMed] [Google Scholar]
- Sherry DM, Wang MM, Bates J, Frishman LJ. Expression of vesicular glutamate transporter 1 in the mouse retina reveals temporal ordering in development of rod vs. cone and ON vs. OFF circuits. J Comp Neurol. 2003;465:480–498. doi: 10.1002/cne.10838. [DOI] [PubMed] [Google Scholar]
- Stacy RC, Demas J, Burgess RW, Sanes JR, Wong RO. Disruption and recovery of patterned retinal activity in the absence of acetylcholine. J Neurosci. 2005;25:9347–9357. doi: 10.1523/JNEUROSCI.1800-05.2005. [DOI] [PMC free article] [PubMed] [Google Scholar]
- Stosiek C, Garaschuk O, Holthoff K, Konnerth A. In vivo two-photon calcium imaging of neuronal networks. Proc Natl Acad Sci U S A. 2003;100:7319–7324. doi: 10.1073/pnas.1232232100. Epub 2003 May 7330. [DOI] [PMC free article] [PubMed] [Google Scholar]
- Syed MM, Lee S, Zheng J, Zhou ZJ. Stage-dependent dynamics and modulation of spontaneous waves in the developing rabbit retina. J Physiol. 2004;560:533–549. doi: 10.1113/jphysiol.2004.066597. [DOI] [PMC free article] [PubMed] [Google Scholar]
- Tian N, Copenhagen DR. Visual deprivation alters development of synaptic function in inner retina after eye opening. Neuron. 2001;32:439–449. doi: 10.1016/s0896-6273(01)00470-6. [DOI] [PubMed] [Google Scholar]
- Tian N, Copenhagen DR. Visual stimulation is required for refinement of ON and OFF pathways in postnatal retina. Neuron. 2003;39:85–96. doi: 10.1016/s0896-6273(03)00389-1. [DOI] [PubMed] [Google Scholar]
- Torborg CL, Feller MB. Spontaneous patterned retinal activity and the refinement of retinal projections. Prog Neurobiol. 2005;76:213–235. doi: 10.1016/j.pneurobio.2005.09.002. Epub 2005 Nov 2008. [DOI] [PubMed] [Google Scholar]
- Tritsch NX, Yi E, Gale JE, Glowatzki E, Bergles DE. The origin of spontaneous activity in the developing auditory system. Nature. 2007;450:50–55. doi: 10.1038/nature06233. [DOI] [PubMed] [Google Scholar]
- Veruki ML, Morkve SH, Hartveit E. Activation of a presynaptic glutamate transporter regulates synaptic transmission through electrical signaling. Nat Neurosci. 2006;9:1388–1396. doi: 10.1038/nn1793. [DOI] [PubMed] [Google Scholar]
- Wadiche JI, Kavanaugh MP. Macroscopic and microscopic properties of a cloned glutamate transporter/chloride channel. J Neurosci. 1998;18:7650–7661. doi: 10.1523/JNEUROSCI.18-19-07650.1998. [DOI] [PMC free article] [PubMed] [Google Scholar]
- Wassle H, Regus-Leidig H, Haverkamp S. Expression of the vesicular glutamate transporter vGluT2 in a subset of cones of the mouse retina. J Comp Neurol. 2006;496:544–555. doi: 10.1002/cne.20942. [DOI] [PubMed] [Google Scholar]
- Wong RO, Chernjavsky A, Smith SJ, Shatz CJ. Early functional neural networks in the developing retina. Nature. 1995;374:716–718. doi: 10.1038/374716a0. [DOI] [PubMed] [Google Scholar]
- Wong RO, Meister M, Shatz CJ. Transient period of correlated bursting activity during development of the mammalian retina. Neuron. 1993;11:923–938. doi: 10.1016/0896-6273(93)90122-8. [DOI] [PubMed] [Google Scholar]
- Wong ROL. Role of retinal waves in visual system development. Annual Review of Neuroscience. 1999;22 doi: 10.1146/annurev.neuro.22.1.29. [DOI] [PubMed] [Google Scholar]
- Wong WT, Myhr KL, Miller ED, Wong RO. Developmental changes in the neurotransmitter regulation of correlated spontaneous retinal activity. J Neurosci. 2000;20:351–360. doi: 10.1523/JNEUROSCI.20-01-00351.2000. [DOI] [PMC free article] [PubMed] [Google Scholar]
- Young SH, Poo MM. Spontaneous release of transmitter from growth cones of embryonic neurones. Nature. 1983;305:634–637. doi: 10.1038/305634a0. [DOI] [PubMed] [Google Scholar]
- Zhang J, Diamond JS. Distinct perisynaptic and synaptic localization of NMDA and AMPA receptors on ganglion cells in rat retina. J Comp Neurol. 2006;498:810–820. doi: 10.1002/cne.21089. [DOI] [PMC free article] [PubMed] [Google Scholar]
- Zhou ZJ. A critical role of the strychnine-sensitive glycinergic system in spontaneous retinal waves of the developing rabbit. J Neurosci. 2001;21:5158–5168. doi: 10.1523/JNEUROSCI.21-14-05158.2001. [DOI] [PMC free article] [PubMed] [Google Scholar]
- Zhou ZJ, Zhao D. Coordinated transitions in neurotransmitter systems for the initiation and propagation of spontaneous retinal waves. J Neurosci. 2000;20:6570–6577. doi: 10.1523/JNEUROSCI.20-17-06570.2000. [DOI] [PMC free article] [PubMed] [Google Scholar]
Associated Data
This section collects any data citations, data availability statements, or supplementary materials included in this article.