Abstract
3′-Deoxyadenosine, also known as cordycepin, is a known polyadenylation inhibitor with a large spectrum of biological activities, including anti-proliferative, pro-apoptotic and anti-inflammatory effects. In this study we confirm that cordycepin reduces the length of poly(A) tails, with some mRNAs being much more sensitive than others. The low doses of cordycepin that cause poly(A) changes also reduce the proliferation of NIH3T3 fibroblasts. At higher doses of the drug we observed inhibition of cell attachment and a reduction of focal adhesions. Furthermore, we observed a strong inhibition of total protein synthesis that correlates with an inhibition of mammalian target of rapamycin (mTOR) signaling, as observed by reductions in Akt kinase and 4E-binding protein (4EBP) phosphorylation. In 4EBP knock-out cells, the effect of cordycepin on translation is strongly reduced, confirming the role of this modification. In addition, the AMP-activated kinase (AMPK) was shown to be activated. Inhibition of AMPK prevented translation repression by cordycepin and abolished 4EBP1 dephosphorylation, indicating that the effect of cordycepin on mTOR signaling and protein synthesis is mediated by AMPK activation. We conclude that many of the reported biological effects of cordycepin are likely to be due to its effects on mTOR and AMPK signaling.
Keywords: Cell/Adhesion, Cytoskeleton/Actin, Nucleoside/Nucleotide/Analogs, Phosphorylation/Kinases/Serine-Threonine, Protein/Synthesis, RNA, Polyadenylation
Introduction
Cordycepin (3′-deoxyadenosine) is found in the parasitic fungus Cordyceps miltaris and has been proposed as the active component of traditional medication that is reputed to alleviate a large variety of ailments (1–3). It has been reported to have numerous biological activities, including the inhibition of cell proliferation (4–6), induction of apoptosis (7–10), inhibition of platelet aggregation (11), inhibition of cell migration and invasiveness (4, 12), and inhibition of inflammation (13). In mice, cordycepin can reduce tumor formation in a model of metastasis (12) and has therefore been proposed as a cancer drug. The effect of cordycepin on RNA polymerases has been shown to be relatively minor. In contrast, cordycepin strongly inhibits mRNA polyadenylation, presumably by causing chain termination after it has been incorporated as cordycepin triphosphate (14). At high doses cordycepin inhibits incorporation of labeled uridine into mRNA, but not into its precursor hnRNA, indicating that the export, processing, or stability of transcribed mRNA is inhibited, rather than primary synthesis (15).
In this study, we confirm that cordycepin causes a decrease in the poly(A) tail size of specific mRNAs with some mRNAs being much more sensitive to cordycepin than others. Low doses of cordycepin cause a decrease in cell proliferation. At high doses, however, cordycepin prominently affects cell adhesion and indirectly reduces protein synthesis to very low levels. It shuts down a signal transduction pathway, the mTOR5 pathway, which is known to control proliferation, cell adhesion, and protein synthesis (16–18). In contrast to rapamycin, cordycepin inhibits the activities of both the mTORC1 and the mTORC2 complexes, affecting the activity of the protein kinase Akt. Adenosine is a cordycepin antagonist, and inhibitors of adenosine import and phosphorylation prevent the effect of cordycepin on protein synthesis, indicating that this drug is acting intracellularly and needs to be converted to cordycepin monophosphate. Cordycepin was also shown to function as an activator of the AMPK pathway. An inhibitor of AMPK blocked cordycepin-mediated inhibition of translation and Akt dephosphorylation, indicating the effects of cordycepin on translation and mTOR signaling are mediated by its activation of AMPK. These effects of cordycepin explain most of the observations reported in tissue culture experiments and provide a mechanistic explanation for the action of this agent as an anti-proliferative and anti-inflammatory drug.
EXPERIMENTAL PROCEDURES
Reagents
Cordycepin, cordycepin triphosphate, LY294,002, rapamycin, nitrobenzylthioinosine and iodotubericidin were purchased from Sigma and dissolved in DMSO at 1000-fold concentrated stock to obtain the indicated final concentrations. Compound C (6-[4-(2-piperidin-1-ylethoxy)phenyl]-3-pyridin-4-ylpyrazolo[1,5-a]pyrimidine) was purchased from Sigma and dissolved in DMSO at 5 mm.
RNA Isolation and Poly(A) Tests
RNA was isolated according to Chomczynski and Sacchi (19). RNA ligation-mediated poly(A) tests were performed as described by Rassa et al. (20) and Klenow priming poly(A) tests as described by Di Penta et al. (21). Oligonucleotides were purchased from Invitrogen. The primers used for Rps4x and Actg1 have been reported previously (22). Other primer sequences were as follows: Cdkn1a-1, GTCTGGACTGTCTACCCTTA; Cdkn1a-2, CAGGACACTGAGCAATGGCT; Hif1a, CCCACCCTGTTGGTATAAAG; Atf4, GCGAGTGTAAGGAGCTAGAA; and Rpl28, GCCACTTCTTATGTG.
Tissue Culture, Protein Synthesis, Polysome Profiles, and Cell Adhesion Assays
NIH3T3 cells were cultured in Dulbecco's modified Eagle's medium (Sigma) with 10% fetal bovine serum, 4.5 g/liter glucose and passaged every 2–3 days. For each experiment, the cells were plated at a density of 20,000 cells/cm2 the day before use.
For determination of protein synthesis rates in NIH3T3 cells, cells were plated in 4 replicates in 24-well plates at 25,000 cells/well the day before use. After the indicated treatments, the medium was removed, the wells were washed twice with PBS, and 5–15 μCi/ml Tran35S label (MP biologicals) was added in cysteine- and methionine-free Dulbecco's modified Eagle's medium. The cells were incubated at 37 °C for 10–15 min, the medium was removed, and the plate was placed on ice. After two PBS washes, the cells were extracted with 50 μl of passive lysis buffer (Promega) per well. Incorporation was measured by trichloroacetic acid precipitation on Whatman 3MM paper, and protein content was determined using Coomassie Reagent (Thermo/Pierce). The incorporation was corrected for the protein content, and the average incorporation of the control was set at 100%. An error bar representing one standard deviation is shown in each graph.
For polysome profiling, cells were grown as described above. They were treated with 100 μg/ml cycloheximide for 15 min at 37 °C, washed with ice-cold PBS, scraped, and pooled on ice. The cell pellet was lysed in 1% Triton X-100, 300 mm NaCl, 15 mm MgCl2, 100 μg/ml cycloheximide, 1 mg/ml heparin,15 mm Tris/HCl, pH 7.5, and centrifuged. The supernatant was loaded on a 10–60% sucrose gradient in the same buffer without Triton and centrifuged at 38,000 × g for 2 h. 1-ml fractions were collected, and RNA was isolated and transferred to a Northern blot. The methylene blue stain of such a blot is shown.
To characterize cell spreading, cells were cultured as described above, detached with trypsin/EDTA, resuspended in medium with serum, and washed once with serum-free medium (Dulbecco's modified Eagle's medium with 10 mm HEPES, pH 7), before being resuspended in serum-free medium at ∼1 million cells/ml. The resuspended cells were incubated with shaking at 37 °C for 1 h to dissolve all focal adhesions, diluted in serum-containing medium, and plated on glass coverslips in the presence of the indicated drugs for 5 h. Fixing and staining with phalloidin and Hoechst was as described below.
For immunohistochemistry and phalloidin staining, cells were plated on glass coverslips in the presence of serum. After treatment, cells were fixed with 4% paraformaldehyde. Vinculin antibody was applied at 1:200 in 3% bovine serum albumin in PBS. The secondary antibody was anti-mouse-coupled to Alexa 546 (Molecular Probes), also at 1:200 in 3% bovine serum albumin in PBS. Phalloidin stains were performed with fluorescein isothiocyanate- or TRITC-coupled phalloidin from Sigma at 2.5 μg/ml in PBS. Hoechst (Sigma) stains were performed at 5 μg/ml in PBS. Imaging was performed on a Zeiss LSM510 Meta confocal microscope, and the images were processed using the manufacturer's software.
Mouse embryonic fibroblasts were cultured as for NIH3T3 cells. Knock-in mutant cells in which Ser51 of eIF2α was replaced by Ala (S51A cells) and their matched controls were a gift from Dr. R. J. Kaufman (23). Cells from mice with disruptions in the genes for 4EBP1 and 4EBP2 (double knockouts) and their matched controls were a gift from Dr. N. Sonenberg (24). Protein synthesis was determined by incubation of the cells in complete medium containing [35S]methionine (7 μCi/ml) for 1 h. The cells were washed with PBS, then dissolved in 0.3 m NaOH, and protein was precipitated with 10% (w/v) trichloroacetic acid and filtered through glass fiber paper. Protein content was determined, and incorporation of radioactivity was analyzed as described above for NIH3T3 cells.
In Vitro Translation
The sensitivity of in vitro translation to cordycepin and cordycepin triphosphate was determined in reticulocyte lysate that had not been treated with nuclease, essentially as described previously (25). The nucleosides and nucleotides indicated were added to a final concentration of 200 μm. No ATP was added to the reaction unless otherwise indicated.
Antibodies and Western and Northern Blots
For Western blots, cells cultured as described above were scraped in cold PBS on ice and collected by centrifugation. After washes with cold PBS, the cell pellet was lysed in radioimmune precipitation assay buffer (PBS, 0.1% SDS, 0.5% Igepal, 0.5% sodium deoxycholate), and the protein concentration was determined. Equal amounts of protein, ∼25–40 μg/sample, were analyzed by SDS gel electrophoresis and blotting on Hybond-C membranes (Amersham Biosciences). Antibodies were used for Western blotting according to the manufacturers' recommendations. Vinculin and β-actin antibodies were purchased from Sigma. Antibodies against total and phosphorylated eIF2α (Ser51), total and phosphorylated Akt1 (Ser473), phospho and total AMPKβ1 (Ser108), total and phosphorylated Acetyl-CoA Carboxylase (Ser79), and total and phosphorylated 4EBP1 (Thr37/46) were purchased from Cell Signaling Technology. Northern blots for β-actin and Cdkn1a were performed as described previously (22).
RESULTS
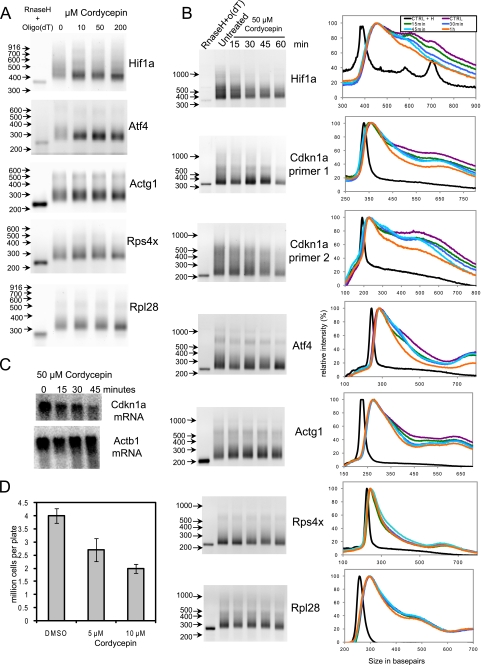
To assess if cordycepin does indeed influence the poly(A) tail length of individual mRNAs in mammalian cells, we incubated NIH3T3 fibroblasts with 10, 50, or 200 μm of the drug for 2 h and examined the poly(A) tails of a set of mRNAs for which we had RNA ligation based polyadenylation test assays available. As can been seen in Fig. 1A, the mRNAs encoding Hif1a and Atf4 showed reduced polyadenylation already at the 10 μm dose. Actg1 (γ-actin), Rps4x, and Rpl28 mRNAs were much less sensitive to cordycepin. To investigate the effect of cordycepin on the poly(A) tails of different mRNAs in more detail, we used a Klenow priming-based polyadenylation test assay on RNA from cells treated for different times with 50 μm cordycepin (Fig. 1B). Again different mRNAs showed different sensitivities to cordycepin, with Hif1a, Cdkn1a, and Atf4 being sensitive, making it unlikely that it is an artifact of the type of polyadenylation assay used. We also developed a duplicate polyadenylation assay, using two different mRNA-specific primers, for the Cdkn1a mRNA and found very similar effects for both assays. By quantifying the gels and normalizing the data to have equal maximum signals, it became apparent that the effect of cordycepin treatment was greatest mRNAs that had a large spread of poly(A) tail lengths. mRNAs with a very small fraction of poly(A) tails above the median length, such as the ribosomal protein mRNAs, were not significantly affected. For the mRNAs tested, the effects of the transcription inhibitor actinomycin D on poly(A) tail length were similar to those of cordycepin (results not shown), indicating that the long poly(A) tails are dependent on ongoing transcription and are therefore likely to represent newly transcribed mRNAs that receive long poly(A) tails in the nucleus. These data show that the poly(A) tails of some mRNAs are more sensitive to cordycepin than others and that low doses of cordycepin are sufficient to achieve these effects.
FIGURE 1.
Cordycepin affects poly(A) tail length and cell proliferation at low concentrations. A, RNA ligation poly(A) tests on RNA from NIH3T3 cells treated with different doses of cordycepin. RNase H + Oligo(dT) indicates RNA from untreated cells digested with RNase H and oligo(dT) to remove the poly(A) tail as a control. The GenBank™ gene name abbreviations indicate which mRNAs were tested: Hif1a (hypoxia-inducible factor 1α), Cdkn1a (p21/Waf/Cip), Atf4 (activating transcription factor 4), Actg1 (gamma1 actin), Rps4X (X-linked ribosomal protein S4), and Rpl28 (ribosomal protein L28). B, Klenow priming poly(A) tests on a time course of cordycepin treatment. On the right side the panels shows the distribution of the intensity in each lane as a percentage of the maximum intensity in that lane on the vertical axis and the size of the poly(A) test products in base pairs on the horizontal axis. Black, oligo(dT) RNase A-treated sample; purple, no treatment; green, 15-min cordycepin; dark blue, 30-min cordycepin; light blue, 45-min cordycepin; and orange, 60-min cordycepin. C, Northern blot for Cdkn1a and β-actin (Act1b) on total RNA isolated from cells treated with 50 μm cordycepin for the indicated times. D, cell numbers after 72 h of treatment with cordycepin (medium refreshed daily, including drug).
To investigate if the effect of cordycepin on the poly(A) tail of Cdkn1a had consequences for the abundance of this mRNA, we performed Northern blots. As can be seen in Fig. 1C, the levels of Cdkn1a mRNA had nearly halved in 45 min compared with the β-actin mRNA levels, demonstrating that cordycepin can strongly affect the abundance of certain mRNAs.
We next investigated whether low doses of cordycepin affect cell proliferation in our system. NIH3T3 fibroblasts were seeded at 106 cells per plate and incubated with 5 or 10 μm cordycepin for 72 h, with a medium change at 24 and 48 h. Normally, the cells divide twice under these conditions. As can be seen in Fig. 1D, cell numbers were markedly decreased in the presence of cordycepin, indicating that the drug inhibits cell division. Fluorescence-activated cell sorting analysis indicated that there was no increase in apoptotic cells (results not shown).
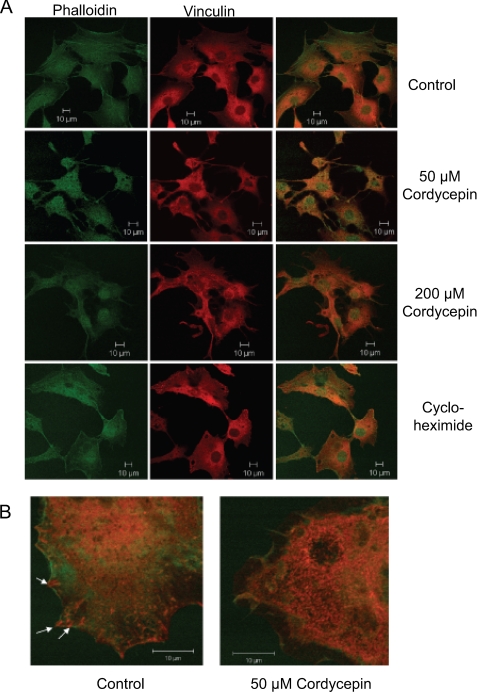
When we were incubating our cells with cordycepin for the polyadenylation assays, we noticed that the higher doses of cordycepin caused changes in cell shape. To examine these changes in more detail, we performed immunohistochemistry with the focal adhesion marker vinculin and a stain for filamentous actin (phalloidin). As can be seen in Fig. 2A, 50 and 200 μm cordycepin treatment for 3 h caused the cells to withdraw their edges toward the nucleus and only retain thin protrusions. No such effect was observed with the translation inhibitor cycloheximide over the same time period. When the cells were examined at higher magnification the actin cytoskeleton appeared disorganized, and focal adhesions were almost absent in cordycepin-treated cells (Fig. 2B).
FIGURE 2.
Cordycepin affects the actin cytoskeleton and dissolves focal adhesions. NIH3T3 cells were plated on coverslips the day before and treated for 3 h with cordycepin (50 or 200 μm) or cycloheximide (100 μg/ml). The cells were fixed and stained with an antibody against vinculin (red) to detect focal adhesions and phalloidin (green) to detect filamentous actin. A, microscopy of control cells treated with the indicated drugs with the stains imaged separately as well as merged. B, higher magnification merged image with the same stains for control and cordycepin-treated cells. Arrows indicate focal adhesions in the untreated cell.
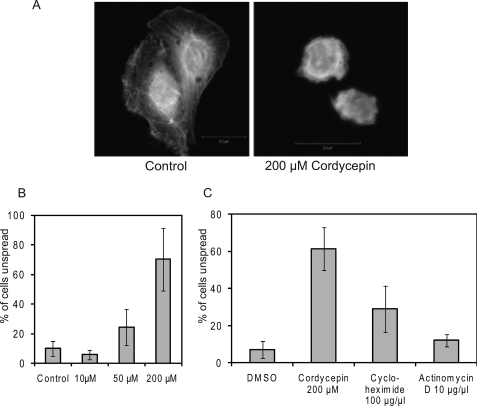
To study the effect of cordycepin on adhesion further, we examined the influence of cordycepin on cell adhesion and spreading after detachment, when focal adhesions are formed de novo. We detached NIH3T3 cells with trypsin, washed them, and kept them in suspension for 1 h to disassemble all pre-existing focal adhesions. Cells are completely rounded after this procedure. We then plated them on coverslips in the presence of cordycepin for 5 h, which is the time the cells normally need to spread fully, and stained the cells with fluorescent phalloidin (for filamentous actin). The morphology of untreated and cordycepin-treated cells was very different with the phalloidin stain, with a high level of disorganisation and a lack of spreading in the treated cells (Fig. 3A). We counted the number of incompletely spread cells as those that do not reach a diameter of 25 μm or more and expressed it as a percentage of the total number of cells. As can be seen in Fig. 3B, 10 μm cordycepin had no detectable effect on cell spreading, whereas 50 and especially 200 μm caused an increase in the number of incompletely spread cells. To investigate if this effect is due to cordycepin blocking transcription or translation of a crucial factor, we repeated this experiment with the transcription inhibitor actinomycin D and the translation inhibitor cycloheximide. As can be seen in Fig. 3C, actinomycin D had no effect on cell spreading, whereas cycloheximide had a moderate effect. This indicates that cordycepin has effects on cell spreading that are not mediated through inhibition of transcription.
FIGURE 3.
Cordycepin inhibits cell spreading. NIH3T3 cells were detached, suspended for 1 h in serum-free medium, and allowed to re-attach to coverslips with serum for 5 h in the presence or absence of cordycepin, cycloheximide, or actinomycin D at the concentrations indicated. After fixation, cells were stained with phalloidin to visualize the actin cytoskeleton. A, images of typical control and cordycepin-treated cells. B and C, quantitation of the percentage of unspread cells (largest diameter, 25 μm or less) in cells incubated with the indicated doses of drugs.
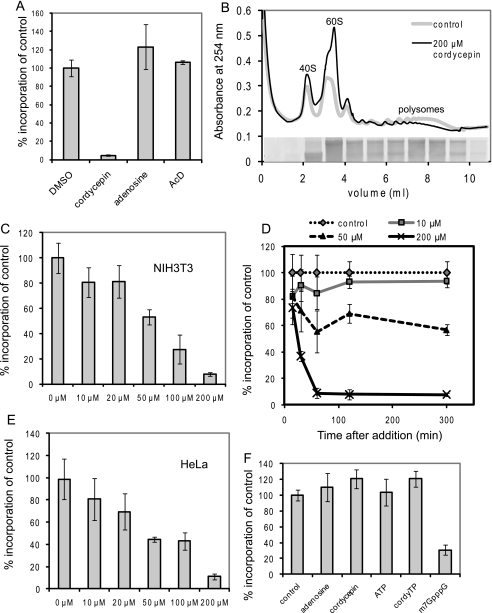
To determine the effect of cordycepin on cellular translation, we measured radioactive amino acid incorporation for 10 min after treatment with cordycepin, adenosine, or actinomycin D for 2 h. As can be seen in Fig. 4A, cordycepin at 200 μm inhibited translation by up to 95%, whereas adenosine and actinomycin D had no effect. We then examined the effect of cordycepin on the association of mRNAs with ribosomes using high salt sucrose gradient centrifugation. In these gradients, ribosomes that are not engaged in translation dissociate into 40 and 60 S subunits (26). Fig. 4B shows the polyribosome profile of untreated and treated cells. In treated cells there was a large increase in the free ribosomes (40 and 60 S) and a decrease in the polyribosome levels, indicating that there is repression of translation by cordycepin at the level of initiation. Fig. 4C shows the dose response of the effect of cordycepin on translation. From 50 μm onward there is a significant effect on translation, with smaller effects at 10 and 20 μm. This is confirmed in the time course in Fig. 4D, which also demonstrates that the maximal repression is reached after 1 h of cordycepin incubation. A similar dose response was seen in HeLa cells (Fig. 4E). These data demonstrate that cordycepin is a strong inhibitor of translation in mammalian cells.
FIGURE 4.
Cordycepin inhibits protein synthesis. A, protein synthesis rates of NIH3T3 cells as measured by 35S incorporation into protein, corrected for total protein concentration. The effects of treatment with 200 μm cordycepin or adenosine or with 10 μg/ml actinomycin D (AcD) are shown. B, polyribosome profiles of control cells and cells treated with cordycepin (200 μm) for 2 h. 40S and 60S indicate the dissociated free ribosomal subunit peaks, polysomes indicates ribosomes translating mRNA. The inset shows the RNA isolated from a control gradient, proving the identification of the 40 S peak. C, dose response of the effect of cordycepin on protein synthesis rates in NIH3T3 cells treated for 2 h. D, time course of the response of protein synthesis rates to three doses of cordycepin. E, dose response of the effect of cordycepin on protein synthesis rates in HeLa cells treated for 2 h. F, incorporation of radioactive methionine into protein in vitro in reticulocyte lysate supplemented with cordycepin, adenosine, cordycepin triphosphate (cordyTP), ATP, or cap analogue (m7GpppG) (all at 200 μm).
To investigate the possibility that cordycepin is inhibiting translation directly, we added 200 μm adenosine, cordycepin, ATP, or cordycepin triphosphate to a rabbit reticulocyte in vitro translation system. As can be seen in Fig. 4F, neither cordycepin nor cordycepin triphosphate inhibited in vitro translation, indicating that the effect is indirect. Cap analogue, a dinucleotide known to inhibit translation initiation, did markedly repress in vitro translation.
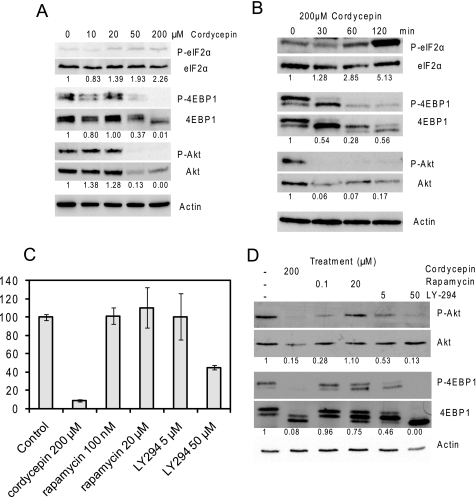
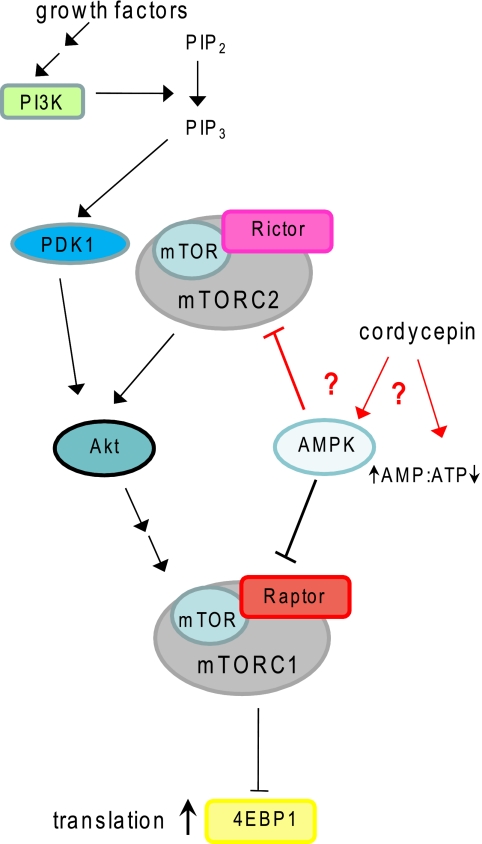
Cellular protein synthesis rates are predominantly down-regulated by the modification of translation initiation factors and their interacting proteins, especially via the phosphorylation of eIF2α and the dephosphorylation of 4EBP (18). We therefore performed Western blots for these proteins and their phosphorylated forms on cells treated with different doses of cordycepin for 2 h. As can be seen in Fig. 5A, an increase in eIF2α phosphorylation was detectable at 20 μm, whereas a decrease in 4EBP1 phosphorylation was first detected with 50 μm cordycepin. Because 4EBP phosphorylation is mediated by mTOR, we also investigated the mTOR-mediated phosphorylation of Akt1. Akt1 is a kinase that is involved in cell adhesion and proliferation, and its phosphorylation by the mTORC2 complex is known to be upstream of activation of mTORC1, the complex that phosphorylates 4EBP, as summarized in Fig. 8 (27). Akt1 phosphorylation was very strongly inhibited by 50 μm cordycepin, and the levels of the protein kinase were also reduced, indicating that the block of mTOR signaling is at the level of Akt or upstream. Time courses of these changes indicated that Akt and 4EBP1 were dephosphorylated within 30 min of treatment of cells with 200 μm cordycepin (Fig. 5B), coinciding with the decrease in overall protein synthesis (Fig. 4D), whereas the increased phosphorylation of eIF2α only occurred at later times.
FIGURE 5.
Cordycepin inhibits mTOR signaling. A, Western blots of extracts from NIH3T3 cells treated for 2 h with increasing doses of cordycepin. Blots were developed as indicated with antibodies specific for total eIF2α and its phosphorylated form (Ser51), total 4EBP1 and its phosphorylated forms (Thr37/46), Akt1 and its phosphorylated form (Ser473), and β-actin (as a loading control). Ratios between phosphorylated and total protein levels are given under the blots, with the ratio for the control set at 1. B, Western blots of extracts of cells treated for different time periods with 200 μm cordycepin. C and D, the effect of the mTORC1 inhibitor rapamycin and the phosphatidylinositol 3-kinase inhibitor LY294,002 on protein synthesis and phosphorylation of proteins. C, protein synthesis rates of NIH3T3 cells as measured by 35S incorporation into protein, corrected for total protein concentration. D, Western blots of extracts treated with inhibitors as described above.
FIGURE 8.
Summary of the AMPK and mTOR signaling pathways. Phosphatidylinositol 3 kinase (PI3K) is activated when growth factors bind to their receptors. Phosphatidylinositol bisphosphate (PIP2) is converted by PI3K into phosphatidylinositol trisphosphate (PIP3). This leads to activation of phosphoinositide-dependent protein kinase-1 (PDK1). PDK1 phosphorylates Akt1 to partially activate it and prime it for further activation. Full activation is dependent on an additional phosphorylation of Akt1by mTORC2, a complex that includes the kinase, mammalian target of rapamycin (mTOR) and the regulatory subunit Rictor. Akt1 phosphorylates and activates the mTORC1 complex that contains mTOR and the regulatory subunit Raptor. mTORC1 phosphorylates the translation repressor 4EBP and inactivates it. AMPK is known to inhibit mTORC1 activation at multiple levels. More detail can be found in Refs. 55, 58. We propose that cordycepin activates AMPK by an unknown mechanism and that active AMPK somehow also inhibits mTORC2 activity (interactions shown in red), leading to a double block of the mTOR signaling pathway.
Rapamycin can inhibit the activity of the mTORC1 complex and prevent the phosphorylation of 4EBPs in cells stimulated with growth factors (28). However, as shown in Fig. 5C, a 2-h treatment with even quite high doses of rapamycin did not reduce translational activity in our cells, even though it did somewhat reduce 4EBP1 and Akt1 phosphorylation (Fig. 5D). In contrast, LY294,002, an inhibitor of the growth signal transducer phosphatidylinositol 3-kinase, did reduce translation and abolished 4EBP1 and Akt1 phosphorylation (Figs. 5C, 5D, and 8). These data are consistent with the effect of cordycepin being mediated by a severe reduction in Akt/mTORC2 signaling.
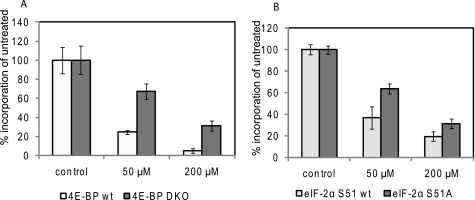
To determine the relative importance of 4EBP dephosphorylation and eIF2α phosphorylation for the inhibition of protein synthesis by cordycepin, we employed mutant mouse embryo fibroblasts in which either Ser51 of eIF2α was replaced by Ala (S51A cells) (23) or in which the genes for 4EBP1 and 4EBP2 were disrupted (24). As can be seen in Fig. 6, both mutant cell lines showed some resistance to cordycepin, compared with their corresponding wild-type controls. The reduced sensitivity to the inhibitor was particularly marked in the 4EBP double knock-out cells, suggesting that 4EBP dephosphorylation is an important mechanism by which cordycepin inhibits translation.
FIGURE 6.
Protein synthesis in murine embryonic fibroblasts lacking 4EBP expression or containing non-phosphorylatable eIF2α is resistant to cordycepin. Protein synthesis in MEFs from animals lacking expression of 4EBP1 and 4EBP2 (double knock-out, DKO) (A) and MEFs from animals with the S51A mutation in eIF2α (B), and their corresponding wild-type controls, was measured by [35S]methionine incorporation into protein. The cells were pre-treated with 0, 50, and 200 μm cordycepin for 1.5 h and then labeled for 1 h. The data are corrected for total protein concentration and are shown as the means ± S.E. of three replicates for each treatment.
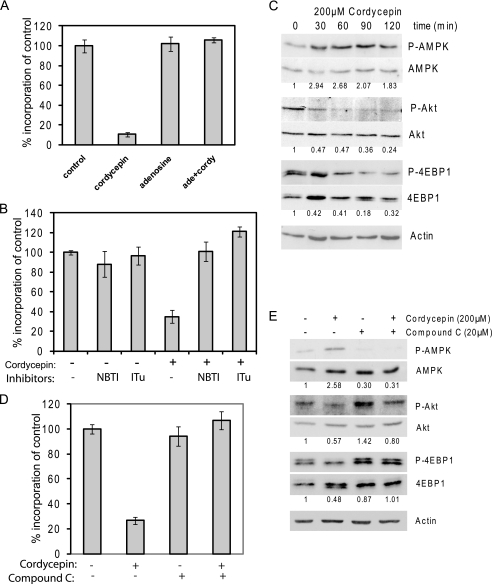
We sought to further clarify the mechanism by which cordycepin inhibits protein synthesis. To confirm that cordycepin is acting as an adenosine antagonist, we added an equal amount of adenosine to the cell cultures. As can be seen in Fig. 7A, this completely abolished the repression of protein synthesis. This shows that cordycepin is interfering with a normal function of adenosine or its metabolites. To exclude that cordycepin is acting extracellularly, for instance by binding to adenosine receptors, we preincubated the cells with the adenosine import inhibitor nitrobenzylthioinosine. As shown in Fig. 7B, nitrobenzylthioinosine completely blocked the effect of cordycepin on protein synthesis. Similarly, iodotubericidin, an inhibitor of adenosine phosphorylation, also blocked the inhibition of protein synthesis. These data show that cordycepin acts intracellularly and as a nucleotide, rather than a nucleoside.
FIGURE 7.
Cordycepin activates AMPK. A, adenosine blocks cordycepin-mediated repression of protein synthesis. NIH3T3 cells were treated with cordycepin and/or adenosine for 2 h, and protein synthesis rates were measured by 35S incorporation, corrected for total protein concentration. B, import and phosphorylation of cordycepin are required for inhibition of protein synthesis. Cells were treated with nitrobenzylthioinosine (NBTI, 10 μm) or iodotubericidin (ITu, 0.1 μm) for 15 min before treatment with cordycepin (200 μm) for 1 h. Protein synthesis rates were determined as before. C, cordycepin induces AMPK activation. Western blots are shown for AMPK β1 and its autophosphorylation site (Ser108), acetyl-CoA carboxylase and its AMPK phosphorylation site (Ser79) as well as for the proteins listed in the legend to Fig. 5. Treatment with cordycepin was for the indicated times and dose. D, protein synthesis in cells pretreated with Compound C or DMSO for 15 min prior to the addition of 200 μm cordycepin and incubation for 1 h. E, cells were treated as in D, and Western blotting was performed for the proteins indicated as described above.
AMPK is an energy and nutrient sensor that is normally activated when the ratio of AMP to ATP increases, and it is an important negative regulator of mTOR signaling and protein synthesis (29, 30). We therefore checked if AMPK was activated by cordycepin treatment. As can be seen in Fig. 7C, phosphorylation of AMPK on its autophosphorylation site in the β subunit (Ser108) increased within 30 min of treatment with cordycepin (31). Effects on AMPK activity coincided with the dephosphorylation of Akt1 and 4EBP1. To test if the activation of AMPK is required for the inhibition of protein synthesis by cordycepin, we added the AMPK inhibitor Compound C 15 min before a 1-h treatment with cordycepin and determined the effect on protein synthesis and 4EBP1 phosphorylation. As can be seen in Fig. 7D, Compound C completely cancelled the effect of cordycepin on protein synthesis. In addition, Compound C repressed the phosphorylation of AMPKβ and enhanced phosphorylation of Akt1 (Fig. 7E). Compound C also prevented the cordycepin-induced dephosphorylation of 4EBP1. These data indicate that cordycepin is primarily mediating its effect on protein synthesis through AMPK-mediated inhibition of mTOR signaling.
DISCUSSION
In this study we have shown that at low doses cordycepin affects the poly(A) tails of specific mRNAs, and this correlates with a reduction in cell proliferation. Surprisingly, at higher doses cordycepin also inhibits cell adhesion and virtually abolishes protein synthesis, probably through its effects on Akt and 4EBP phosphorylation. The most upstream target of cordycepin at higher doses appears to be AMPK, which it activates, leading to the observed reduction in mTOR signaling. Therefore the two main effects of cordycepin appear to be the inhibition of polyadenylation at low doses and the activation of AMPK at higher doses.
We demonstrate that cordycepin reduces the poly(A) tail length of a subset of mRNAs (Fig. 1). These mRNAs are likely to represent unstable mRNAs that need constant co-transcriptional polyadenylation to maintain their levels. Conversely, other mRNAs are resistant to both cordycepin and actinomycin D, suggesting that these mRNAs do not require transcription to maintain their poly(A) tail length and are protected from deadenylation and degradation in the cytoplasm. Even low doses of cordycepin have effects on the polyadenylation of sensitive mRNAs, and for one such mRNA (Cdkn1a) a rapid drop in mRNA levels in response to cordycepin was observed. This indicates that cordycepin acts at least in part by reducing the levels of sensitive mRNAs. This is in agreement with recent findings in yeast, where mutations in the mRNA degradation machinery convey resistance to cordycepin (32).
We have also shown clear effects of cordycepin on cell adhesion, both in attached cells and in cells adhering from suspension (Figs. 2 and 3). These effects appear to be at least partially independent of protein synthesis, because the strong translation inhibitor cycloheximide has little influence on attached cells and a much less pronounced effect on adhering cells. It is therefore likely that the effect of cordycepin on cell adhesion is mediated through its inhibition of Akt, which is a well known regulator of the actin cytoskeleton (33, 34).
Partial inhibition of translation by cordycepin in L5178Y cells and mouse L-cells was reported over 30 years ago (14, 35). In agreement with this, we now have also observed inhibition of protein synthesis in NIH3T3 and HeLa cells (Fig. 4) and in a human colon carcinoma cell line (results not shown). This suggests that protein synthesis is sensitive to cordycepin in a variety of cell lines. In contrast to this finding is the report that cordycepin enhances the translation of ribosomal protein mRNAs (36). Ribosomal proteins contain a 5′ oligonucleotide pyrimidine tract, which mediates serum-stimulated translation in a manner dependent on mTOR, but not on the mTORC1 or -2 complexes (37). In serum-starved HeLa cells, cordycepin and actinomycin D were found to stimulate the polyribosome association of these mRNAs without influencing general polyribosome assembly (36). We have done experiments with serum-starved NIH3T3 cells, and we still see a cordycepin-induced reduction in translational activity as determined by amino acid incorporation (results not shown), but we have not examined the polyribosomes under these conditions. Intriguingly, we consistently see that ribosomal protein mRNAs have relatively homogeneous poly(A) tails that are resistant to cordycepin and actinomycin D (Fig. 1), which could be related to their translational activity during drug treatment.
It has also been reported that cordycepin lowers c-Myc mRNA levels in HeLa cells without affecting the levels of protein produced (38). c-Myc mRNA contains an internal ribosome entry site, which could explain why it is resistant to the inhibition of cap-dependent translation initiation caused by 4EBP dephosphorylation (39).
The fact that neither cordycepin nor cordycepin triphosphate inhibits translation initiation in vitro indicates that it does not interfere directly with ATP-dependent protein synthesis steps such as the aminoacylation of tRNAs or the scanning of the 5′-untranslated region by the 43 S initiation complex. It is therefore very likely that the primary cause of the translation shutdown is the modification of initiation factors. The strong inhibition of translation observed with higher doses of cordycepin coincides with a reduction of the amount of polyribosomes, indicating that an inhibition of translation initiation does play a role (Fig. 4B). We show that eIF2α is phosphorylated and 4EBP1 is dephosphorylated in cells treated with high doses of cordycepin. In particular, 4EBP1 dephosphorylation is simultaneous with the decline in protein synthesis, and the effect of cordycepin on translation is strongly reduced in 4EBP knock-out cells. These findings indicate that the regulation of the availability of eIF4E, via its sequestration by dephosphorylated 4E-binding proteins, is a major contributor to the translational repression mediated by cordycepin. Nevertheless, cells lacking 4EBP1 and 4EBP2 are not completely resistant to the inhibitor (Fig. 6), suggesting that the phosphorylation of eIF2α may also play a role in the effects of cordycepin on translation.
The phosphorylation of an upstream-positive regulator of mTORC1, Akt, is also inhibited in cordycepin-treated cells. As depicted in Fig. 8, Akt activation is mediated by the mTORC2 complex, and it therefore indicates that cordycepin interferes with mTOR signaling upstream of Akt and mTORC2.
In addition to its regulation of 4EBP1, mTOR signaling increases the activity of the translation elongation factor eEF2 by inactivation of its inhibitory kinase through phosphorylation by S6 kinase (40). Therefore, inhibition of the mTOR pathways is expected to lead to inhibition of both initiation and elongation of translation. This is consistent with the observed polysome profile, which still shows some polysome assembly, despite the severely impaired amino acid incorporation (Fig. 4B). In addition, mTORC1 and Akt have been documented to affect the activity of at least four other initiation factors (41–44). The inhibition of the mTOR pathway is therefore very likely to be the cause of the observed down-regulation of protein synthesis.
The activation of AMPK by cordycepin appears to be upstream of the down-regulation of the mTOR pathway by cordycepin, because Compound C can prevent the effects of cordycepin on mTOR signaling. A similar mechanism has been demonstrated for protein synthesis inhibition by the type II diabetes drug metformin (29). In mouse embryonic fibroblasts, the repression of translation and mTOR signaling by metformin was shown to be dependent on the AMPK target and mTOR inhibitor Tsc2. In Tsc2 knock-out cells, AMPK was still activated by metformin, but no down-regulation of mTOR signaling was observed. However, the antagonism between AMPK and Akt appears to be bi-directional, at least in some cases, with Akt activation repressing AMPK activation and Akt down-regulation increasing AMPK activity (45). We cannot therefore completely exclude the possibility that the induction of Akt1 phosphorylation by Compound C is blocking a direct effect of cordycepin on Akt, with AMPK activation by cordycepin being a secondary effect of the reduction in Akt signaling.
One possible mechanism for the activation of AMPK by cordycepin is that cordycepin monophosphate is a stronger activator of AMPK than AMP. Another possibility is that cordycepin may activate AMPK is through the induction of a change in the AMP:ATP ratio. We propose that cordycepin activates AMPK by an unknown mechanism, and this inhibits mTORC2 as well as mTORC1 activity, leading to a double block of the mTOR signaling pathway as depicted in Fig. 8.
As a polyadenylation inhibitor, cordycepin has been used as a tool to investigate the role of cytoplasmic polyadenylation in a variety of systems (e.g. 46–48). In most cases, the doses employed are high and therefore likely to activate AMPK and repress mTOR signaling and total protein synthesis. Fortunately, in these studies due care was taken to include other methods to verify that cytoplasmic polyadenylation is taking place. However, we have to conclude that an observation of effects of cordycepin on a biological process can no longer be used as an indication of a role of cytoplasmic polyadenylation without rigorous checks on the effects on the AMPK and mTOR signaling pathways.
Cordycepin has been under investigation as an anti-proliferative drug for nearly 50 years (49). However, the instability of the molecule in the body has been problematic so far, due to the presence of adenosine deaminases. A combination therapy with an adenosine deaminase inhibitor as a treatment for TdT-positive leukemia is currently in Phase I/II clinical trials (Oncovista, Inc.). Recently, more stable prodrugs have been synthesized, but their potential therapeutic effects have not yet been assessed (50). Two aspects of the current study indicate that cordycepin continues to be an interesting lead compound for cancer therapy as well as a potentially useful tool to identify therapeutic targets.
Firstly, at low doses, at which the only detectable effect of cordycepin is on poly(A) tail length, the target is likely to be one or more of the mRNAs that have a poly(A) tail with a high sensitivity to cordycepin. These can now be identified using a poly(A) fractionation microarray screen (22). These low doses of cordycepin are likely to be achievable in patients with only moderate modifications in the drug delivery.
Secondly, the mTOR and AMPK pathways are currently under intense scrutiny as targets in cancer therapy (16, 51–55). Other AMPK activators, including metformin, have been shown to be effective in animal models of cancer (56, 57). As described above, the effects of cordycepin on translation and mTOR signaling are similar to those observed for metformin. In addition, the anti-inflammatory effect of cordycepin can be explained by its effects on mTOR and AMPK signaling, because cordycepin-mediated repression of inflammation has been reported to involve the inhibition of Akt (13). As an inhibitor of Akt and an activator of AMPK, cordycepin therefore is a candidate drug for type II diabetes, a potential anti-inflammatory, and a putative cancer drug. Perhaps tradition was in the right after all.
Acknowledgments
We thank Peter Jones, Martin Bushell, and Anne Willis for illuminating discussions. Helen Dobbyn is thanked for the gift of reagents for the in vitro translation experiments. Winnie Wong, Amy Chen, and Natalie Reeves are thanked for help with some of the pilot studies that led to this investigation.
This work was supported by the Wellcome Trust (Grants 076179 and 082609) and the Biotechnology and Biological Sciences Research Council (Grant BB/G001847/1).
- mTOR
- mammalian target of rapamycin
- AMPK
- AMP-activated kinase
- PBS
- phosphate-buffered saline
- TRITC
- tetramethylrhodamine isothiocyanate
- 4EBP
- 4E-binding protein.
REFERENCES
- 1.Yang F. Q., Li S. P. (2008) J. Pharm. Biomed. Anal. 48, 231–235 [DOI] [PubMed] [Google Scholar]
- 2.Paterson R. R. (2008) Phytochemistry 69, 1469–1495 [DOI] [PMC free article] [PubMed] [Google Scholar]
- 3.Ng T. B., Wang H. X. (2005) J. Pharm. Pharmacol. 57, 1509–1519 [DOI] [PubMed] [Google Scholar]
- 4.Chang W., Lim S., Song H., Song B. W., Kim H. J., Cha M. J., Sung J. M., Kim T. W., Hwang K. C. (2008) Eur. J. Pharmacol. 597, 64–69 [DOI] [PubMed] [Google Scholar]
- 5.Shi P., Huang Z., Tan X., Chen G. (2008) Methods Find. Exp. Clin. Pharmacol. 30, 347–353 [DOI] [PubMed] [Google Scholar]
- 6.Nakamura K., Yoshikawa N., Yamaguchi Y., Kagota S., Shinozuka K., Kunitomo M. (2006) Anticancer Res. 26, 43–47 [PubMed] [Google Scholar]
- 7.Wehbe-Janek H., Shi Q., Kearney C. M. (2007) Anticancer Res. 27, 3143–3146 [PubMed] [Google Scholar]
- 8.Wu W. C., Hsiao J. R., Lian Y. Y., Lin C. Y., Huang B. M. (2007) Cancer Chemother. Pharmacol. 60, 103–111 [DOI] [PubMed] [Google Scholar]
- 9.Thomadaki H., Scorilas A., Tsiapalis C. M., Havredaki M. (2008) Cancer Chemother. Pharmacol. 61, 251–265 [DOI] [PubMed] [Google Scholar]
- 10.Chen L. S., Stellrecht C. M., Gandhi V. (2008) Br. J. Haematol. 140, 682–691 [DOI] [PubMed] [Google Scholar]
- 11.Cho H. J., Cho J. Y., Rhee M. H., Kim H. S., Lee H. S., Park H. J. (2007) J. Microbiol. Biotechnol. 17, 1134–1138 [PubMed] [Google Scholar]
- 12.Nakamura K., Konoha K., Yoshikawa N., Yamaguchi Y., Kagota S., Shinozuka K., Kunitomo M. (2005) In Vivo. 19, 137–141 [PubMed] [Google Scholar]
- 13.Kim H. G., Shrestha B., Lim S. Y., Yoon D. H., Chang W. C., Shin D. J., Han S. K., Park S. M., Park J. H., Park H. I., Sung J. M., Jang Y., Chung N., Hwang K. C., Kim T. W. (2006) Eur. J. Pharmacol. 545, 192–199 [DOI] [PubMed] [Google Scholar]
- 14.Müller W. E., Seibert G., Beyer R., Breter H. J., Maidhof A., Zahn R. K. (1977) Cancer Res. 37, 3824–3833 [PubMed] [Google Scholar]
- 15.Penman S., Rosbash M., Penman M. (1970) Proc. Natl. Acad. Sci. U.S.A. 67, 1878–1885 [DOI] [PMC free article] [PubMed] [Google Scholar]
- 16.Guertin D. A., Sabatini D. M. (2007) Cancer Cell. 12, 9–22 [DOI] [PubMed] [Google Scholar]
- 17.Yang Q., Guan K. L. (2007) Cell Res. 17, 666–681 [DOI] [PubMed] [Google Scholar]
- 18.Clemens M. J. (2005) Semin. Cell Dev. Biol. 16, 13–20 [DOI] [PubMed] [Google Scholar]
- 19.Chomczynski P., Sacchi N. (1987) Anal. Biochem. 162, 156–159 [DOI] [PubMed] [Google Scholar]
- 20.Rassa J. C., Wilson G. M., Brewer G. A., Parks G. D. (2000) Virology 274, 438–449 [DOI] [PubMed] [Google Scholar]
- 21.Di Penta A., Mercaldo V., Florenzano F., Munck S., Ciotti M. T., Zalfa F., Mercanti D., Molinari M., Bagni C., Achsel T. (2009) J. Cell Biol. 184, 423–435 [DOI] [PMC free article] [PubMed] [Google Scholar]
- 22.Meijer H. A., Bushell M., Hill K., Gant T. W., Willis A. E., Jones P., De Moor C. H. (2007) Nucleic Acids Res. 35, e132. [DOI] [PMC free article] [PubMed] [Google Scholar]
- 23.Scheuner D., Patel R., Wang F., Lee K., Kumar K., Wu J., Nilsson A., Karin M., Kaufman R. J. (2006) J. Biol. Chem. 281, 21458–21468 [DOI] [PubMed] [Google Scholar]
- 24.Le Bacquer O., Petroulakis E., Paglialunga S., Poulin F., Richard D., Cianflone K., Sonenberg N. (2007) J. Clin. Investig. 117, 387–396 [DOI] [PMC free article] [PubMed] [Google Scholar]
- 25.Jackson R. J., Hunt T. (1983) Methods Enzymol. 96, 50–74 [DOI] [PubMed] [Google Scholar]
- 26.Bushell M., Stoneley M., Kong Y. W., Hamilton T. L., Spriggs K. A., Dobbyn H. C., Qin X., Sarnow P., Willis A. E. (2006) Mol. Cell. 23, 401–412 [DOI] [PubMed] [Google Scholar]
- 27.Manning B. D., Cantley L. C. (2007) Cell 129, 1261–1274 [DOI] [PMC free article] [PubMed] [Google Scholar]
- 28.Gingras A. C., Raught B., Sonenberg N. (2004) Curr. Top. Microbiol. Immunol. 279, 169–197 [DOI] [PubMed] [Google Scholar]
- 29.Dowling R. J., Zakikhani M., Fantus I. G., Pollak M., Sonenberg N. (2007) Cancer Res. 67, 10804–10812 [DOI] [PubMed] [Google Scholar]
- 30.Bolster D. R., Crozier S. J., Kimball S. R., Jefferson L. S. (2002) J. Biol. Chem. 277, 23977–23980 [DOI] [PubMed] [Google Scholar]
- 31.Woods A., Vertommen D., Neumann D., Turk R., Bayliss J., Schlattner U., Wallimann T., Carling D., Rider M. H. (2003) J. Biol. Chem. 278, 28434–28442 [DOI] [PubMed] [Google Scholar]
- 32.Holbein S., Freimoser F. M., Werner T. P., Wengi A., Dichtl B. (2008) Nucleic Acids Res. 36, 353–363 [DOI] [PMC free article] [PubMed] [Google Scholar]
- 33.Amiri A., Noei F., Jeganathan S., Kulkarni G., Pinke D. E., Lee J. M. (2007) Oncogene 26, 3027–3040 [DOI] [PubMed] [Google Scholar]
- 34.Enomoto A., Murakami H., Asai N., Morone N., Watanabe T., Kawai K., Murakumo Y., Usukura J., Kaibuchi K., Takahashi M. (2005) Dev. Cell 9, 389–402 [DOI] [PubMed] [Google Scholar]
- 35.Craig N. (1973) J. Cell. Physiol. 82, 133–150 [DOI] [PubMed] [Google Scholar]
- 36.Loreni F., Thomas G., Amaldi F. (2000) Eur. J. Biochem. 267, 6594–6601 [DOI] [PubMed] [Google Scholar]
- 37.Patursky-Polischuk I., Stolovich-Rain M., Hausner-Hanochi M., Kasir J., Cybulski N., Avruch J., Rüegg M. A., Hall M. N., Meyuhas O. (2009) Mol. Cell. Biol. 29, 640–649 [DOI] [PMC free article] [PubMed] [Google Scholar]
- 38.Ioannidis P., Courtis N., Havredaki M., Michailakis E., Tsiapalis C. M., Trangas T. (1999) Oncogene 18, 117–125 [DOI] [PubMed] [Google Scholar]
- 39.Evans J. R., Mitchell S. A., Spriggs K. A., Ostrowski J., Bomsztyk K., Ostarek D., Willis A. E. (2003) Oncogene 22, 8012–8020 [DOI] [PubMed] [Google Scholar]
- 40.Browne G. J., Proud C. G. (2004) Mol. Cell. Biol. 24, 2986–2997 [DOI] [PMC free article] [PubMed] [Google Scholar]
- 41.van Gorp A. G., van der Vos K. E., Brenkman A. B., Bremer A., van den Broek N., Zwartkruis F., Hershey J. W., Burgering B. M., Calkhoven C. F., Coffer P. J. (2009) Oncogene 28, 95–106 [DOI] [PubMed] [Google Scholar]
- 42.Harris T. E., Chi A., Shabanowitz J., Hunt D. F., Rhoads R. E., Lawrence J. C., Jr. (2006) EMBO J. 25, 1659–1668 [DOI] [PMC free article] [PubMed] [Google Scholar]
- 43.Woodard J., Sassano A., Hay N., Platanias L. C. (2008) Clin. Cancer Res. 14, 4640–4649 [DOI] [PubMed] [Google Scholar]
- 44.Raught B., Peiretti F., Gingras A. C., Livingstone M., Shahbazian D., Mayeur G. L., Polakiewicz R. D., Sonenberg N., Hershey J. W. (2004) EMBO J. 23, 1761–1769 [DOI] [PMC free article] [PubMed] [Google Scholar]
- 45.Hahn-Windgassen A., Nogueira V., Chen C. C., Skeen J. E., Sonenberg N., Hay N. (2005) J. Biol. Chem. 280, 32081–32089 [DOI] [PubMed] [Google Scholar]
- 46.Groisman I., Huang Y. S., Mendez R., Cao Q., Theurkauf W., Richter J. D. (2000) Cell 103, 435–447 [DOI] [PubMed] [Google Scholar]
- 47.Zearfoss N. R., Alarcon J. M., Trifilieff P., Kandel E., Richter J. D. (2008) J. Neurosci. 28, 8502–8509 [DOI] [PMC free article] [PubMed] [Google Scholar]
- 48.Rhoads R. E., Grudzien-Nogalska E. (2007) J. Mammary Gland Biol. Neoplasia 12, 283–292 [DOI] [PubMed] [Google Scholar]
- 49.Jagger D. V., Kredich N. M., Guarino A. J. (1961) Cancer Res. 21, 216–220 [PubMed] [Google Scholar]
- 50.Wei H. P., Ye X. L., Chen Z., Zhong Y. J., Li P. M., Pu S. C., Li X. G. (2009) Eur. J. Med. Chem. 44, 665–669 [DOI] [PubMed] [Google Scholar]
- 51.Hardie D. G. (2008) Mol. Cell 30, 263–265 [DOI] [PubMed] [Google Scholar]
- 52.Sheng S., Qiao M., Pardee A. B. (2009) J. Cell. Physiol. 218, 451–454 [DOI] [PubMed] [Google Scholar]
- 53.Garcia-Echeverria C., Sellers W. R. (2008) Oncogene 27, 5511–5526 [DOI] [PubMed] [Google Scholar]
- 54.Smolewski P. (2006) Anticancer Drugs 17, 487–494 [DOI] [PubMed] [Google Scholar]
- 55.Memmott R. M., Dennis P. A. (2009) Cell. Signal. 21, 656–664 [DOI] [PMC free article] [PubMed] [Google Scholar]
- 56.Huang X., Wullschleger S., Shpiro N., McGuire V. A., Sakamoto K., Woods Y. L., McBurnie W., Fleming S., Alessi D. R. (2008) Biochem. J. 412, 211–221 [DOI] [PubMed] [Google Scholar]
- 57.Rattan R., Giri S., Singh A. K., Singh I. (2005) J. Biol. Chem. 280, 39582–39593 [DOI] [PubMed] [Google Scholar]
- 58.Huang J., Manning B. D. (2009) Biochem. Soc. Trans. 37, 217–222 [DOI] [PMC free article] [PubMed] [Google Scholar]


