

Abstract
Aging is a physiological process involving both genetic factors and environmental agents that can lead to function loss in organs. In the kidney, aging can cause leakage of proteins in urine, starting with albumin. Discovering molecular mechanisms responsible for albuminuria during aging could offer new perspectives on the etiology of this abnormality. Haplotype association mapping in the mouse is a novel approach which uses the haplotypes of the relatively closely related mouse inbred strains and the variation of the phenotypes among these strains to find associations between haplotypes and phenotype. Albumin-to-creatinine ratios, measures of urinary albumin excretion, were determined in 30 inbred mouse strains at 12, 18, and 24 months of age. To determine genetic loci that are involved in albuminuria, haplotype association mapping was performed for males and females separately at all 3 time points using a set of 63,222 SNPs. One significant and 8 suggestive loci were identified, some of which map to previously identified loci for traits associated with kidney damage in the mouse, but with a much higher resolution, which narrowed the mapped loci. These 9 loci were then investigated in the data of the genome-wide association scan for diabetic nephropathy in human type 1 diabetes. Two of the 9 mouse loci were found to be significantly associated with diabetic nephropathy, suggesting common underlying genes predisposing to kidney disease in mice and humans.
INTRODUCTION
The kidneys are particularly affected by age. Not only does aging in other organs impact the kidneys, but their decline also contributes directly to the pathogenesis of many other age-related pathologies.1 Many changes take place in the kidney during aging: functional changes, such as the decline in glomerular filtration rate2 and reduction in sodium homeostasis3; vascular changes leading to atherosclerosis, hyperplasia, and hypertension4; and structural changes in the glomeruli,5 tubuli, and the interstitium. These changes involve various mechanisms and pathways, and it is difficult to identify the main causal players leading to these changes.
It is becoming increasingly recognized in experimental models that both sex and genetic background play a significant role in the scale and progression of kidney damage associated with age.1 These differences can be used in phenotype-driven approaches to identify the causal factors responsible for this variation.
In recent years, several studies analyzed quantitative trait loci (QTL) for urinary albumin on crosses between different rat6 and mouse strains.7, 8 These studies identified genetic loci linked to kidney damage, but all were performed on relatively young animals (3–5 months). Thus, the reported loci may not be particularly relevant to age-related kidney disease in humans.
In the present study, we examined the progression of kidney damage using urinary albumin-to-creatinine ratios (ACR) in male and female mice from 30 inbred strains for up to 24 months, well into old age. To localize candidate chromosomal regions associated with increased albuminuria we used haplotype association mapping (HAM), a recently developed approach which utilizes high-density SNP data from many inbred strains to identify chromosomal haplotypes associated with phenotypic traits of interest.9, 10 Finally, because the ultimate goal of genetic studies using animal models is to find genes relevant to human disease, we identified homologous human chromosomal intervals for our mouse loci and tested them for significant association with nephropathy in the genome-wide association scan (GWAS) data obtained in the GoKinD collection of type 1 diabetic patients.11
RESULTS
Albumin-to-creatinine Ratios for Mouse Inbred Strains
The 30 inbred mouse strains used in this study are listed in Table 1. Our data for urinary albumin and creatinine measurements for male and female mice of all strains are available at the Mouse Phenome Database (MPD) (www.jax.org/phenome). From these values the albumin (in μg) to creatinine (in g) ratio (ACR) was calculated at 12, 18, and 24 months of age (Figure 1). At each time point we observed large variability in ACR measurements among strains. Many assayed strains, including BALB, C57BR, and BLKS, have low ACR values that remain stable over time. Several strains, including KK, PWD, and BUB, show increased ACR as early as 12 months. Interestingly, among these strains, the increases appear to be sex specific. These sex differences are also apparent in the progression of ACR over time. Moreover, we see a faster increase in ACR for A, B10, FVB, NZW, PWD, and WSB males compared to females (Figure 2A). Yet contrary to this, we see a more rapid progression of ACR in female mice in the BUB, KK, MRL, NON, and SJL strains (Figure 2B). Because median lifespan for strains used in this study is 22 months (individual strain data can be obtained from the MPD), not all strains were available for analysis at the later time points. Because different cohorts for each strain were used for the different time points, some strains had enough animals per group at 24 months; some strains, however, had no animals left even at 18 months of age. For males, there is no data for CAST, SJL, and BTBR at 18 months, and for CAST, PL, KK, NZO, and P at 24 months. For females, there is no data for PL at 18 months, and for CAST, BTBR, KK, MRL, NOD, NZO, and PL at 24 months.
Table 1. The 30 inbred mouse strains used in the aging study and their abbreviations as used in the text.
| 129S1/SvImJ (129) | C57BLKS/J (BLKS) | LP/J (LP) | PWD/PHJ (PWD) |
| A/J (A) | C57BR/cdJ (C57BR) | MRL/J (MRL) | RIIIS/J (RIIIS) |
| BALB/cByJ (BALB) | C57L/J (C57L) | NOD.B10Sn-H2b/J (NOD) | SJL/J (SJL) |
| BTBR T+ tf/J (BTBR) | CAST/EiJ (CAST) | NON/LtJ (NON) | SM/J (SM) |
| BUB/BnJ (BUB) | CBA/J (CBA) | NZO/H1LtJ (NZO) | SWR/J (SWR) |
| C3H/HeJ (C3H) | DBA/2J (D2) | NZW/LacJ (NZW) | WSB/EiJ (WSB) |
| C57BL/6J (B6) | FVB/NJ (FVB) | P/J (P) | |
| C57BL/10J (B10) | KK/J (KK) | PL/J (PL) |
Figure 1. Mean albumin-to-creatinine ratios (ACR) for males and females from all 30 mouse strains at 12, 18, and 24 months, with standard deviations.

Figure 2. Sex differences in the susceptibility and progression of ACR are strain dependent.
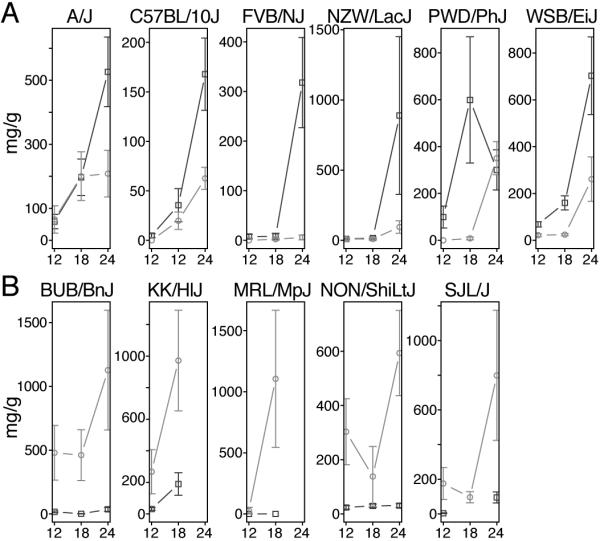
(A) Strain in which males (squares) are more susceptible and have a higher increase of ACR over time compared to females (circles), and (B) the opposite effect, where females are more susceptible and have a higher increase of ACR over time compared to males.
Haplotype Association Mapping
We used a total of 63,222 SNPs (average spacing of 40.53 kilobases [kb] between each SNP) to re-construct haplotypes across the genomes of all 30 mouse strains. We then used the F-test statistics to obtain a high-resolution map of associated intervals and estimate the strength of association between genotypes across these haplotypes and the albuminuria phenotype (as measured by ACR) across all strains. Figure 3 summarizes the genome-wide HAM results for ACR at 12, 18, and 24 months in males and females. We estimated family-wise error rate (FWER) at alpha levels of 0.05 and 0.20 through permutation testing to identify significant and suggestive HAM peaks. Only one peak, on chromosome (Chr) 2 in 18-month-old males, reached the stringent level of significance. We believe, however, that because of the genetic relatedness between the genomes of laboratory strains, the power may be low, resulting in an overly stringent genome-wide threshold that fails to detect biologically relevant peaks. Therefore, we considered α<0.20 to be suggestive evidence of true genetic associations. We identified 22 peaks across the genome that corresponded to this threshold. Careful examination of the haplotypes in the associated intervals, by sorting the strains by haplotype and their association with the phenotype, identified several peaks that were associated with a haplotype in only one strain. Other associations, however, were not entirely convincing with the current dataset as there was association with only one SNP. In these cases we went to the original NIEHS and Broad SNP datasets that were used to create the dataset that we used for the analysis, this to see whether the association expanded over a larger region. Unfortunately, the original datasets have too many missing values in these regions for the strains that we used. Denser SNP data and phenotype data from more strains are needed to provide a conclusive answer. Nine loci, ranging in size from 100 to 650 kb, with an average of 2 genes per locus, were determined to be robust associations (Table 2). The strongest association with ACR was mapped to a 180 kb region on Chr 2 in 18-month-old male mice (P=1.9×10⁻¹⁰). Two genes, Cyp24a1 and Fdn4, reside within this interval. The most significant association in female mice (P=3.5×10⁻¹⁰) occurred in 12-month-old animals and was localized to a 100 kb region on Chr 3 that contains Negr1, which encodes the neuronal growth regulator 1. Among 24-month-old mice, the strongest association in male and female mice occurred at the Ripk2 locus on Chr 4 (P=1.2×10⁻⁸) and at the Atic/Fn1 locus on Chr 1 (P=3.7×10⁻⁸), respectively. Interestingly, with the exception of the locus on Chr 11, which was identified in males at 24 months and showed a suggestive peak at 18 months, each of the associated loci are unique, with no overlap between sexes and across the measured time points.
Figure 3. Genome-wide scans for females at 12 (A), 18 (B), and 24 months (C), and males at 12 (D), 18 (E), and 24 months (F) using the -log10 P values.

Family-wise error rate (FWER) at alpha levels of 0.05 and 0.20 were estimated through permutation testing to identify significant and suggestive HAM peaks.
Table 2. Summary of the HAM peaks for both sexes at the different time points.
For each locus the chromosomal location (mouse genome Build 37), the P-value calculated by F-statistics, and the annotated genes within the interval (Ensembl database) are given. The genome-wide type I error thresholds were estimated based on 1000 permutation tests. The P-value thresholds at α<0.02 level corresponds to a nominal value of 1.9×10⁻⁹ for 12 month females, 3.4×10⁻⁹ for 18 month females, 3.0×10⁻⁸ for 24 month females, 1.6×10⁻⁸ for 18 month males, and 6.2×10⁻⁷ for 24 month males
| Age (Months) |
Sex | Chr | Locus (Mb) | Nominal P value |
Genes in Interval |
|---|---|---|---|---|---|
| 12 | F | 3 | 156.92–157.02 | 3.5×10⁻¹⁰ | Negr1 |
| 18 | F | 7 | 36.62–36.74 | 2.7×10⁻⁹ | no gene |
| M | 2 | 170.30–170.48 | 1.9×10⁻¹⁰ | Cyp24a1, Fdn4 | |
| M | 6 | 65.60–66.57 | 4.3×10⁻⁹ | Prdm5 | |
| M | 8 | 10.60–10.95 | 4.3×10⁻⁹ | Myo16 | |
| 24 | F | 1 | 71.52–71.68 | 1.2×10⁻⁸ | Atic, Fn1 |
| F | 18 | 82.72–82.94 | 1.6×10⁻⁸ | Mbp, Zfp236 | |
| M | 4 | 16.08–16.36 | 3.7×10⁻⁸ | Ripk2 | |
| M | 11 | 73.05–74.10 | 3.7×10⁻⁸ |
Trpv1, Trpv3, Aspa, Spata22, Olfr381, Olfr389, Olfr392 |
Concordance Between Albuminuria-Associated Loci in Mice and Diabetic Nephropathy Susceptibility Genes in Humans
To assess whether genomic regions associated with albuminuria in mice were also associated with nephropathy in humans, we analyzed genetic data from the GoKinD collection at syntenic human chromosomal regions corresponding to each of the albuminuria-associated loci identified using HAM. For each locus, genotypic data from a recent GWAS of this collection were enhanced by the imputation of un-genotyped SNPs.12 To minimize redundancy between highly correlated SNPs, 1,085 tagging SNPs were identified across these 9 loci from among a total of 4,329 available SNPs (including 671 genotyped SNPs and 3,658 imputed HapMap SNPs) using an r2 threshold > 0.80 and examined for evidence of association. Among 885 control subjects with type 1 diabetes (T1D) and normoalbuminuria and 820 case subjects with T1D and advanced diabetic nephropathy (DN), we identified significant associations (P<0.05/1,085 tag SNPs=4.6×10⁻⁵) at 2 unique SNPs across the 9 albuminuria-associated loci (Table 3). We observed the strongest association at rs1411766 (odds ratio [OR]=1.41, P=1.8×10⁻⁶), a SNP located in an intergenic region on human chromosome 13q and within the syntenic albuminuria-associated locus identified on mouse Chr 8 (Figure 4). This association maps approximately 384 kb distal of the MYO16 (myosin heavy chain Myr 8) gene and 120 kb proximal of IRS2 (insulin receptor substrate 2). We observed a second significant association at an imputed SNP (rs6671557, OR=1.97, P=2.8×10⁻⁵) within intron 3 of NEGR1 (neuronal growth regulator 1) on human chromosome 1p, a region syntenic to the albuminuria-associated locus identified on mouse Chr 3. rs6671557 was subsequently genotyped in the GoKinD samples, and we confirmed the association with the imputed data (P=4.9×10⁻⁵). We analyzed both SNPs according to sex. For each, the strength of the association was consistent across the male and female strata.
Table 3. Summary of Associations with Diabetic Nephropathy in GWAS Data from the GoKinD Collection at Syntenic Human Chromosomal Regions for Mouse Albuminuria-Associated Loci.
| Mouse HAM Peak Regions* | Human GWA Scan Results† | |||||||
|---|---|---|---|---|---|---|---|---|
| Chr. | Locus (Mb) |
Haplotype Size (kb) |
Gene(s) Within Interval |
Chr. | Candidate Gene Interval (Mb)‡ |
SNP¶ | P value | Nearest Gene |
| 1 | 71 | 154.3 | Atic, Fn1 | 2 | 215.8–216.1 | rs13002052 | 0.02 | ATIC |
| 2 | 170 | 184.1 | Cyp24a1, Pfdn4 | 20 | 52.2–52.4 | rs964293 | 0.03 | PFDN4 |
| 3 | 157 | 104.8 | Negr1 | 1 | 71.5–72.6 | rs6671557 | 4.9×10⁻⁵ | NEGR1 |
| 4 | 16 | 281.1 | Ripk2 | 8 | 90.7–90.9 | rs13276910 | 8.7×10⁻³ | RIPK2 |
| 6 | 66 | 962.6 | Prdm5 | 4 | 121.2–122.2 | rs17051145 | 0.02 | PRDM5 |
| 7 | 36 | 119.2 | no gene | 19 | 37.3–37.6 | rs10403365 | 0.01 | ZNF507 |
| 8 | 10 | 354.8 | Myo16 | 13 | 108.0–109.2 | rs1411766 | 1.8×10⁻⁶ | IRS2 |
| 11 | 73 | 1047.3 |
Trpv1, Trpv3, Aspa, Spata22, Olfr381, Olfr389, Olfr392 |
17 | 3.0–3.5 | rs9904733 | 0.01 | SHPK |
| 18 | 82 | 217.2 | Mbp, Znf236 | 18 | 72.5–72.9 | rs4891196 | 0.02 | ZNF236 |
Chromosomal loci and gene annotations are in reference to NCBI Build 37.1 of the mouse genome.
Chromosomal loci and gene annotations are in reference to NCBI Build 36.1 of the human genome.
Candidate gene intervals correspond to syntenic human chromosomal regions. For genes partially contained within the syntenic albuminuria-associated regions, these intervals were extended to include ± 50kb of sequence flanking the gene(s) contained within the associated genomic intervals.
Most strongly associated SNPs in the GoKinD collection within each candidate gene interval.
Figure 4. Genetic associations at albuminuria-associated loci in human GWA scan data.
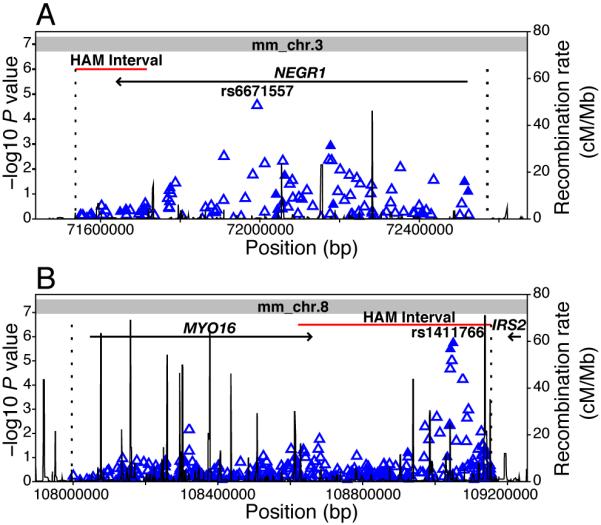
(A) Association data (-log10 P-values calculated using the Cochran-Mantel-Haenszel method, adjusting for gender and GoKinD sub-collection) from Type 1 diabetes patients with and without advanced diabetic nephropathy from the GoKinD collection are shown for 114 tag SNPs, including 14 genotyped (solid triangles) and 100 imputed (open triangles) SNPs, spanning the candidate gene interval on human chromosome 1p (position 71,537,304 to 72,570,865, dashed lines). The examined interval extends from the syntenic human chromosomal region (position 71,537,304 to 71,716,227) corresponding to the albuminuria-associated haplotype on mouse Chr 3 (position 156,918,173 to 157,022,996, shown in red) and spans 50 kb upstream of NEGR1’s transcription start site. rs6671557 is located at position 71,992,909 (IVS3+21,534 relative to NEGR1). The entire candidate chromosomal interval on human chromosome 1p maps to mouse Chr 3 (indicated in gray). (B) Association data for 368 tag SNPs (71 genotyped and 297 imputed SNPs) analyzed in the GoKinD collection are shown across the human chromosome 13q candidate gene interval (position 107,996,501 to 109,154,781). This interval includes the syntenic human chromosomal region (position 108,621,676 to 109,154,781), corresponding to the albuminuria-associated haplotype on mouse Chr 8 (position 10,596,101 to 10,950,911), and extends 50 kb upstream of the MYO16 gene. rs1411766 is located at position 109,050,161. The 2 nearest genes, MYO16 and IRS2, are located approximately 384 kb centromeric and 120 kb telomeric of rs1411766. The candidate chromosomal interval on human chromosome 13q solely maps to mouse Chr 8 (indicated in gray).
DISCUSSION
Our project objectives were to investigate the genetics of the progression of kidney damage as measured by the ACR in aging mice, and to identify candidate genes. Our strategy included HAM, a recently developed approach that uses haplotypes reconstructed from high-density SNP data sets to look for associations between chromosomal regions and a particular trait of interest. We previously used HAM to confirm several reported QTL for HDL cholesterol levels and cholesterol gallstones.13 Because of the higher resolution of HAM versus linkage mapping, in addition to confirming these associations, we more precisely mapped these loci to smaller genomic intervals and identified putative candidate genes within these regions.
Using HAM, we identified a total of 9 loci associated with albuminuria, and hence renal damage, in aging mice. The stringent method we used to establish the threshold for significance in our analysis identified one significant peak (α<0.05) and 8 association peaks (α<0.20). After close examination of individual strain haplotypes, we determined these to be true associations. Because the HAM methodology is still in its infancy, the most appropriate multiple testing correction method to determine thresholds for significance is still unknown. Because of this uncertainty, and to avoid the risk of inflation of a type I error in applying a more liberal threshold, it is very likely that the method we used for these calculations in our analysis is too conservative given the co-segregation of highly-correlated SNPs within each haplotype block.14 The impact of missing data on our finding depends on the pattern. For strains with missing ACR data that probably would have been high, we would have underestimated the significance of certain haplotype regions. For example, in both KK and MRL mice, the ACR at 18 months is much higher than at 12 months, and it is likely that these 2 strains would still have high ACR at 24 months. Missing these 2 strains at 24 months would have reduced our power to detect significant haplotype regions and increased our chance of false negative findings.
Each of the albuminuria-associated intervals contains from one to as many as 7 known genes. Although some of these genes have no reported associations with kidney-related phenotypes, several, including Fn1 and Aspa, have been implicated in the pathogenesis of age-related kidney damage. Fn1, on Chr 1, is a very interesting candidate gene that has recently been linked to glomerulopathy with fibronectin deposits (GFND, MIM 601894) in humans. First described by Strom et al., this heritable kidney disease is characterized by proteinuria, microscopic hematuria, and hypertension that ultimately progresses to end-stage renal disease (ESRD).15 Recently, 3 heterozygous missense mutations (W1925R, L1974R, and Y973C) in human FN1 have been identified as the cause of GFND in 6 unrelated pedigrees.16 Aspa, on Chr 11, encodes aspartoacyclase. Mutations in the human gene are known to cause Canavan disease, a neurodegenerative disorder that leads to the spongy degeneration and astrocytic swelling of neuronal cells.17 Interestingly, Aspa is highly expressed in the kidney and, moreover, Aspa−/− mice show an 18% increase in lipid incorporation in the kidney.18 Although these mice have not been tested for albuminuria, this increase in lipid could lead to renal damage with albuminuria.19
In mice, both genetic background and sex have been identified as determinants of the rate of progression of age-related kidney damage.1 We observed a high degree of variability with the progression of ACR over time between both strain and sex. We do not observe a general trend toward higher ACR and a faster increase in ACR in males, but conclude that these phenotypes are highly strain dependent (Figure 2). The sex differences in kidney damage between males and females could be influenced by androgen and estrogen. For example, damage to the kidney with age, including vascular changes, can be limited by castration or estrogen treatment in males.20, 21 As these differences are clearly strain dependent, this suggests that the underlying genetic factors we identify in genetic studies are either interacting themselves with these hormones or affecting pathways that are influenced by androgen and estrogen.
Using QTL analysis to compare our HAM results with previously identified loci for albuminuria and renal damage related parameters (Figure 5), we see overlaps at only 4 QTL (chromosomes 2, 4, 7, and 11). This is not entirely surprising, as these QTL analyses were performed using relatively young mice (between 3 and 5 months). Therefore, these studies were primarily designed to identify loci involved in early onset albuminuria. More remarkably, as the ultimate goal of genetic studies using animal models is to find genes that are relevant in human disease, is the concordance between 2 of the 9 mouse loci identified using HAM and homologous human chromosomal regions identified in our analysis of GWAS data from the GoKinD collection (Figure 5). We observed the strongest association among these concordant findings at a SNP located in an intergenic region on human chromosome 13q and within the syntenic albuminuria-associated locus identified on mouse Chr 8 between Myo16 and Irs2. Interestingly, significant evidence of linkage was also recently identified at this same locus in studies of patients with non-diabetic ESRD and all-cause ESRD. 22, 23 We observed a second significant association at a SNP within intron 3 of NEGR1 on human chromosome 1p, a region syntenic to the albuminuria-associated locus identified on mouse Chr 3. Although no evidence of association was observed in our analysis of the GoKinD data among the remaining loci identified in our study, evidence of linkage has been reported at 3 syntenic loci in other human studies of nephropathy.24-26 Specifically, Schelling et al. found significant evidence of linkage with glomerular filtration rate in patients with type 2 diabetes at position 71.24 to 75.95 Mb on human chromosome 18, a region homologous to the mouse chromosome 18 locus identified in our study. 26 Loci identified by Puppala et al. (position 213.38 to 236.13 Mb on human chromosome 2) and Chen et al. (position 0.00 to 14.60 Mb on human chromosome 17) in diabetes-associated nephropathy in human are syntenic to our albuminuria-associated loci on mouse chromosomes 1 and 11, respectively.24, 25 Additionally, we have also recently reported significant linkage near the human locus syntenic to the HAM signal on mouse chromosome 1 (position 195.00 to 213.00 Mb on human chromosome 2).27
Figure 5. Mouse chromosomal map indicating significant HAM peaks (first letter is the sex, number is the age in months) for previously found QTL related to renal damage QTL in the mouse.

Bars represent the 95% confidence interval. Within the bars, black stripes indicate the peak marker of the QTL, and the number indicates the cross in which the QTL was found. The 5 significant GWAS loci found in the GoKinD collection are indicated in uppercase italic text with the name of the nearest gene. Two loci are concordant with HAM peaks, and one locus (FRMD3) is concordant with 3 QTL found in mouse crosses. QTL crosses: 1. (C57BL/6J x 129S6)F237, 2. (NZW x PL/J)F1 x NZB38, 3. (C57BL/6J x A/J)F28, 4. (C57BL/6J x DBA/2J)F27, 4. KK x (Balb/c x KK)F139, 6. (129S1 x C57BL/6J)F1 x 129S140, 7. (C57BL/6J x NZM)F1 x NZM28, 8. (FGS x C57BL/6J)F1 x FGS41, 9. BXD RI42.
Our imputation of un-genotyped SNPs in the GoKinD collection allowed us to fine-map each of the homologous human chromosomal intervals for our mouse loci. More specifically, our analysis of these data identified several variants in strong linkage disequilibrium (r2>0.80) with the leading SNPs on chromosomes 1 (rs6671557) and 13 (rs1411766) (Supplemental Table 1). In total, 21 highly-correlated SNPs were identified in a 172.4 kb region spanning introns 2, 3, and 4 of NEGR1, while 5 SNPs were identified in a 21.4 kb intergenic region at the MYO16-IRS2 locus. Although additional analysis is necessary to pinpoint the causative variants at these regions, including re-sequencing of these regions (to uncover additional correlated SNPs) and functional interrogation of these variants, our analysis of these data provide a subset of candidates SNPs for further investigation at each of these loci.
For each interval, experimental genotypes in the GoKinD collection were enhanced by the imputation of un-genotyped SNPs using MaCH (www.sph.umich.edu/csg/abecasis/MACH/). We identified a total of 4,329 SNPs (including 671 genotyped SNPs and 3,658 imputed HapMap SNPs) across these 9 loci.
In the present study, we did not find associations in the mouse for the homologous loci on human 7p (near CPVL/CHN2), 9q (near FRMD3) and 11p (near CARS) that were recently shown to be significantly associated with DN in the GoKinD collection.11 Interestingly, the concordant region for the 9q locus is located near the peak markers on Chr 4 for albuminuria QTL, identified in 2 different intercross populations, (C57BL/6J x A/J)F28 and (C57BL/6J x DBA/2J)F2,7 and a proteinuria QTL identified in a backcross population, (C57BL/6J x NZM)F1 x NZM.28
Concordance between mice and humans at these associated loci suggests that the same underlying genes within these regions contribute to kidney disease. Interestingly, as with each of the albuminuria-associated loci identified using HAM, the 2 concordant loci are sex-specific in mice. We analyzed the GoKinD data to see if similar effects were also present in human data, and found no significant differences in allele frequencies between male and female patients. It is possible that such an effect is present, but that because of the ‘outbred’ structure of this human population, we are not able to detect differences between males and females over time. It could also be that, although sex differences clearly play a significant role in mice, no sex differences exist between alleles at these same loci in humans. Once we identify the underlying genes and the mechanism responsible for the sex difference in mice (e.g., estrogen regulatory elements in the promoter), we will be able to more successfully examine possible sex-specific effects in humans.
Apart from unique loci between males and females, we also do not see overlap between loci at the different time points. Two explanations are possible: First, different genes could be involved at different stages in the disease process. Or second, because different strains are affected at different time points, different genes could be determining the difference between affected and non-affected mice.
Why do we find overlap of loci associated with proteinuria in human diabetic patients and loci associated with albuminuria in aging mice? The most likely explanation is that these loci are part of a common pathway for renal disease. There is some evidence that these kinds of pathways exist. One example is the NFkB pathway, which is increasingly activated in glomeruli with age and which plays a role in glomerular failure.29 Some authors showed that this same pathway was activated in diabetic nephropathy.30 Maybe the diabetic environment has the same effect on these pathways as aging, or maybe it even accelerates the progression of renal disease: Gurley et al31 and Qi et al32 showed that, in several of the same inbred strains we used in our study, inducing a diabetic environment accelerates albuminuria. The concordance of mouse and rat QTL for renal damage, while using different models of disease (hypertension, SLE, hyperlipidemia), also argues that common genes lead to damage.6
In contrast to QTL studies, the haplotype association mapping of ACR in inbred strains presented here allows for the identification of small genomic intervals associated with renal damage. Of course, even these regions require further narrowing before we can definitively identify candidate genes. However, the concordance between our findings in mice and those in humans suggests that the genes underlying kidney disease are highly conserved between both species. And, this conservation allows us to combine both mouse and human data to more precisely localize the candidate disease genes within the genomic regions. Now, mouse-human comparative mapping, region specific haplotyping, additional mouse crosses, gene sequencing and gene expression studies in both mice and humans can be used to more readily identify the causal genes. Once identified, the powerful genetic tools in the mouse, including both knockout and transgenic technology, can be used to test the effect of gene function (or dysfunction) on the kidney.
MATERIALS AND METHODS
Mice and Phenotype Characterization
Groups of 10 males and 10 females from 30 different inbred strains (Table 1) were obtained from The Jackson Laboratory, Bar Harbor, ME. If any of the mice died during the experiment they were replaced with mice from the same strain. We housed mice in a climate-controlled facility with a 12-hour:12-hour light-dark cycle and provided free access to food and water throughout the experiment. After weaning, we maintained mice on a chow diet (Lab diet 5K52, PMI Nutritional International, Bentwood, Mo). We took urine samples at 12, 18, and 24 months, and measured albumin and creatinine concentrations on a Beckman Synchron CX5 Chemistry Analyzer. Actual mouse albumin concentrations were calculated by linear regression from a standard curve generated with mouse albumin standards (Kamiya Biomedical Company, Seattle, WA). All experiments were approved by The Jackson Laboratory’s Animal Care and Use Committee.
Haplotype Association Mapping
We selected SNPs from the following sources: The Jackson Laboratory, Oxford, Merck, GNF and Perlegen (see www.jax.org/phenome for detailed information on the sources). We divided the mouse genome into non-overlapping 40 kb intervals, and in each interval, selected one SNP based on the following criteria: high number of polymorphisms among 25 widely used classical laboratory strains, few missing genotypes, and even distribution across the genome. A total of 63,222 SNPs were selected. Genotypes that were missing in this set (due to technical failures for some of the SNP markers for some of the strains) were imputed based on the close relatedness of the strains. Missing genotypes are imputed at each SNP locus as the allele by hidden Markov model (HMM). The strong linkage disequilibrium found in dense set of SNP markers in the laboratory mouse provides the basis for accurate imputation based on observed genotypes. An HMM was applied, fitting 5 states at each SNP, for the primary purpose of missing genotype imputation and for the secondary purpose of haplotype identification.33 A total of 580,781 missing genotypes (28.70%) were imputed for this particular dataset. All SNPs with imputed genotypes had a confidence score over 0.6, and the average filling accuracy of the imputed genotypes across the whole genome was 89.9%.
At each SNP, we determined a strain distribution pattern (SDP) using the HMM smoothed haplotype states (HMMpath). We computed F-test statistics to measure the strength of association between genotype and phenotype. Its significance was estimated to detect haplotype groups with different mean phenotypes. The segregation of strains into haplotype groups varied widely over haplotype blocks; therefore P-values of the F test statistic were compared between haplotype blocks. We controlled the type I error rate for multiple testing due to genome-wide searching using family-wise error rate control (FWER).34 We shuffled the strain label in the phenotype data and kept the genotype data intact. The minimum P-value was recorded on each permutation; percentiles of their distribution were used to provide approximate multiple test-adjusted thresholds. The genome-wide type I error thresholds were estimated based on 1000 permutation tests. Peaks corresponding to P-value thresholds adjusted for global significance were defined as significant at α<0.05 level. Due to the close genetic relationship between genomes of inbred laboratory strains, HAM analysis has limited power to detect small genetic effects. Furthermore, FWER methods generally yield conservative results. To detect peaks that have small, but biologically relevant, genetic effects, we chose to relax the protection against type I errors and consider HAM peaks that exceeded an alpha of 0.20 to be suggestive evidence of true genetic association. All analysis was done in the MATLAB computing environment (The Mathworks, http://www.mathworks.com), except the imputation of missing genotypes.
Analysis of Diabetic Nephropathy-Associated Loci in GWAS data from the GoKinD Collection
We confirmed our findings in aging mice using GWAS data from the GoKinD collection for syntenic human chromosomal regions corresponding to the 9 albuminuria-associated loci identified using HAM.11 A detailed description of the GoKinD collection, a large case-control population assembled to aid the identification of genetic factors associated with DN in T1D, has been published elsewhere.35 Briefly, subjects for the GoKinD collection were recruited through 2 centers: the George Washington University (GWU) Biostatistics Center and the Section of Genetics and Epidemiology at the Joslin Diabetes Center (JDC). All subjects enrolled in GoKinD had T1D diagnosed before age 31, began insulin treatment within one year of their diagnosis, and were between 18 and 59 years of age at the time of enrollment. Controls had T1D for at least 15 years, and persistent normoalbuminuria cases with DN had either persistent proteinuria or end stage renal disease (dialysis or renal transplant).
Genotypes of the GoKinD collection were generated with the Affymetrix 5.0 500K SNP Array by the GAIN genotyping laboratory at the Eli and Edythe L. Broad Institute. Quality control measures, including the analysis of population substructure, resulted in 359,193 autosomal SNPs and 1,705 Caucasian subjects (885 controls and 820 cases, 284 with proteinuria and 536 with ESRD) suitable for statistical analysis. Additional information on the clinical characteristics of cases and controls used in the analysis, as well as the generation of the GWAS data for the GoKinD collection, is provided in our previous publication.11 Additionally, rs6671557 was genotyped in the GoKinD collection using Taqman (Applied Biosystems, Foster City, CA) technology by the Genetics Core of the Diabetes and Endocrinology Research Center at the JDC in accordance with the manufacturer’s protocols. DNA samples used for genotyping this SNP in the GoKinD collection were obtained through the National Institute of Diabetes and Digestive and Kidney Diseases Central Repository (www.niddkrepository.org/).
We identified syntenic human chromosomal regions for each of the 9 albuminuria-associated loci using the Ensembl Genome Browser (www.ensembl.org/, Ensembl Homo sapiens version 52.36n, NCBI Build 36.1 and Ensembl Mus musculus version 52.37e, NCBI Build 37.1). We expanded candidate gene intervals to include the entire sequence (including 50 kb of flanking sequence) of all genes partially contained within these homologous regions. For each interval, experimental genotypes in the GoKinD collection were enhanced by the imputation of un-genotyped SNPs using MaCH (www.sph.umich.edu/csg/abecasis/MACH/). We identified a total of 4,329 SNPs (including 671 genotyped SNPs and 3,658 imputed HapMap SNPs) across these 9 loci. To minimize redundancy among highly correlated SNPs, we used the Haploview software program (www.broad.mit.edu/mpg/haploview/) to assign these SNPs to 1,085 distinct linkage disequilibrium bins and select tagging SNPs, using an r2 threshold>0.80.36 Statistical association analyses among these tag SNPs were performed using an additive allelic test of association using the Cochran-Mantel-Haenszel procedure, stratified by sex and GoKinD sub-collection (JDC and GWU), as implemented in PLINK.36
Supplementary Material
ACKNOWLEDGEMENTS
This work was funded by DK77532 (A.S.K.), DK007260-31 (M.G.P.), and DK069381 (R.K.) from the NIDDK, by 06GAIN0 (J.H.W.) from the FNIH, the Nathan Shock Center grant AG 25707 from the National Institute of Aging, NIH, by AG-NS-0421-07 (S.-W.T) from the Ellison Medical Foundation, and by a Glenn Award for Research in Biological Mechanisms of Aging (S.-W.T.) from the Glenn Foundation for Medical Research.. We thank David Schultz, Dana Godfrey, Milly So, Sue Grindle, Neeta Kumari, Yueming Ding, and Phyllis Magnani for excellent technical assistance; Joanne Currer for writing assistance; and Jesse Hammer for preparation of the figures.
Footnotes
DISCLOSURES
None.
REFERENCES
- 1.Martin JE, Sheaff MT. Renal ageing. J Pathol. 2007;211:198–205. doi: 10.1002/path.2111. [DOI] [PubMed] [Google Scholar]
- 2.Lindeman RD, Tobin J, Shock NW. Longitudinal studies on the rate of decline in renal function with age. J Am Geriatr Soc. 1985;33:278–285. doi: 10.1111/j.1532-5415.1985.tb07117.x. [DOI] [PubMed] [Google Scholar]
- 3.Epstein M, Hollenberg NK. Age as a determinant of renal sodium conservation in normal man. J Lab Clin Med. 1976;87:411–417. [PubMed] [Google Scholar]
- 4.McLachlan MS, Guthrie JC, Anderson CK, Fulker MJ. Vascular and glomerular changes in the ageing kidney. J Pathol. 1977;121:65–78. doi: 10.1002/path.1711210202. [DOI] [PubMed] [Google Scholar]
- 5.Anderson S, Brenner BM. Effects of aging on the renal glomerulus. Am J Med. 1986;80:435–442. doi: 10.1016/0002-9343(86)90718-7. [DOI] [PubMed] [Google Scholar]
- 6.Korstanje R, DiPetrillo K. Unraveling the genetics of chronic kidney disease using animal models. Am J Physiol Renal Physiol. 2004;287:F347–352. doi: 10.1152/ajprenal.00159.2004. [DOI] [PubMed] [Google Scholar]
- 7.Sheehan S, Tsaih SW, King BL, Stanton C, et al. Genetic analysis of albuminuria in a cross between C57BL/6J and DBA/2J mice. Am J Physiol Renal Physiol. 2007;293:F1649–1656. doi: 10.1152/ajprenal.00233.2007. [DOI] [PubMed] [Google Scholar]
- 8.Doorenbos C, Tsaih SW, Sheehan S, Ishimori N, et al. Quantitative trait loci for urinary albumin in crosses between C57BL/6J and A/J inbred mice in the presence and absence of Apoe. Genetics. 2008;179:693–699. doi: 10.1534/genetics.107.085142. [DOI] [PMC free article] [PubMed] [Google Scholar]
- 9.Tsaih S, Korstanje R. Haplotype Association Mapping in Mice. In: DiPetrillo K, editor. Methods in Molecular Biology: Cardiovascular Genomics. Humana Press; 2009. [DOI] [PubMed] [Google Scholar]
- 10.Harrill AH, Watkins PB, Su S, Ross PK, et al. Mouse population-guided resequencing reveals that variants in CD44 contribute to acetaminophen-induced liver injury in humans. Genome Res. 2009 doi: 10.1101/gr.090241.108. [DOI] [PMC free article] [PubMed] [Google Scholar]
- 11.Pezzolesi MG, Poznik GD, Mychaleckyj JC, Paterson AD, et al. Genome-wide association scan for diabetic nephropathy susceptibility genes in type 1 diabetes. Diabetes. 2009;58:1403–1410. doi: 10.2337/db08-1514. [DOI] [PMC free article] [PubMed] [Google Scholar]
- 12.Pezzolesi MG, Poznik GD, Mychaleckyj JC, Paterson AD, et al. Genome-wide Association Scan for Diabetic Nephropathy Susceptibility Genes in Type 1 Diabetes Mellitus. Diabetes. 2009 doi: 10.2337/db08-1514. [DOI] [PMC free article] [PubMed] [Google Scholar]
- 13.Pletcher MT, McClurg P, Batalov S, Su AI, et al. Use of a dense single nucleotide polymorphism map for in silico mapping in the mouse. PLoS Biol. 2004;2:e393. doi: 10.1371/journal.pbio.0020393. [DOI] [PMC free article] [PubMed] [Google Scholar]
- 14.Payseur BA, Place M. Prospects for association mapping in classical inbred mouse strains. Genetics. 2007;175:1999–2008. doi: 10.1534/genetics.106.067868. [DOI] [PMC free article] [PubMed] [Google Scholar]
- 15.Strom EH, Banfi G, Krapf R, Abt AB, et al. Glomerulopathy associated with predominant fibronectin deposits: a newly recognized hereditary disease. Kidney Int. 1995;48:163–170. doi: 10.1038/ki.1995.280. [DOI] [PubMed] [Google Scholar]
- 16.Castelletti F, Donadelli R, Banterla F, Hildebrandt F, et al. Mutations in FN1 cause glomerulopathy with fibronectin deposits. Proc Natl Acad Sci U S A. 2008;105:2538–2543. doi: 10.1073/pnas.0707730105. [DOI] [PMC free article] [PubMed] [Google Scholar]
- 17.Namboodiri AM, Peethambaran A, Mathew R, Sambhu PA, et al. Canavan disease and the role of N-acetylaspartate in myelin synthesis. Mol Cell Endocrinol. 2006;252:216–223. doi: 10.1016/j.mce.2006.03.016. [DOI] [PubMed] [Google Scholar]
- 18.Madhavarao CN, Arun P, Moffett JR, Szucs S, et al. Defective N-acetylaspartate catabolism reduces brain acetate levels and myelin lipid synthesis in Canavan’s disease. Proc Natl Acad Sci U S A. 2005;102:5221–5226. doi: 10.1073/pnas.0409184102. [DOI] [PMC free article] [PubMed] [Google Scholar]
- 19.Mazzolai L, Korber M, Bouzourene K, Aubert JF, et al. Severe hyperlipidemia causes impaired renin-angiotensin system function in apolipoprotein E deficient mice. Atherosclerosis. 2006;186:86–91. doi: 10.1016/j.atherosclerosis.2005.07.017. [DOI] [PubMed] [Google Scholar]
- 20.Baylis C. Age-dependent glomerular damage in the rat. Dissociation between glomerular injury and both glomerular hypertension and hypertrophy. Male gender as a primary risk factor. J Clin Invest. 1994;94:1823–1829. doi: 10.1172/JCI117531. [DOI] [PMC free article] [PubMed] [Google Scholar]
- 21.Maric C, Sandberg K, Hinojosa-Laborde C. Glomerulosclerosis and tubulointerstitial fibrosis are attenuated with 17beta-estradiol in the aging Dahl salt sensitive rat. J Am Soc Nephrol. 2004;15:1546–1556. doi: 10.1097/01.asn.0000128219.65330.ea. [DOI] [PubMed] [Google Scholar]
- 22.Freedman BI, Bowden DW, Rich SS, Valis CJ, et al. A genome scan for all-cause end-stage renal disease in African Americans. Nephrol Dial Transplant. 2005;20:712–718. doi: 10.1093/ndt/gfh704. [DOI] [PubMed] [Google Scholar]
- 23.Freedman BI, Langefeld CD, Rich SS, Valis CJ, et al. A genome scan for ESRD in black families enriched for nondiabetic nephropathy. J Am Soc Nephrol. 2004;15:2719–2727. doi: 10.1097/01.ASN.0000141312.39483.4F. [DOI] [PubMed] [Google Scholar]
- 24.Puppala S, Arya R, Thameem F, Arar NH, et al. Genotype by diabetes interaction effects on the detection of linkage of glomerular filtration rate to a region on chromosome 2q in Mexican Americans. Diabetes. 2007;56:2818–2828. doi: 10.2337/db06-0984. [DOI] [PubMed] [Google Scholar]
- 25.Chen G, Adeyemo AA, Zhou J, Chen Y, et al. A genome-wide search for linkage to renal function phenotypes in West Africans with type 2 diabetes. Am J Kidney Dis. 2007;49:394–400. doi: 10.1053/j.ajkd.2006.12.011. [DOI] [PubMed] [Google Scholar]
- 26.Schelling JR, Abboud HE, Nicholas SB, Pahl MV, et al. Genome-wide scan for estimated glomerular filtration rate in multi-ethnic diabetic populations: the Family Investigation of Nephropathy and Diabetes (FIND) Diabetes. 2008;57:235–243. doi: 10.2337/db07-0313. [DOI] [PubMed] [Google Scholar]
- 27.Placha G, Poznik GD, Dunn J, Smiles A, et al. A genome-wide linkage scan for genes controlling variation in renal function estimated by serum cystatin C levels in extended families with type 2 diabetes. Diabetes. 2006;55:3358–3365. doi: 10.2337/db06-0781. [DOI] [PubMed] [Google Scholar]
- 28.Morel L, Rudofsky UH, Longmate JA, Schiffenbauer J, et al. Polygenic control of susceptibility to murine systemic lupus erythematosus. Immunity. 1994;1:219–229. doi: 10.1016/1074-7613(94)90100-7. [DOI] [PubMed] [Google Scholar]
- 29.Wiggins J, Patel S, Shedden K, Goyal M, et al. ASN. Philadelphia: 2008. Unbiased demonstration of linear NFkB activation during glomerular aging; pp. 181A–182A. [Google Scholar]
- 30.Schmid H, Boucherot A, Yasuda Y, Henger A, et al. Modular activation of nuclear factor-kappaB transcriptional programs in human diabetic nephropathy. Diabetes. 2006;55:2993–3003. doi: 10.2337/db06-0477. [DOI] [PubMed] [Google Scholar]
- 31.Gurley SB, Clare SE, Snow KP, Hu A, et al. Impact of genetic background on nephropathy in diabetic mice. Am J Physiol Renal Physiol. 2006;290:F214–222. doi: 10.1152/ajprenal.00204.2005. [DOI] [PubMed] [Google Scholar]
- 32.Qi Z, Fujita H, Jin J, Davis LS, et al. Characterization of susceptibility of inbred mouse strains to diabetic nephropathy. Diabetes. 2005;54:2628–2637. doi: 10.2337/diabetes.54.9.2628. [DOI] [PubMed] [Google Scholar]
- 33.Szatkiewicz JP, Beane GL, Ding Y, Hutchins L, et al. An imputed genotype resource for the laboratory mouse. Mamm Genome. 2008;19:199–208. doi: 10.1007/s00335-008-9098-9. [DOI] [PMC free article] [PubMed] [Google Scholar]
- 34.Westfall P, Young S. Resampling-Based Multiple Testing. 1 edition edn. Wiley-Interscience; New York: 1993. [Google Scholar]
- 35.Mueller PW, Rogus JJ, Cleary PA, Zhao Y, et al. Genetics of Kidneys in Diabetes (GoKinD) study: a genetics collection available for identifying genetic susceptibility factors for diabetic nephropathy in type 1 diabetes. J Am Soc Nephrol. 2006;17:1782–1790. doi: 10.1681/ASN.2005080822. [DOI] [PMC free article] [PubMed] [Google Scholar]
- 36.Barrett JC, Fry B, Maller J, Daly MJ. Haploview: analysis and visualization of LD and haplotype maps. Bioinformatics. 2005;21:263–265. doi: 10.1093/bioinformatics/bth457. [DOI] [PubMed] [Google Scholar]
- 37.Salzler HR, Griffiths R, Ruiz P, Chi L, et al. Hypertension and albuminuria in chronic kidney disease mapped to a mouse chromosome 11 locus. Kidney Int. 2007;72:1226–1232. doi: 10.1038/sj.ki.5002519. [DOI] [PMC free article] [PubMed] [Google Scholar]
- 38.Rahman ZS, Tin SK, Buenaventura PN, Ho CH, et al. A novel susceptibility locus on chromosome 2 in the (New Zealand Black x New Zealand White)F1 hybrid mouse model of systemic lupus erythematosus. J Immunol. 2002;168:3042–3049. doi: 10.4049/jimmunol.168.6.3042. [DOI] [PubMed] [Google Scholar]
- 39.Shike T, Gohda T, Tanimoto M, Kobayashi M, et al. Chromosomal mapping of a quantitative trait locus for the development of albuminuria in diabetic KK/Ta mice. Nephrol Dial Transplant. 2005;20:879–885. doi: 10.1093/ndt/gfh665. [DOI] [PubMed] [Google Scholar]
- 40.Kato N, Watanabe Y, Ohno Y, Inoue T, et al. Mapping quantitative trait loci for proteinuria-induced renal collagen deposition. Kidney Int. 2008;73:1017–1023. doi: 10.1038/KI.2008.7. [DOI] [PubMed] [Google Scholar]
- 41.Kim EH, Lee CH, Hyun BH, Suh JG, et al. Quantitative trait loci for proteinuria in the focal glomerulosclerosis mouse model. Mamm Genome. 2005;16:242–250. doi: 10.1007/s00335-004-3023-7. [DOI] [PubMed] [Google Scholar]
- 42.Zidek V, Musilova A, Vorlieek J, Simakova M, et al. Quantitative trait loci for compensatory renal hypertrophy in the mouse. Biochem Biophys Res Commun. 1998;248:473–475. doi: 10.1006/bbrc.1998.8901. [DOI] [PubMed] [Google Scholar]
Associated Data
This section collects any data citations, data availability statements, or supplementary materials included in this article.