

Abstract
Objective
This study was performed to assess adult human bone marrow mesenchymal stem/progenitor cells at a single cell level and to determine a hierarchy based on proliferative potential.
Methods
Adult bone marrow mesenchymal cells expressing the enhanced green fluorescent protein (EGFP) were sorted as single cells into 24-well plates, each well confirmed with single EGFP-positive cells by fluorescence microscopy, and counted every three days. Colonies derived from single cells were expanded then sorted and evaluated using established differentiation protocols for adipogenic, chondrogenic, and osteogenic lineages. Cells were further analyzed by real-time RT-PCR (PPARγ2, LEP, LPL, LUM, COMP, BIG, CBFA1, IBSP, BGLAP) and immunocytochemistry (PPARγ1/2, Collagen II, Bone Sialoprotein II) specific for tri-lineage differentiation.
Results
Bone marrow mesenchymal cells were found to contain high proliferative potential-mesenchymal colony-forming cells (HPP-MCFC, 7%), low proliferative potential-mesenchymal colony-forming cells (LPP-MCFC, 29%), mesenchymal cell clusters (MCC, 26%), and mature mesenchymal cells (MMC, 38%). All LPP-MCFC, MCC, and MMC colonies reached senescence at the end of the evaluation period. However, HPP-MCFC continued to grow, showed differentiation toward all three lineages, and demonstrated the capacity to give rise to secondary HPP-MCFC upon replating at a clonal level.
Conclusion
These findings suggest that there is a low frequency of bone marrow derived HPP-MCFC that can both self-renew at a single cell level and differentiate toward multiple lineages of mesenchymal origin.
INTRODUCTION
The hierarchy used for identifying hematopoietic and endothelial progenitors provides a unique quantitative method for assessing the degree of heterogeneity in stem cell cultures and may offer important insights into mesenchymal stem cell (MSC) biology. Hematopoietic high proliferative potential-colony forming cells (HPP-CFC) obtained from both mouse and human bone marrow have been shown to form large colonies (~50,000 cells) in double-layer agar cultures and differentiate into multiple hematopoietic cell types [1–3]. Low proliferative potential-colony forming cells (LPP-CFC) are defined as hematopoietic cells that can grow into colonies smaller than HPP-CFC but greater than 50 cells [3]. HPP-CFC have been further characterized and identified as the most primitive hematopoietic progenitor cells that can be assayed in vitro [4]. This paradigm for classifying different cell types based on their proliferative potential has been instrumental in identifying a hierarchy of circulating endothelial progenitor cells (EPC). Ingram et al. [5] identified four distinct cell types in EPC cultures that included high proliferative potential-endothelial colony forming cells (HPP-ECFC), low proliferative potential-endothelial colony forming cells (LPP-ECFC), endothelial cell clusters, and mature differentiated endothelium. HPP-ECFC have been shown to give rise to all subsequent stages of endothelial progenitors as well as secondary and tertiary HPP-ECFC [5].
In this study, the methods used to identify HPP-CFC and HPP-ECFC were adapted to investigate the existence of high proliferative potential-mesenchymal colony forming cells (HPP-MCFC) and the differentiation potential of these cells toward adipogenic, chondrogenic, and osteogenic lineages at a single cell level. This study demonstrates for the first time that a complete hierarchy of mesenchymal cells can be described, and multipotent HPP-MCFC can form secondary colonies at a clonal level.
MATERIALS AND METHODS
Mesenchymal Cell Culture
Human bone marrow mononuclear cells (1×10⁷ cells obtained from Cambrex, NJ) from healthy donors (N=3; 1 female and 2 males 25±5 years) were plated on 100 mm plates in α-20 medium (α-MEM supplemented with 20% fetal bovine serum (FBS), 1% L-glutamine, and 1% penicillin-streptomycin) and incubated at 37°C in 5% CO2. Plates were washed with phosphate buffered saline (PBS) three times every other day until cells reached ~80% confluence (approximately 1×10⁶ cells in 100 mm plates). Cells were then washed with PBS and incubated with 0.25% trypsin-EDTA (Gibco, Carlsbad, CA) for 5 min at 37°C, and then replated in α-20 medium at 5×10³ cells/cm2. A bank of cryopreserved mesenchymal cells from each donor was established at the end of the first passage and used for single cell sorting and culturing cell feeders. The overall plating protocol is shown in Figure 1.
Figure 1. Plating Protocol.
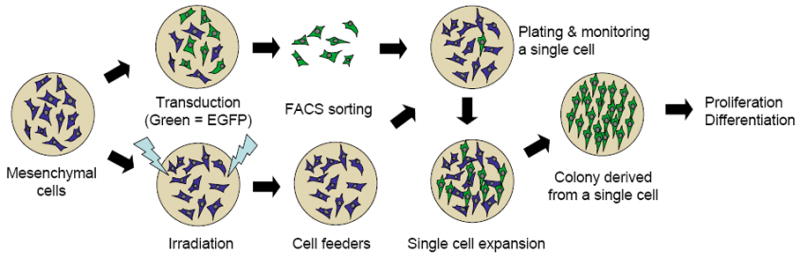
The overall plan for cell plating is shown.
Preparation of Mesenchymal Cell Feeders
Since MSC only grow in the presence of other cells an irradiated feeder layer was developed to allow single cell growth and differentiation. Cryopreserved mesenchymal cells were thawed and plated at 5×10³ cells/cm2 in 100 mm plates with α-20 medium and grown to ~80% confluence, as described above. Cells were washed with PBS and incubated with 0.25% trypsin-EDTA for 5 min at 37°C. α-20 medium was added to cells in at least a 1:1 ratio to trypsin in order to inactivate. Cells were collected, washed in fresh medium, and irradiated using a gamma irradiator (J. L. Shepherd & Associates, CA) at 3,000 rads.
Transduction and Sorting
Cryopreserved mesenchymal cells were thawed and transduced with an HIV-1-derived lentiviral vector (1×10⁶ infectious particles/ml) expressing the enhanced green fluorescent protein (EGFP) or red fluorescent protein (RFP) under the control of the CMV promoter in medium containing 4 μg/ml polybrene as previously described [6]. Cells were incubated with the vector overnight at 37°C, then washed with PBS and replenished with new medium. After cells reached ~80% confluence, cells were trypsinized and stained with 1 μg/ml propidium iodide. EGFP-expressing mesenchymal cells that did not take up propidium iodide were sorted into 24-well plates with and without irradiated feeder cells at 1 cell/well using a MoFlo Cell sorter (Dako Cytomation, Carpinteria, CA) and incubated overnight at 37°C. On day 1 post-sorting each well was monitored for EGFP-positive cells under a fluorescence microscope equipped with an X–Y stage, and wells containing more than 1 cell were excluded from the study. Wells containing single cells were monitored and counted every 3 days and those that showed growth after 12 days in culture were trypsinized, counted using a hemacytometer, and passaged at 5×10³ cells/cm2. A subset of single fluorescent mesenchymal cell-derived colonies showing >10 population doublings were combined and again sorted into 24-well plates with irradiated feeder cells at 1 cell/well and incubated overnight at 37°C. Wells were verified to contain a single EGFP-positive cell and were monitored for growth for 13 days as described. RFP-positive cells were also cultured with EGFP-positive cells and used as a control to identify any possible cell fusion events.
Differentiation of Mesenchymal Cells
Fluorescent human mesenchymal cells derived from single cells and expanded with irradiated feeders were differentiated towards osteogenic, adipogenic, and chondrogenic lineages using Osteogenic, Adipogenic, and Chondrogenic Differentiation Medium (Lonza, Allendale, NJ) following the manufacturer’s recommendations and as previously described [6–8].
PCR Analysis
Total RNA was prepared from sorted EGFP-positive differentiated mesenchymal cells using the Qiagen RNeasy Micro kit (Qiagen, Valencia, CA); cDNA was synthesized using the Sensiscript RT kit (Qiagen). Real-time PCR was performed using the QuantiTect SYBR Green PCR kit (Qiagen) with the primers shown in Table 1. The primers for the EF1α analysis were EF1α-Forward (5′-GAC-CCA-CCA-ATG-GAA-GCA-G-3′) and EF1α-Reverse (5′-TGT-GGC-AAT-CCA-ATA-CAG-GG-3′). Amplification was performed in an ABI 7900 Sequence Detection System (Applied Biosystems, Foster City, CA). Signal copy numbers were calculated per copies EF1α based on a standard curve (r2 = 0.9997) [9].
Table 1.
Primers
| Accession # | Gene ID | Gene Name | Forward | Reverse |
|---|---|---|---|---|
| Adipogenic | ||||
| NM 015869.4 | Peroxisome Proliferative Activated | TTGACCCAGAAAGCGATTCC | AAAGTTGGTGGGCCAGAATG | |
| PPARγ2 | Receptor, gamma 2 | |||
| NM 000230.2 | Lep | Leptin | TGTGCCCATCCAAAAAGTCC | GTTTGGAGGAGACTGACTGCG |
| NM 000237.2 | LPL | Lipoprotein lipase | GCGCCCCGAGATGGA | TTAGGGCAAATTTACTTTCGATGTC |
| Chondrogenic | ||||
| NM 002345.3 | LUM | Lumican | GGTCAATCAACTTGAGAAGTTTGACA | GGTGGAAGACTGGTTTCTGAGATG |
| NM 000095.2 | COMP | Cartilage Oligomeric Matrix Protein | CTCCAGCTTCTACGTGGTCATG | TGGAAGACTTCACAGCCTTGAG |
| NM 001711.3 | BIG | Biglycan | CGGAACATGAACTGCATCGA | TCGAAGGCTCCAGGTTCAAA |
| Osteogenic | ||||
| NM 001024630.2 | Run-Related Transcription Factor 2, transcript variant 1 | |||
| RUNX2 | CCAACCCACGAATGCACTATC | TAGTGAGTGGTGGCGGACATAC | ||
| NM 004967.3 | IBSP | Bone Sialoprotein II | GCATGCCTACTTTTATCCTCATTTAA | TCTTCTGAACTGTCATCTCCATTTTC |
| NM 199173.3 | BGLAP | Osteocalcin | AAACCCAGCGGTGCAGAGT | GGCTCCCAGCCATTGATACA |
Immunocytochemistry
All primary and secondary antibodies were obtained from Millipore (Bilerica, MA). Chamber slides from adipogenic and osteogenic differentiation and sections from chondrogenic pellets were washed for 10 min in PBS then blocked with 1% bovine serum albumin (BSA) in PBS for 20 min. For adipogenic slides, one well was incubated with mouse monoclonal anti-human Peroxisome Proliferator-Activated Receptor (PPAR) γ1/γ2 (1:500 dilution) in 1% BSA for 1 h while the other well remained in 1% BSA as a control. Slides were then washed 3 times for 5 min in PBS and incubated for 1 h in goat anti-mouse Alexafluor 594 (Invitrogen, Carlsbad, CA). Osteogenic slides were incubated with rabbit polyclonal anti-human Bone Sialoprotein (BSP) II (1:100 dilution) in 1% BSA in one well and 1% BSA alone in the other for 1 h, followed by 5 min in PBS three times and 1 h of goat polyclonal anti-rabbit Alexafluor 594 (1:200 dilution) incubation. Chondrogenic sections were incubated for 1 h with rabbit anti-human Collagen (COL) II (1:10 dilution), then three 5 min washes in PBS and 1 h with goat anti-rabbit Alexafluor 594 (1:200 dilution) incubation. Control chondrogenic sections were incubated in 1% BSA without primary antibody. All slides were washed three times for 5 min in PBS, mounted with Prolong Gold Antifade and DAPI mounting solution (Invitrogen) and a coverslip placed. Fluorescent images were obtained with the Olympus BX61 microscope (Olympus, Melville, NY).
Flow Cytometry
A total of 2×10⁴ mesenchymal cells were suspended in 100 μl staining buffer (0.1% sodium azide in PBS) and stained with 5 μl CD14-PE (clone M5E2; BD), CD29-FITC (clone 4B4LDC9LDH8; Beckman Coulter, Fullerton, CA), CD34-PE (clone 563; BD), CD71-FITC (clone DF1513; Ancell, Bayport, MN), CD90-FITC (clone 5E10; BD), and SH3-FITC (American Type Culture Collection, Manassas, VA) antibodies at room temperature for 20 min. 5,000 events were acquired using a FACSCalibur Flow Cytometry System (Becton, Dickinson and Company, Biosciences, San Diego, CA) and analyzed with CellQuest software.
Karyotyping
Trypsinized mesenchymal cells were incubated in 0.05 μg/ml of colcemid for 20 min at 37°C and then in 0.075 M KCl for 15 min. Cells were fixed in solution containing methanol and glacial acidic acid (3:1). Cells were washed in fixative solution 3 times at 1,200 rpm for 8 min each and submitted to Genzyme (Genzyme Genetics, Orange, CA) for karyotyping.
Statistical Analysis
All studies were performed three times on bone marrow mesenchymal cells obtained from the mononuclear cells from three donors as described above. Results are reported as the mean ± standard error of the mean (SEM) and calculated using Microsoft Excel (Microsoft, Redmond, WA). Statistical significance (p<0.05) was determined by analysis of variance (ANOVA) or two-sided Student’s t-test analysis.
RESULTS
Growth of single mesenchymal cells
Single human bone marrow mesenchymal cells expressing EGFP were sorted and cultured with and without irradiated feeder cells for 12 days. EGFP positive cells were counted every three days. Based on population doublings, cells were categorized into four groups: HPP-MCFC (> 9 population doublings, Fig. 2A–D), low proliferative potential-mesenchymal colony forming cells (LPP-MCFC) (> 6 – 9, Fig. 2E–H), mesenchymal cell clusters (MCC) (> 3 – 6, Fig. 2I–L), and mature mesenchymal cells (MMC) (≤ 3, Fig. 2M–P). Single cells cultured without cell feeders did not grow beyond 6 population doublings, and a majority of these cells did not divide. Thus, irradiated cell feeders were added in all single mesenchymal cell cultures. Over 12 days in culture, single fluorescent HPP-MCFC proliferated to 1,916.9 ± 276.9 cells, which was significantly greater than LLP-MCFC (189.1 ± 14.3 cells), MCC (28.9 ± 2.9 cells), or MMC (2.3 ± 0.3 cells) (Fig. 3; p<0.05). Doubling time of HPP-MCFC (26.2 ± 0.4 h) was significantly shorter than routine heterogeneous adult bone marrow mesenchymal cell cultures (50.2 ± 1.6 h; p<0.01).
Figure 2. Fluorescence images of mesenchymal cell growth.

Images of EGFP expressing cells obtained on day 1 (A, E, I, M) post-sorting, day 3 (B, F, J, N), day 6 (C, G, K, O), and day 9 (D, H, L, P). Four distinct cell populations derived from single mesenchymal cells included high proliferative potential-mesenchymal colony forming cells (HPP-MCFC; A–D), low proliferative potential-mesenchymal colony forming cells (LPP-MCFC; E–H), mesenchymal cell clusters (MCC; I–L), and mature mesenchymal cells (MMC; M–P) which were observed over time in culture. Images shown in each row were taken from the same well over time.
Figure 3. Growth of single mesenchymal cells.
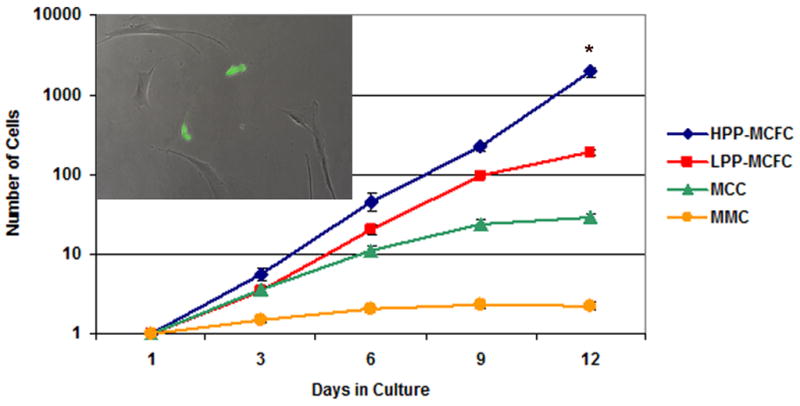
Single fluorescent mesenchymal cells expressing EGFP (green, insert) were sorted into 24-well plates with irradiated mesenchymal cells as feeders (EGFP-negative). The insert demonstrates the presence of two EGFP-expressing cells (day 3) within the irradiated feeder cells. EGFP-positive cells were counted every 3 days for 12 days. Wells containing ≥2 cells were excluded from the study. Single HPP-MCFC showed a significantly higher growth rate compared to LPP-MCFC, MCC, or MMC (p<0.05). All LPP-MCFC, MCC, and MMC reached senescence, whereas HPP-MCFC continued to proliferate. *p<0.05.
All fluorescent mesenchymal cells were sorted into each well and identified as a single cell and formed one of the four distinct colony types based on proliferation as described above. No cell death was observed over time in culture. Regarding frequency, 7% of single fluorescent cells grown on feeders were HPP-MCFC (13 colonies/180 single cells plated); whereas LPP-MCFC, MCC, and MMC occurred at a frequency of 29%, 26%, and 38%, respectively. All LPP-MCFC, MCC, and MMC showed limited proliferative potential and increased cytoplasm by 9 days in culture by visual observation (Fig. 2H, L, P). Specifically, most MMC did not divide whereas MCC showed 3–6 population doublings and reached senescence after 6 days in culture. ALL LPP-MCFC reached senescence by 12 days in culture. However, HPP-MCFC continued to grow and maintained a spindle-shaped morphology.
Cells were assayed and all found to be karyotypically normal. No significant differences in cell-surface marker expression were observed when cells were grown under routine mesenchymal cell culture conditions [10] and HPP-MCFC were compared by flow cytometry (positive for SH3, CD29, CD71, CD90; negative for CD14, CD34, CD45) (data not shown).
Differentiation of single cells
Fluorescent HPP-MCFC colonies derived from single cells were differentiated toward adipogenic, osteogenic, and chondrogenic lineages and confirmed by Oil-Red O (Fig. 4A), von Kossa (Fig. 4B), and Safranin O (Fig. 4C) staining, respectively. Since these staining methods lead to a loss of fluorescence in single mesenchymal cells, co-localization with EGFP was not possible. These staining methods showed efficient cellular differentiation. To identify single cell-derived mesenchymal cells from the feeder cells when differentiated, cells were stained with antibodies against PPARγ1/2 (adipogenic, 4D), BSP-II (osteogenic, 4E), and COL-II (chondrogenic, 4F). Co-localization of EGFP and PPARγ1/2, BSP-II, or COL-II in HPP-MCFC was observed in all cultures. To exclude the possibility of cell fusion, EGFP-positive mesenchymal cells were co-cultured with RFP-positive mesenchymal cells. No cell fusion (yellow cells) events were observed in all cell cultures examined (data not shown). Osteogenesis was observed in LPP-MCFC, MCC, and MMC, but no or very low adipogenesis was observed in these cell types (data not shown). A low number of LPP-MCFC was noted to express COL-II in chondrogenic cultures. These results suggest that single cell-derived mesenchymal cells (EGFP-positive) can differentiate into all three lineages investigated in this study.
Figure 4. Differentiation of mesenchymal cell clonal colonies.
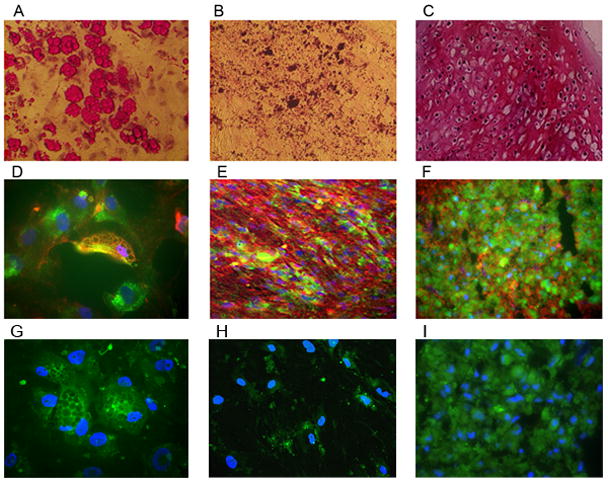
Colonies of fluorescent HPP-MCFC were differentiated toward adipogenic (A, D), osteogenic (B, E), and chondrogenic (C, F) lineages. Adipogenic-differentiated cells were stained with Oil Red-O (red channel only, A, 10X objective) and co-expressed PPAR γ1/γ2 (red, D, 40X objective) with the EGFP-HPP-MCFC. Osteogenic-differentiated cells were stained with Von Kossa (red channel only, B, 10X objective) and co-expressed BSP (red, E, 20X objective) with the EGFP-HPP-MCFC. Sections of chondrogenic-differentiated pellets were stained with Safranin-O (red channel only, C, 10X objective) and co-expressed Collagen II (red, F, 20X objective) with the EGFP-HPP-MCFC. No staining (other than the EGFP of the HPP-MCFC progeny) was observed in secondary antibody controls (G–I). Blue = DAPI staining of nuclei.
In addition to immunochemical evaluations we performed a quantitative comparison between EGFP-positive cells (single cell-derived) and feeder cells by qRT-PCR to provide further evidence of the tri-lineage differentiation potential of HPP-MCFC (Fig. 5). Adipogenic, chondrogenic, and osteogenic cultures were dissociated with trypsin and sorted based on EGFP fluorescence. EGFP positive cells (single-cell derived) and negative cells (mesenchymal cell feeders) were analyzed for lineage specific gene expression. An insufficient number of cells was obtained from LPP-MCFC, MCC, and MMC cultures for further cell sorting and PCR analysis. Significantly higher expression of adipogenic genes (PPARγ2, LEP, LPL) (Fig. 5A) was observed in EGFP-positive HPP-MCFC compared to mesenchymal cell feeders obtained from the same culture induced with adipogenic factors. Interestingly, no significant differences were observed when the level of chondrogenic gene expression (LUM, COMP, BIG) (Fig. 5B) was compared between HPP-MCFC and the feeders obtained from the same chondrogenic culture. Similar to the adipogenic cultures, higher levels of osteogenic gene expression (CBFA1, IBSP, BGLAP) were observed in HPP-MCFC cultures compared to the cell feeders in the same culture induced with osteogenic factors (Fig. 5C).
Figure 5. PCR analysis of differentiated HPP-MCFC.
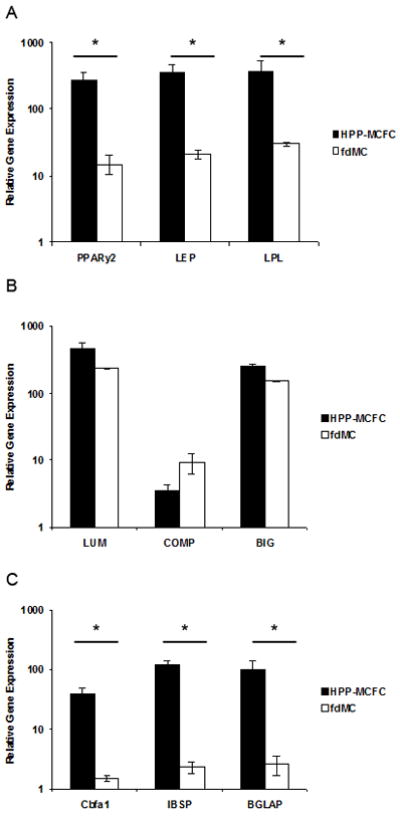
Genes specific for adipogenic (A), chondrogenic (B), and osteogenic (C) lineages were analyzed after sorting EGFP-positive differentiated HPP-MCFC from feeder mesenchymal cells (fdMC, EGFP-negative). Significantly greater levels of adipogenic (A) and osteogenic (C) gene expression were observed in HPP-MCFC compared to fdMC (p<0.05). This effect was not as profound for chondrogenic (B) differentiation when compared to the other two lineages. *p<0.05.
Replating potential of HPP-MCFC
To investigate secondary replating potential, we wished to examine individual cells derived from HPP-MCFC colonies for secondary colony formation, however, the average number of HPP-MCFC obtained from single mesenchymal cells was approximately 1,200 cells, which could not be FACS sorted. Thus, HPP-MCFC were pooled for this study, and single cells were sorted then cultured with mesenchymal cell feeders as conducted for the primary studies. Although it is possible that there may be differences between HPP-MCFC colonies, all showed approximately identical proliferative potential as noted providing a rationale for sorting a pooled population to investigate replating potential. As described above for the primary studies, single fluorescent cells were monitored, and counted for 12 days. A complete hierarchy of cells exhibiting different degrees of self-renewal potential was established in the co-culture. Compared to the initial distribution where 7% of the MSC clones displayed properties of HPP-MCFC, 17% (11 HPP-MCFC/62 single cells plated) of single cells in the secondary co-cultures showed greater than 9 population doublings (Fig. 6). Interestingly, the frequencies of LPP-MCFC and MCC declined to 16% each (10 HPP-MCFC/62 single cells plated) in the secondary cultures. However, the frequency of MMC increased to 51% (31 HPP-MCFC/62 single cells plated) in the secondary co-cultures compared to 38% with the initial sorted clones. Overall, single HPP-MCFC gave rise to 11.0 ± 0.2 population doubling times during the initial expansion, and 10.9 ± 0.3 population doubling times during the secondary plating period, equivalent to a single cell expanding to 3.8×10⁶ ± 6.6×10⁵ cells (Fig. 7).
Figure 6. Growth of single mesenchymal cells after sorting.
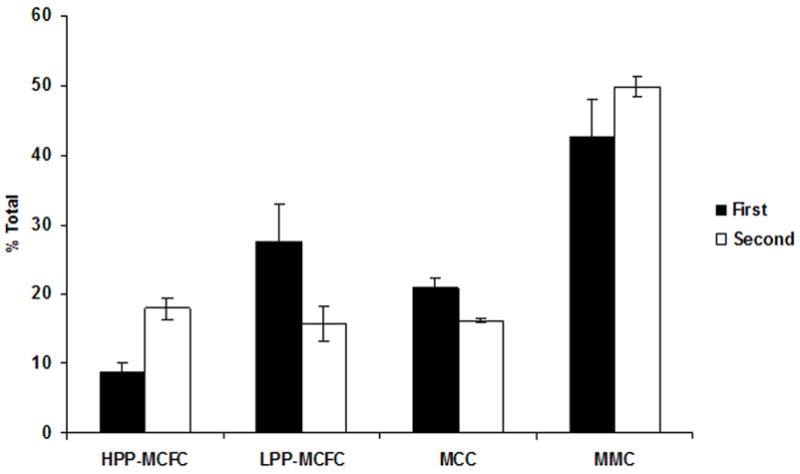
HPP-MCFC from the initial sorting of single cells were pooled, sorted, and monitored for 12 days. The percentage of HPP-MCFC (>9 population doublings) and MMC (≤3 population doublings) appeared to increase from the first sort to the second sort, while LPP-MCFC (>6–9 population doublings) and MCC (>3–6 population doublings) were observed to decrease.
Figure 7. Cumulative growth of HPP-MCFC.
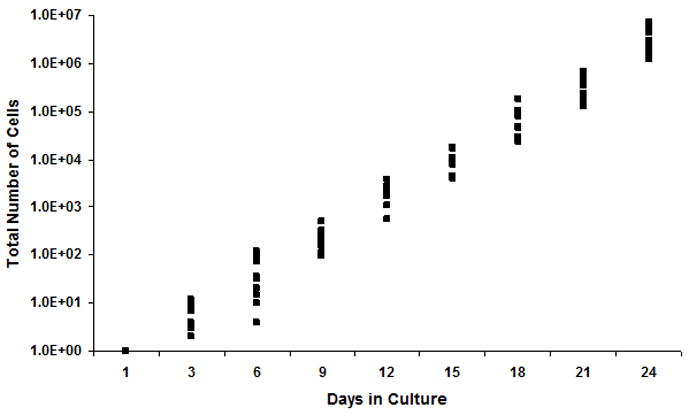
Single HPP-MCFC proliferated to 3.8×10⁶ ± 6.6×10⁵ cells over 24 days.
DISCUSSION
This study demonstrates for the first time that a routine bone marrow mesenchymal cell culture contains a complete hierarchy of cells that can only be assessed by applying a careful single cell analysis. Results also show that single HPP-MCFC can differentiate into multiple mesenchymal lineages and generate secondary colonies of HPP-MCFC. The single cell analysis performed also provides a quantitative view of a population of human bone marrow mesenchymal cells and shows heterogeneity based on growth characteristics. As shown for EPC [11], bone marrow mesenchymal cell cultures contain four distinct cell populations, namely, HPP-MCFC, LPP-MCFC, MCC, and MMC. Although this hierarchy is purely based on growth characteristics, it clearly identifies the degree of heterogeneity of a routine MSC culture. Interestingly, greater than 90% of mesenchymal cells showed limited proliferative potential with nearly 40% of the clones demonstrating less than 3 population doublings prior to senescence. Considering numerous reports indicating that adult bone marrow MSC possess exceptional proliferative potential [10, 12, 13], these studies indicate that a small subpopulation of cells within a routine bone marrow mesenchymal cell culture may be responsible for establishing a long-term culture. These data suggest that this subpopulation, termed HPP-MCFC, undergoes asymmetric cell division and establishes another generation of mesenchymal cells with varying levels of proliferative potential, that not all HPP-MCFC maintain self-renewal potential, and a pure population of true HPP-MCFC may not be possible to obtain using current culture methods. It is also possible that this asymmetric cell division is a result of suboptimal culture conditions, rather than an intrinsic phenomenon. However, it is important to note that the design of culture conditions used for this study represents those widely used in the field [10].
Another important factor involved in self-renewal of HPP-MCFC is the contribution of mesenchymal cell feeders, which is evident by impaired MSC emergence from single plated HPP-MCFC in a feeder-free culture system. While MSC progeny did emerge in some cultures of single plated MSC, the largest colony of mesenchymal cells that emerged that were feeder free was approximately 70 cells (~6 population doublings). Thus, there is no evidence that a single HPP-MCFC alone can establish its own microenvironment for efficient self-renewal under the culture conditions used in this study. Although it is clear that the optimization of culture conditions is necessary to promote self-renewal of HPP-MCFC without the need for feeders to support the culture, the monolayer of heterogenous bone marrow mesenchymal cells appears to contain a population of cells that supports self-renewal of HPP-MCFC. Currently, there is no definitive evidence to support the existence of a distinct MSC population and mesenchymal microenvironment in bone marrow. Sacchetti et al. [14] indicated that a single bone marrow CD146+ colony can establish both heterotopic bone and the hematopoietic microenvironment. However, our current data suggests a clear dependency of HPP-MCFC on other cell type(s) in culture for self-renewal. Thus, it is reasonable to postulate that hematopoietic and mesenchymal stem cell populations each may require a different microenvironment for self-renewal. It is also possible that asymmetric division of HPP-MCFC is contributed to by mesenchymal cell feeders. This hypothesis can further be tested once an optimal culture condition that promotes symmetric cell division is developed.
A study by Aubin et al. [15] showed heterogeneity in osteoprogenitor cell culture when gene expression of individual cells was evaluated by PCR. This investigation provided important insights into functional properties of stem cells that may not be apparent when they are mixed with other cell types. Thus, sub-fractionation of mesenchymal cell culture is crucial in identifying biological properties of true MSC. Colony-forming units (CFUs) obtained by limiting dilution have been used to study the clonality of MSC [12, 16–18]. However, it is difficult to show conclusively that each CFU is derived from a single cell since mesenchymal cells tend to adhere to each other. One way to show that each CFU is derived from a single cell is by screening the entire growth surface and confirming that each mesenchymal cell is separate from neighboring cells. Compared to conventional CFU-F, the sorting method of mesenchymal cells used in this study allowed more stringent single cell identification and subsequent screening of individual cells expressing EGFP under the fluorescent microscope. Even under such stringent single cell sorting and culture conditions used in the current study, rare two-cell aggregates were detected microscopically after sorting. These two-cell aggregates showed a tendency for better growth characteristics when compared to single cells and could lead to misinterpretation of growth data. Although it is possible that these cells represented two identical daughter cells, it was not possible to show conclusively that these cells were, in fact, from a single cell except through use of a lentiviral or retroviral insertional analysis at the genomic level. Thus, these two-cell aggregates were excluded from this study. In addition, expression of a fluorescent marker was necessary to conclusively show that each well truly contained a single mesenchymal cell because of the optical edge effect produced by the culture plates. This optical interference occurs mainly at the edge of wells and makes visualization of cells very difficult under bright light, which occurs with CFU-F studies. After sorting, approximately 41% of cells were noted at or very close to the edge of the wells where visualization was difficult due to optical interference. It is important to note that under the optimized lentiviral transduction conditions used in this study no adverse effects such as growth arrest, VSV-G toxicity, and undesired cellular changes [6, 19, 20] were observed as a result of transduction or EGFP expression. In addition to using EGFP as a marker for sorting single cells and subsequent screening, expression of a functional gene such as alkaline phosphatase has been shown to also be helpful to interrogate the hierarchy of osteoprogenitors that are undergoing differentiation [21]. Purpura et al. used this method to assess cell heterogeneity in fetal rat calvaria cell culture and developed a method to fractionate osteogenic populations useful for investigating differentiation capacities of individual colonies [21]. These studies highlight the importance of evaluating individual cells when attempting to identify the phenotype of true stem cells.
Single cell-derived colonies of HPP-MCFC possess tri-lineage differentiation potential toward adipogenic, chondrogenic, and osteogenic lineages. Other reports have indicated that MSC cultures also contain unipotent and bipotent cells [22, 23]. Although it is possible that non-HPP-MCFC identified in the study described here may have these qualities, differentiation assays could not be performed due to their limited proliferative potential. Further studies are necessary to investigate the optimal culture condition(s) to promote self-renewal of HPP-MCFC without the need for feeder cells. As more effort is made to investigate therapeutic properties of MSC in both animal models and humans, studies on the basic biology of these cells and performed at a single cell level will provide important quantitative and qualitative insights into identifying the best source of cells for transplantation.
A population of mesenchymal cells cultured under widely used conditions [10] and commonly considered heterogeneous [13, 24] was shown to contain a complete hierarchy of cells displaying different levels of proliferative potential and HPP-MCFC that can both self-renew and differentiate into three mesenchymal lineages. This study highlights the importance of analyzing mesenchymal cells at a single cell level to identify the presence of true stem cells.
Acknowledgments
The authors thank Carol Oxford, Araceli Cuellar, and Christine Mall for expert technical assistance. These studies were supported by National Institutes of Health (NIH) grants #HL073220, the Center of Excellence in Translational Human Stem Cell Research (#HL069748), and the Primate Center base operating grant (#RR00169).
Footnotes
SUPPORT AND FINANCIAL DISCLOSURE DECLARATION
No financial interest/relationships with financial interest relating to the topic of this article have been declared.
Publisher's Disclaimer: This is a PDF file of an unedited manuscript that has been accepted for publication. As a service to our customers we are providing this early version of the manuscript. The manuscript will undergo copyediting, typesetting, and review of the resulting proof before it is published in its final citable form. Please note that during the production process errors may be discovered which could affect the content, and all legal disclaimers that apply to the journal pertain.
References
- 1.McNiece IK, Bertoncello I, Kriegler AB, Quesenberry PJ. Colony-forming cells with high proliferative potential (HPP-CFC) Int J Cell Cloning. 1990;8:146–160. doi: 10.1002/stem.5530080302. [DOI] [PubMed] [Google Scholar]
- 2.Yoder MC, Du XX, Williams DA. High proliferative potential colony-forming cell heterogeneity identified using counterflow centrifugal elutriation. Blood. 1993;82:385–391. [PubMed] [Google Scholar]
- 3.Bradley TR, Hodgson GS. Detection of primitive macrophage progenitor cells in mouse bone marrow. Blood. 1979;54:1446–1450. [PubMed] [Google Scholar]
- 4.Srour EF, Brandt JE, Briddell RA, Grigsby S, Leemhuis T, Hoffman R. Long-term generation and expansion of human primitive hematopoietic progenitor cells in vitro. Blood. 1993;81:661–669. [PubMed] [Google Scholar]
- 5.Ingram DA, Mead LE, Tanaka H, et al. Identification of a novel hierarchy of endothelial progenitor cells using human peripheral and umbilical cord blood. Blood. 2004;104:2752–2760. doi: 10.1182/blood-2004-04-1396. [DOI] [PubMed] [Google Scholar]
- 6.Lee CI, Kohn DB, Ekert JE, Tarantal AF. Morphological analysis and lentiviral transduction of fetal monkey bone marrow-derived mesenchymal stem cells. Mol Ther. 2004;9:112–123. doi: 10.1016/j.ymthe.2003.09.019. [DOI] [PubMed] [Google Scholar]
- 7.Kim BS, Lee CC, Christensen JE, Huser TR, Chan JW, Tarantal AF. Growth, differentiation, and biochemical signatures of rhesus monkey mesenchymal stem cells. Stem Cell Dev. 2008;17:185–198. doi: 10.1089/scd.2007.0076. [DOI] [PubMed] [Google Scholar]
- 8.Lee CC, Ye F, Tarantal AF. Comparison of growth and differentiation of fetal and adult rhesus monkey mesenchymal stem cells. Stem Cells Dev. 2006;15:209–220. doi: 10.1089/scd.2006.15.209. [DOI] [PubMed] [Google Scholar]
- 9.Hacia JG, Lee CC, Jimenez DF, et al. Age-related gene expression profiles of rhesus monkey bone marrow-derived mesenchymal stem cells. J Cell Biochem. 2008;103:1198–1210. doi: 10.1002/jcb.21498. [DOI] [PubMed] [Google Scholar]
- 10.Sekiya I, Larson BL, Smith JR, Pochampally R, Cui JG, Prockop DJ. Expansion of human adult stem cells from bone marrow stroma: conditions that maximize the yields of early progenitors and evaluate their quality. Stem Cells. 2002;20:530–541. doi: 10.1634/stemcells.20-6-530. [DOI] [PubMed] [Google Scholar]
- 11.Ingram DA, Mead LE, Moore DB, Woodard W, Fenoglio A, Yoder MC. Vessel wall-derived endothelial cells rapidly proliferate because they contain a complete hierarchy of endothelial progenitor cells. Blood. 2005;105:2783–2786. doi: 10.1182/blood-2004-08-3057. [DOI] [PubMed] [Google Scholar]
- 12.Pittenger MF, Mackay AM, Beck SC, et al. Multilineage potential of adult human mesenchymal stem cells. Science. 1999;284:143–147. doi: 10.1126/science.284.5411.143. [DOI] [PubMed] [Google Scholar]
- 13.Prockop DJ, Sekiya I, Colter DC. Isolation and characterization of rapidly self-renewing stem cells from cultures of human marrow stromal cells. Cytotherapy. 2001;3:393–396. doi: 10.1080/146532401753277229. [DOI] [PubMed] [Google Scholar]
- 14.Sacchetti B, Funari A, Michienzi S, et al. Self-renewing osteoprogenitors in bone marrow sinusoids can organize a hematopoietic microenvironment. Cell. 2007;131:324–336. doi: 10.1016/j.cell.2007.08.025. [DOI] [PubMed] [Google Scholar]
- 15.Aubin JE, Liu F, Malaval L, Gupta AK. Osteoblast and chondroblast differentiation. Bone. 1995;17:77S–83S. doi: 10.1016/8756-3282(95)00183-e. [DOI] [PubMed] [Google Scholar]
- 16.Tremain N, Korkko J, Ibberson D, Kopen GC, DiGirolamo C, Phinney DG. MicroSAGE analysis of 2,353 expressed genes in a single cell-derived colony of undifferentiated human mesenchymal stem cells reveals mRNAs of multiple cell lineages. Stem Cells. 2001;19:408–418. doi: 10.1634/stemcells.19-5-408. [DOI] [PubMed] [Google Scholar]
- 17.Jones EA, Crawford A, English A, et al. Synovial fluid mesenchymal stem cells in health and early osteoarthritis: detection and functional evaluation at the single-cell level. Arth Rheum. 2008;58:1731–1740. doi: 10.1002/art.23485. [DOI] [PubMed] [Google Scholar]
- 18.Friedenstein AJ, Gorskaja JF, Kulagina NN. Fibroblast precursors in normal and irradiated mouse hematopoietic organs. Exp Hematol. 1976;4:267–274. [PubMed] [Google Scholar]
- 19.Beyer WR, Westphal M, Ostertag W, von Laer D. Oncoretrovirus and lentivirus vectors pseudotyped with lymphocytic choriomeningitis virus glycoprotein: generation, concentration, and broad host range. J Virol. 2002;76:1488–1495. doi: 10.1128/JVI.76.3.1488-1495.2002. [DOI] [PMC free article] [PubMed] [Google Scholar]
- 20.Zhang XY, La Russa VF, Reiser J. Transduction of bone-marrow-derived mesenchymal stem cells by using lentivirus vectors pseudotyped with modified RD114 envelope glycoproteins. J Virol. 2004;78:1219–1229. doi: 10.1128/JVI.78.3.1219-1229.2004. [DOI] [PMC free article] [PubMed] [Google Scholar]
- 21.Purpura KA, Zandstra PW, Aubin JE. Fluorescence activated cell sorting reveals heterogeneous and cell non-autonomous osteoprogenitor differentiation in fetal rat calvaria cell populations. J Cell Biochem. 2003;90:109–120. doi: 10.1002/jcb.10596. [DOI] [PubMed] [Google Scholar]
- 22.Mareddy S, Crawford R, Brooke G, Xiao Y. Clonal isolation and characterization of bone marrow stromal cells from patients with osteoarthritis. Tissue Eng. 2007;13:819–829. doi: 10.1089/ten.2006.0180. [DOI] [PubMed] [Google Scholar]
- 23.Owen M. Marrow stromal stem cells. J Cell Sci. 1988;10:63–76. doi: 10.1242/jcs.1988.supplement_10.5. [DOI] [PubMed] [Google Scholar]
- 24.Colter DC, Sekiya I, Prockop DJ. Identification of a subpopulation of rapidly self-renewing and multipotential adult stem cells in colonies of human marrow stromal cells. Proc Nat Acad Sci USA. 2001;98:7841–7845. doi: 10.1073/pnas.141221698. [DOI] [PMC free article] [PubMed] [Google Scholar]