

Abstract
Background and purpose:
Neurons derived from mouse embryonic stem cells (mESCs) are a valuable resource for basic pharmacological research. With the exception of cardiomyocytes, there is relatively little understanding of the pharmacology of stem cell-derived differentiated cells. In this study we investigate P2 receptor agonist effects on GABAergic neurons derived from mESCs.
Experimental approach:
mESCs were differentiated into GABAergic neurons in the presence of N2B27 culture medium. At day 24 of differentiation GABAergic neuronal responsiveness to purinergic agonists was investigated using calcium imaging and [3H]-GABA release studies.
Key results:
Sub-populations of GABAergic neurons responded to some or all of the adenine and uracil nucleotides ATP, ADP, UTP and UDP (all 100 µM) with elevations of intracellular Ca2+ ([Ca2+]i). The number of neurons responding to ATP was reduced by suramin (100 µM), PPADS (10 µM) and MRS2179 (10 µM), but not by NF023 (10 µM). The response to ATP was modulated by extracellular Zn2+ and pH. Neurons also responded to ATP (100 µM) with the release of [3H]-GABA, an effect completely inhibited by tetrodotoxin (100 nM). Ap4A and 2-methylthioATP both elicited significant [3H]-GABA release. Reverse transcriptase PCR showed the presence of P2X1,2,3,4,5,6 and P2X7, and P2Y1,2 and P2Y6 receptors. mESCs expressed P2X2,5 and P2X7 and P2Y1,2 and P2Y6 receptors.
Conclusions and implications:
GABAergic neurons derived from stem cells elevate [Ca2+]i predominantly via the activation of P2X2, P2X4 and P2Y1 receptors. This study shows that mESCs generate good models of neuronal function for in vitro pharmacological investigation.
Keywords: embryonic stem cells, mouse, GABAergic neurons, P2X receptors, P2Y receptors
Introduction
In previous studies we have shown that mouse embryonic stem cells generate functionally heterogeneous populations of neurons (Lang et al., 2004) and dopaminergic neurons (Raye et al., 2007). During the latter study we identified a population of GABAergic neurons that responded to ATP with elevations of [Ca2+]i (N. Tochon-Danguy, unpubl. obs.), a finding broadly consistent with evidence that P2X, and P2Y, receptors modulate GABAergic neuronal activity or synaptic transmission within the CNS (Gomez-Villafuertes et al., 2001; Krugel et al., 2003; Donato et al., 2008; Jameson et al., 2008). There are currently seven mammalian P2X subtypes, distinguished from P2Y receptors by their fast responses and their affinity for ATP over other purines. Within the CNS P2X receptors have been localized to many anatomical regions, from cerebellum (Donato et al., 2008) to midbrain (Gomez-Villafuertes et al., 2001; Xiao et al., 2008) to forebrain (Mori et al., 2001; Safiulina et al., 2005; Kim et al., 2006). P2X4 and P2X6 receptors are the most widely expressed P2X receptors in the CNS (Collo et al., 1996; Tanaka et al., 1996; Kanjhan et al., 1999). P2X1 receptors are also widely expressed, but they are more evident during development (Ashour et al., 2006). Similarly more P2X2 mRNA is detectable in the newborn than in the adult CNS and this is largely found within the thalamus, hypothalamus and pre-optic area (Buell et al., 1996; Simon et al., 1997). The expression of P2X3 and P2X5 subunits is much more localized and they are found only in the sensory neurons of the dorsal root and nodose ganglia (Inoue et al., 1996). P2X7 receptors are mainly found pre-synaptically (North, 2002).
There are currently eight mammalian P2Y subtypes – P2Y1,2,4,6,11–14. The P2Y receptors are G protein-coupled, have a seven-transmembrane structure and signal via a variety of second messenger systems, including phospholipase C, inositol trisphosphate and cAMP. They share between 25–55% sequence homology and display distinct pharmacological profiles (Moore et al., 2000). Generally speaking, P2Y1,11,12 and P2Y13 are more sensitive to adenine nucleotides while P2Y2,4,6 and P2Y14 are more sensitive to activation by uracil nucleotides or UDP-sugar derivatives (Von Kugelgen, 2006). P2Y receptors have been found on neurons in the CNS, especially the P2Y1 receptor that is located in many areas, including the cerebral cortex and hippocampus (Moore et al., 2000). However, low levels of P2Y2,4,6 and P2Y11 receptor have also been detected in the CNS (Moore et al., 2001).
Neurons derived from mouse embryonic stem cells possess many of the biochemical and physiological characteristics of neurons in vivo (Fraichard et al., 1995; Strubing et al., 1995) and in previous studies we have demonstrated that embryonic stem cell-derived neurons respond to ATP with elevations of [Ca2+]i (Lang et al., 2004; Raye et al., 2007). As P2X and P2Y receptor subtypes have been localized to specific structures within the CNS, particularly the forebrain, and as P2X4 and P2X6 receptors are the most widely expressed P2X receptors in CNS (Collo et al., 1996; Tanaka et al., 1996; Kanjhan et al., 1999) our expectation is that mouse GABAergic neurons, differentiated with a forebrain differentiation protocol, are likely to possess P2X4 and P2X6 receptor subtypes. In this study we have characterized the P2 receptors present on mouse embryonic stem cell-derived forebrain GABAergic neurons and found evidence of P2X2, P2X4 and P2Y1 receptor activity.
Methods
Maintenance of mouse embryonic stem cells
The mouse embryonic stem cell line E14 was derived from the inbred 129/Ola mouse strain and received as a generous gift from Stem Cell Sciences, Australia. Undifferentiated mouse embryonic stem cells were maintained at 37°C in a 5% CO2 incubator in supplemented Glasgow's modified essential medium (GMEM) with 10% fetal calf serum, L-glutamine (2 mM), non-essential amino acids (0.1 mM), sodium pyruvate (1 mM), β-mercaptoethanol (0.1 mM), sodium bicarbonate (3 mM) and 10−3 units·mL−1 mouse leukaemia inhibitory factor. Routine passaging was performed every 48–72 h by washing twice in phosphate buffered saline (PBS; containing in mM; NaCl 136.9; KCl 2.7; Na2HPO4 8.1; KH2PO4 1.5, pH 7.4) prior to adding trypsin solution [containing 0.025% trypsin, 0.1 g·L−1 EDTA and 1% (v/v) chicken serum in PBS] for 3 min (37°C). The cell suspension was centrifuged (4 min at 120 ×g) and the supernatant discarded. The cell pellet was re-suspended with growth medium and the cells seeded onto gelatin-coated (0.1% w/v) tissue culture flasks.
Induction of GABAergic differentiation
GABAergic neurons were cultured using a modification of the method previously described (Barberi et al., 2003). Briefly, mouse embryonic stem cells were dissociated into a single-cell suspension and plated on to gelatin-coated culture vessels (7.5 × 10³ cells·cm−2) in GMEM supplemented with mouse leukaemia inhibitory factor. Twenty-four hours later cells were rinsed twice in PBS and incubated with N2B27 medium [1:1 mixture of Neurobasal medium plus N2 supplement (Invitrogen) and DMEM/F12 medium supplemented with B27 (Invitrogen)]. After 7 days, cells were again dissociated with trypsin, pelleted and re-suspended onto laminin-coated (1 µg·cm−1) tissue culture plates in N2B27 supplemented with fibroblast growth factor-2 (FGF-2; 10 ng·mL−1) at 50 × 103 cells·cm−2. At day 11 the medium was changed to N2B27 supplemented with FGF-2 (10 ng·mL−1), FGF-8 (100 ng·mL−1) and sonic hedgehog (SHH; 200 ng·mL−1). To induce maturation of neurons from day 13 onwards N2B27 was supplemented with brain-derived neurotrophic factor (20 ng·mL−1) and neurotrophin-4 (20 ng·mL−1). The medium was replaced every 32–48 h.
Calcium imaging
Cultured cells were washed twice with HEPES buffer (containing in mM; NaCl 145; KCl 5; MgSO4 1; HEPES 10; D-glucose 10; CaCl2 2.5) at pH 7.4, and then incubated with Fluo-4AM (10 µM) in HEPES buffer for 30 min at 37°C. After incubation, cells were viewed using an Eclipse TE2000-E microscope (Nikon, Japan) coupled to a Coolsnap-fx low-light camera. Cells were illuminated at 488 nm with a Lamba DG-4 lamp and filter set (Sutter Instrument Company, USA) and emission was recorded at ∼510 nm. MetaFluor v6.1r5 (Universal Imaging Co., USA) was used to identify regions of interest within the field of view.
After a 10 min equilibration period, an agonist was added to the well. After 60 s, the well was washed twice with HEPES buffer. For most experiments this cycle was repeated three to four times so that multiple agonist effects on single cells could be identified. Antagonists, where used, were added after the addition of ATP. Control experiments were performed where only vehicle was added to the well. KCl (30 mM) was added at the end of the experiment. All experiments were performed in the presence of tetrodotoxin (100 nM). Cells were preserved in kryofix (a 7.9:7.4:1 mixture of ethanol : H2O : polyethylene glycol) at 4°C until immunocytochemistry was performed.
Images were acquired every 3.5 s. Background fluorescence was subtracted and fluorescence intensity calculated within each neuron.
Immunocytochemistry
On the day of use cells were washed twice with PBS and fixed with acetone : methanol (1:1; 30 min) or with 4% (v/v) formaldehyde in PBS for 30 min. After washing twice with PBS the cells were incubated with PBS containing 0.05% (w/v) Triton-X for 30 min and washed four more times with PBS. Non-specific antibody binding was blocked with 5% (w/v) BSA in PBS for 30 min. Cells were incubated with rabbit anti-glutamic acid decarboxylase (GAD; 1:200) in PBS [with 1% (w/v) BSA] overnight at 4°C. Negative controls were incubated in primary antibody free PBS containing 1% (w/v) BSA. Cells were washed four times with PBS [1% (w/v) BSA] and incubated with donkey anti-rabbit Alexa Fluor 594 (1:200) for 2 h. Cells were washed four times in PBS [1% (w/v) BSA] and illuminated at 575 nm, with emission at 620 nm using a Nikon TE2000-E. All washes were of 5 min duration.
[3H]-GABA release
On day 24 of differentiation, tissue culture wells were thoroughly washed with HEPES buffer [containing 0.3% (w/v) BSA] and incubated (30 min at 37°C) with 0.1 µCi [3H]-GABA (Amersham Biosciences, UK) in HEPES buffer containing aminooxyacetic acid (AOAA: 10 µM). Cells were washed and incubated with HEPES buffer containing nipecotic acid (NPA; 10 µM) and AOAA (10 µM). Both AOAA and NPA were present throughout the experiment to prevent degradation and reuptake of the radioligand respectively. Cells were then superfused at 1 mL·min−1 (37°C).
After a 30 min wash, five 1 min samples (1 mL) were collected to determine basal [3H]-GABA release. One agonist or KCl (30 mM) was added to each well and another six 1 mL samples collected before a 10 min washout period. Five 1 mL samples were again collected to determine basal release before the addition of KCl (30 mM), and the collection of another six samples. In some cases antagonists were added prior to the first stimulation period.
StarScint liquid scintillant (1.5 mL; Perkin-Elmer, Australia) was added to samples and counts per minute (CPM) determined with a Tri-Carb® 2000A Liquid Scintillation Analyser (Perkin-Elmer). Basal release was calculated from the average of CPM in the three 1 min samples immediately before exposure to a drug. Fractional release for each sample was calculated by dividing the CPM in the sample by the basal release. Microscopic examination of cells before and after superfusion experiments confirmed that cells did not wash off during the release experiments.
Reverse transcriptase PCR
RNA extraction and cDNA synthesis
RNA extraction was performed using the RNeasy micro extraction kit from Qiagen according to the manufacturer's specifications. Quantification of RNA samples was performed using a Qubit spectrophotometer. cDNA was transcribed using the SuperScript III reverse transcriptase kit (Invitrogen) using oligo-dT as a primer with 200 ng of RNA as specified by the manufacturer.
Primer sequences and PCR conditions
PCR was performed using Qiagen's HotStar Taq Plus Polymerase PCR kit on a Corbett Research thermal cycler using primer concentrations of 0.2 µM. General PCR conditions were 94°C for 5 min followed by 35 cycles consisting of 94°C for 1 min, 52–64°C for 1 min and 72°C for 1 min. Primer sequences and PCR conditions are shown in Table 1. RNA from whole brain was used as a positive control. The PCR products were separated on a 1% (w/v) agarose gel (Progen Biosciences, Australia) in TAE buffer [composed of (mM); Tris-acetate 40; EDTA 1] using ethidium bromide to visualize PCR products under UV light.
Table 1.
PCR conditions and sequences of P2 purinoceptor primers utilized in this study
| Primer | Sequence (5′ to 3′) | Annealing temperature (°C) | Length (bp) |
|---|---|---|---|
| GAPDH | ACCACAGTCCTAGCCATCAC | 55 | 450 |
| TCCACCACCCTGTTGCTGTA | |||
| P2X1 | TGGGTGGGTGTTTGTCTATG | 60 | 739 |
| TGAAGTTGAAGCCTGGAGAC | |||
| P2X2 | TCCATCATCACCAAAGTCAA | 60 | 391 |
| TTGGGGTAGTGGATGCTGTT | |||
| P2X3 | CTCCTGCCTAACCTCACCGACAAGG | 52 | 624 |
| CTAGTGACCAATAGAATAGGCCCCT | |||
| P2X4 | GCGTCTGTGAAGACCTGTGA | 56 | 246 |
| GATTTGGCCAAGACGGAATA | |||
| P2X5 | GTCACTTCAGCTCCACCAATCTCT | 60 | 553 |
| CCTCTCCAGTGTCTTGTCCTCTGC | |||
| P2X6 | GCCTTAGATACCTGGGACAACACC | 52 | 516 |
| TGCACTGTTGGTAGTTGCCTTTGGG | |||
| P2X7 | ATGCCGGCTTGCTGCAGCTGGAACG | 52 | 666 |
| CCAAGTCTTGTGAAAGGTACAAGA G | |||
| P2Y1 | ACGTCAGATGAGTACCTGCG | 63 | 288 |
| CCCTGTCGTTGAAATCACAC | |||
| P2Y2 | CTGGTCCGCTTTGCCCGAGATG | 63 | 310 |
| TATCCTGAGTCCCTGCCAAATGAGA | |||
| P2Y4 | TGTTCCACCTGGCATTGTCAG | 52 | 293 |
| AAAGATTGGGCACGAGGCAG | |||
| P2Y6 | TGCTTGGGTGGTATGTGGAGTC | 64 | 316 |
| TGGAAAGGCAGGAAGCTGATAAC |
Statistical analysis
There are two main measures of functional activity obtained from our imaging studies. The first is the number of cells in the population that respond to a given agonist or group of agonists. The second is the magnitude of that response. To establish that a cell responds to an agonist we calculated the mean (M) and standard deviation (SD) of the eight points prior to agonist addition (representing basal cell activity). Following agonist addition (R) an agonist was deemed to have elicited a response if the maximal response to that agonist was greater than the mean plus five times the standard deviation of the basal activity. Thus if R > [M+ (5 × SD)] that cell was counted as a responding cell. The number of neurons responding was then expressed as a fraction of the population in a field of view. The magnitude of the response to agonist is generally expressed as a fraction of the average basal (pre-agonist) [Ca2+]i. In Zn2+ and pH experiments, multiple additions of ATP (10 µM) were added to neurons: in control, high-Zn2+ or altered pH environments. In these experiments data are expressed as a percentage of the first response to ATP (10 µM), which was always established in normal buffer prior to the modification of pH or addition of Zn2+.
All results are presented as mean ± SEM. Statistical analyses were performed on raw data using PRISM v5.00 (GraphPad Software, USA). Data were analysed by t-test or one-way anova with post hoc Dunnett's test or Bonferroni's test where appropriate. In all cases, P < 0.05 was considered to be significant.
Materials
All growth factors and ligands as well as GMEM and rabbit anti-GAD were purchased from Sigma-Aldrich (Australia), all other media and antibiotics were purchased from Invitrogen (Australia), except for Fluo-4AM and secondary antibody (Invitrogen, USA). Tetrodotoxin, MRS2365 and pyridoxal-phosphate-6-azophenyl-2′,4′-disulphonate (PPADS) were from Tocris, UK. Most drugs were dissolved in HEPES buffer, with the exception of dopamine and noradrenaline, which were dissolved in catecholamine diluent [composed of (mM); NaCl 154; NaH2PO4 1.2; ascorbic acid 0.2] at pH 7.4. Fluo-4AM was dissolved in DMSO.
Results
Responses to ATP, ADP, UTP and UDP
Initial experiments to identify the nature of the forebrain neurons revealed a predominant population of GAD 65/67 immunoreactive, GABAergic neurons (Figure 1A and B). To establish whether P2X, P2Y or both P2 receptor subtypes were present on our cultured neurons we measured changes in [Ca2+]i in response to the adenine and uracil nucleotides ATP, ADP, UTP and UDP (all 100 µM). Across five replicate experiments 100% of neurons (90 cells) responded to at least one of the P2 receptor agonists (Figure 1C shows typical responses to these purinoceptor agonists). Within the responding population, ATP (100 µM) elevated [Ca2+]i in 79 ± 14% of neurons. ADP, UTP and UDP (all 100 µM) elevated [Ca2+]i in 84 ± 11, 36 ± 18 and 10 ± 4% of the neuronal population, respectively. Further analysis showed four major patterns of reactivity within the GABAergic neuron population (see Table 2). Thus there were major populations of neurons responding to ATP only, to ADP only, to ATP and ADP, and to ATP, ADP and UTP only (Figure 2). The maximum responses to ATP and ADP varied depending on the group they were in, and the maximal response to UTP was significantly lower than the responses to ATP and ADP (P < 0.05, one-way anova with post hoc Bonferroni's test, Figure 2). According to the size of the maximal response of each agonist, the rank orders of potency for each of the subsets were therefore ATP ⋙ ADP*, UTP*, UDP*, ADP ⋙ ATP*, UTP*, UDP*, ATP = ADP ⋙ UTP*, UDP* and ATP = ADP > UTP ⋙ UDP*. * Indicates that no response was evident at the concentration used.
Figure 1.
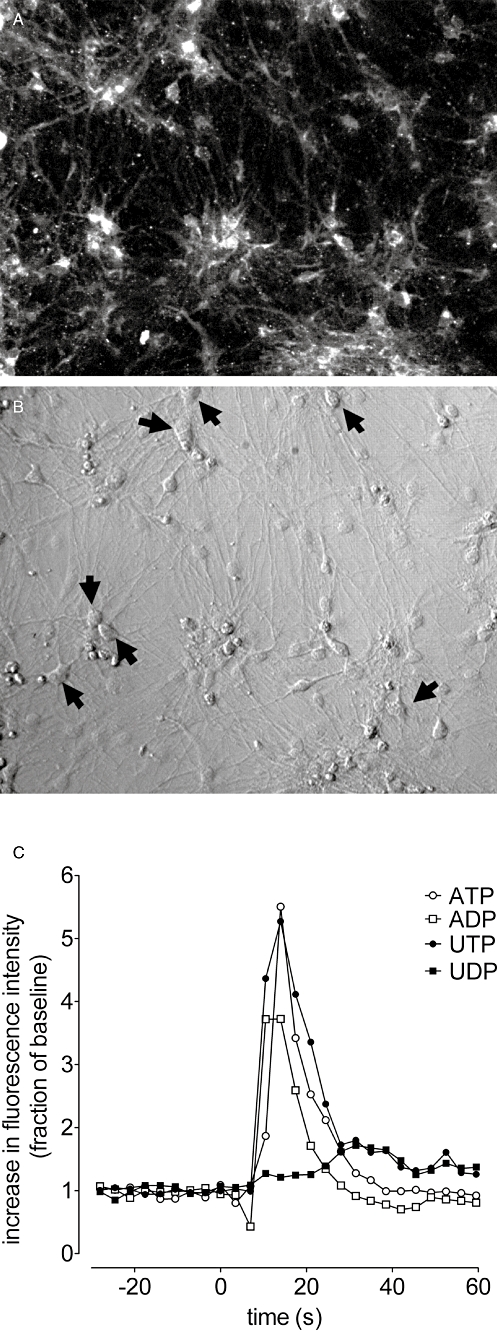
Mouse embryonic stem cell-derived GABAergic neurons. (A) shows glutamic acid decarboxylase 65/67 immunoreactivity of a typical field of neurons. (B) shows the HMC image of the same field of view. (C) shows the typical response of GABAergic neurons to ATP, ADP, UTP and UDP (all 100 µM). The black arrows in (B) indicate strong GAD65/67 immunolabelling of the GABAergic neurons present in culture; as defined by the GAD 65/67 immunoreactivity shown in (A). The scale bar, bottom right (B), indicates 100 µm.
Table 2.
Agonist responses to P2 agonists
| Agonist | % of cell population responding |
|---|---|
| ATP only | 24 ± 16 |
| ADP only | 13 ± 11 |
| UTP only | 0 |
| UDP only | 1 ± 1 |
| ATP and UTP | 0 |
| ADP and UTP | 1 ± 1 |
| ATP and UDP | 0 |
| ATP and ADP | 26 ± 6 |
| ADP and UDP | 0 |
| UTP and UDP | 0 |
| ATP, ADP and UTP | 27 ± 14 |
| ATP, UTP and UDP | 0 |
| ADP, UTP and UDP | 0 |
| ATP, ADP and UDP | 2 ± 2 |
| ATP, ADP, UTP and UDP | 4 ± 2 |
The numbers show the percentage (mean ± SEM) of 90 neurons responding to single agonists or to sequential additions of agonist (five replicate experiments).
Figure 2.
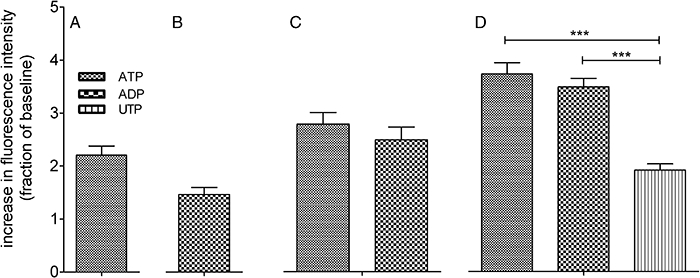
Elevation of [Ca2+]i in response to the purinoceptor agonist nucleotides ATP, ADP, UTP and UDP (all 100 µM). All panels show an elevation of [Ca2+]i in mouse embryonic stem cell-derived GABAergic neurons expressed as fraction of their own basal [Ca2+]i. (A) shows cells that only respond to ATP. (B) shows cells that only respond to ADP and UTP. (C) shows cells that only respond to ATP and ADP. (D) shows cells that only respond to ATP, ADP and UTP. Bars show mean ± SEM of 9–14 cells, subdivided from 90 cells (five replicate experiments).
Effects of 2-methylthioATP, ATPγS, α, β-methylene ATP, cytidine triphosphate and P1,P4-di(adenosine-5′) tetraphosphate (Ap4A)
As many of the neurons responded to ATP, indicating the presence of P2X receptors, we further investigated the subtype of P2X purinoceptor responsible for elevating [Ca2+]i, using the P2 receptor selective agonists 2-methylthioATP (100 µM) and ATPγS (100 µM). These agonists elicited similar elevations of [Ca2+]i in 66 ± 5% and 53 ± 5% of the GABAergic neuronal population respectively (n= 4, Figure 3). Most of the (122) neurons (84 ± 5%) responding to ATPγS (100 µM) also responded to 2-methylthioATP (100 µM). In a separate series of experiments the P2X subtype selective agonist, α, β-methylene ATP (10 µM), elicited weak, slow-onset, elevations of [Ca2+]i from 15 ± 7% (n= 4) of the GABAergic neuronal population (Figure 3). α, β-methylene ATP (100 µM) produced almost identical responses (data not shown). To confirm that responses in neurons were due to ATP and not its breakdown product, experiments were performed with adenosine (30 µM), which elicited elevations of [Ca2+]i from 43 ± 5% of neurons (104 cells, n= 5). These responses were indistinguishable from those of 2-methylthioATP (100 µM) and ATPγS (100 µM), data not shown.
Figure 3.
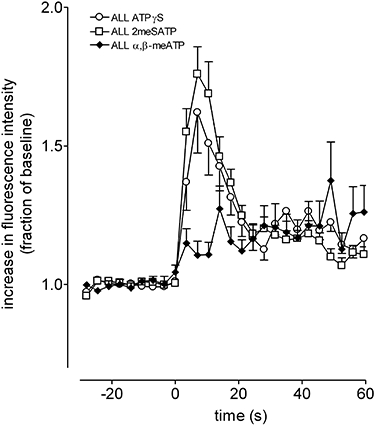
Changes in [Ca2+]i in response to the ectonucleotidase-resistant ATP analogues; 2-methylthioATP, ATPγS and α, β-methylene ATP. 2-methylthioATP, ATPγS (both at 100 µM) and α, β-methylene ATP (10 µM) elevated [Ca2+]i in mouse embryonic stem cell-derived GABAergic neurons. Each panel shows the response expressed as a fraction of the KCl (30 mM) response. Points show mean ± SEM of 46 (2-methylthioATP, ATPγS) and 13 (cells α, β-methylene ATP). In some cases error bars have been omitted for clarity.
To further define the subtype of P2X receptors present in our cultured neurons we investigated the effects of the non-selective agonists ATP (10 µM) and ATPγS (10 µM), the P2X1,4 partial and P2X2,3 full agonist, Ap4A (100 µM) and the P2X4 selective cytidine triphosphate (CTP) (10 µM). Most (84 ± 4%) of the 153 neurons observed (in five replicate experiments) responded to ATP with elevations of [Ca2+]i. Of these ATP-responsive neurons 91 ± 8% responded to ATPγS, 46 ± 21% responded to Ap4A and 15 ± 10% responded to CTP; almost all neurons responding to Ap4A responded to CTP. The responses to Ap4A were of similar magnitude of the responses to ATP (Figure 4). Maximal responses to CTP and ATPγS (100 µM) were smaller than those of ATP (P < 0.05, one-way anova with post hoc Bonferroni's test, n= 4, Figure 4).
Figure 4.
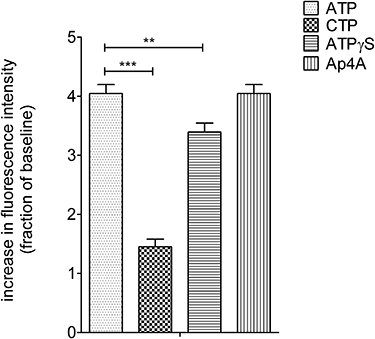
Changes in [Ca2+]i in response to ATP, CTP, ATPγS and Ap4A. CTP (10 µM) was ineffective at increasing [Ca2+]i in mouse embryonic stem cell-derived GABAergic neurons. Each panel shows the mean ± SEM response expressed as a fraction of the KCl (30 mM) response. *P < 0.05 and ***P < 0.001, one-way anova with post hoc Bonferroni's test, 129 neurons from five replicate experiments.
Effects of Zn2+ and pH on responses to ATP
It is difficult to discriminate between P2X2 and P2X4 receptors using traditional pharmacological tools; however, both P2X2 and P2X4 receptor activities are modulated by changes in extracellular Zn2+ and pH respectively (Soto et al., 1996; Stoop et al., 1997, #1191) Compared with Zn2+-free controls, the presence of Zn2+ (200 µM) increased the number of cells that responded to ATP (10 µM) from 62 ± 5% to 78 ± 3 (P < 0.05, one-way anova with post hoc Bonferroni's test, 72 and 145 cells from four to five replicate experiments). The maximal response to ATP was unaffected by the addition of Zn2+ (data not shown).
Using a range of different pH conditions similar to those defined by Stoop and co-workers (Stoop et al., 1997, #1191) we tested the effects of buffer acidification and alkalinization on the responses to ATP. Compared with ATP (10 µM) responses at pH 7.4, the number of cells responding declined as the buffer pH increased (P < 0.05, one-way anova with post hoc Dunnett's test, 77 cells from three replicate experiments; Figure 5A). This correlated with a significant reduction in the maximal response (P < 0.05, one-way anova with post hoc Dunnett's test, 77 cells from three replicate experiments; Figure 5B). As pH decreased, the number of cells responding to ATP (10 µM) decreased, compared with those at pH 7.4 (P < 0.05, one-way anova with post hoc Dunnett's test, n= 3; Figure 5A). The magnitude of the response to ATP (10 µM) significantly increased as the buffers became more acidic (P < 0.05, one-way anova with post hoc Dunnett's test, n= 3; Figure 5B).
Figure 5.
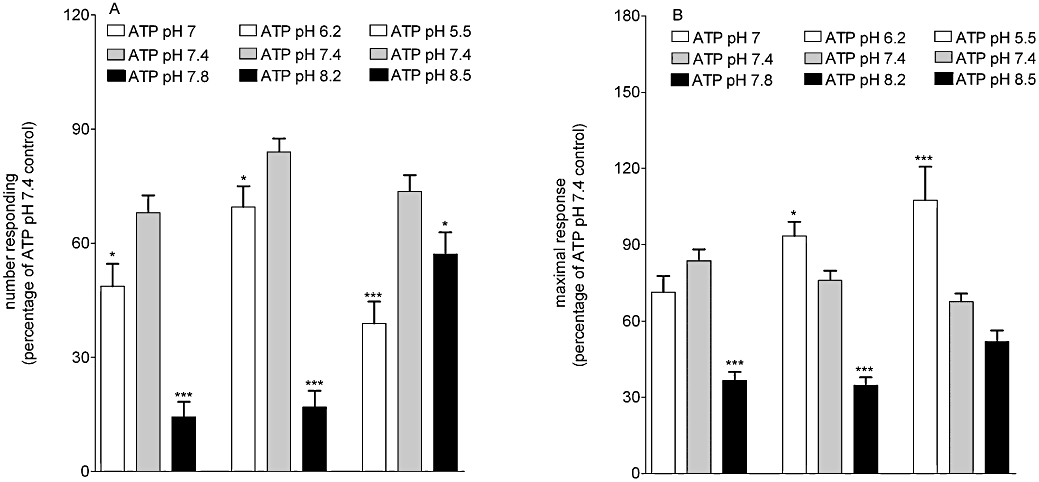
Numbers of neurons responding and magnitudes of response under different pH conditions. (A) shows the number of cells responding to ATP (10 µM) at different pH conditions, expressed as a percentage of the first response to ATP under normal pH (7.4). (B) shows the magnitude of response to ATP (10 µM) expressed as a percentage of the first (normal pH) response to ATP. *P < 0.05 and ***P < 0.001, compared with ATP, one-way anova with post hoc Dunnett's test, 77 cells from three replicate experiments.
Effects of ATP, Ap4A and MRS2365
Given that many cells responded to ADP we investigated the possibility that P2Y1 receptors were also present on GABAergic neurons by assessing the effects of Ap4A (100 µM) and the P2Y1 selective agonist, MRS2365 (10 µM) on ATP (100 µM) responsive cells. Of all the cells responding to ATP (63 cells from five replicate experiments) 40 ± 7% also responded to MRS2365 while 30 ± 15% also responded to AP4A. A smaller population responded to both MRS2365 and Ap4A (22 ± 10% of the ATP responsive cells). The mean responses to MRS2365 (10 µM) were considerably slower in onset than those of ATP (100 µM), but of equal magnitude (Figure 6). The responses to AP4A (100 µM) were approximately 30% smaller than the responses to ATP (100 µM), data not shown.
Figure 6.
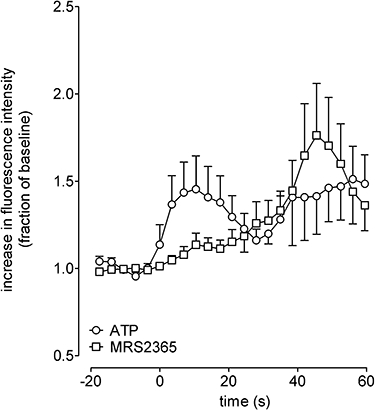
Effects of ATP and MRS2635 on [Ca2+]i in embryonic stem cell-derived GABAergic neurons. The panels shows the effects of ATP (100 µM) and MRS2635 (10 µM), expressed as a fraction of the percentage of their own baseline responses, on the cells that respond to both agonists. Points show mean ± SEM, in some cases error bars have been omitted for clarity.
Effects of suramin, PPADS, NF023 and MRS2179 on responses to ATP
Although there are not many selective P2 receptor antagonists, we incubated neurons with the non-selective antagonist P2 receptor antagonist, suramin (100 µM), the P2X1 selective antagonist NF023 (10 µM), the P2X1,2,3,5 selective antagonist PPADS (10 µM) and the P2Y1 selective antagonist MRS2179 (10 µM). Compared with ATP control responses, suramin, PPADS and MRS2179, but not NF023, all reduced the fraction of cells responding to subsequent additions of ATP (P < 0.05 one-way anova with post hoc Dunnett's test of 52–92 cells, n= 4–5, Figure 7A). The magnitude of response to ATP did not change in responding cells (Figure 7B).
Figure 7.
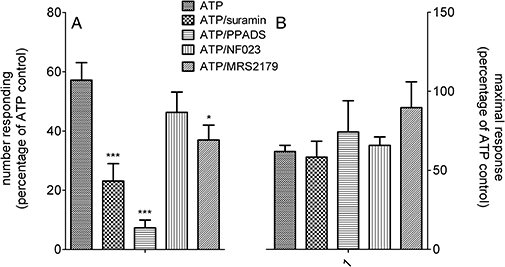
Effects of suramin, PPADS, NF023 and MRS2179 on the number of cells responding to ATP and the magnitude of that response. (A) shows the number of cells responding to ATP (100 µM) expressed as a percentage of the original population responding in the presence of suramin (100 µM), PPADS (10 µM), NF023 (10 µM) or MRS2179 (10 µM). (B) shows the fluorescence intensity changes in the presence of the antagonists as a percentage of their initial responses to ATP (100 µM). *P < 0.05 and ***P < 0.001, compared with ATP, one-way anova with post hoc Dunnett's test, 52–96 cells from four replicate experiments.
Reverse transcriptase PCR
mRNA for P2X1,2,3,4,5,6 and P2X7, as well as P2Y1,2 and P2Y6 receptors was detected in our cultured cell populations at day 24 of differentiation. Mouse embryonic stem cells expressed P2X2,5 and P2X7 as well as P2Y1,2 and P2Y6 receptors (Figure 8).
Figure 8.
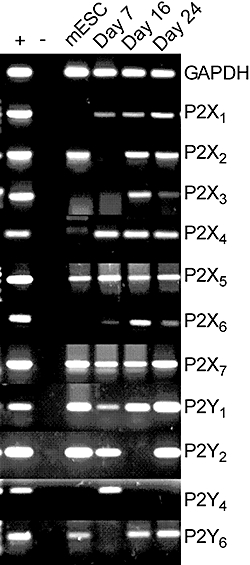
P2 purinoceptor mRNA in cultured cells during differentiation protocol. Results shown are representative of three replicate experiments. mRNA was extracted from cultures prior to differentiation (i.e. from mouse embryonic stem cells), and at days 7, 16 and 24 of differentiation. GAPDH was used as a housekeeping gene. + indicates bands from mouse brain control and – indicates PCR products in the absence of RNA.
[3H]-GABA release
To assess whether the cultured GABAergic neurons could respond to P2 agonist addition with transmitter release we incubated cells with [3H]-GABA and evoked release with a selection of agonists. Cultured GABAergic neurons respond to ATP (100 µM) with the release of [3H]-GABA (P < 0.05, one-way anova with post hoc Dunnett's test, n= 5), an effect completely inhibited by tetrodotoxin (1 µM). ADP, UTP and UDP did not elicit significant overflow of [3H]-GABA (data not shown). Ap4A (100 µM) and 2-methylthioATP (100 µM) both elicited significant [3H]-GABA release (P < 0.05, one-way anova with post hoc Dunnett's test, n= 5). CTP (100 µM), the P2Y1 agonist, MRS2365 (10 µM) and α, β-methylene ATP (100 µM) were without significant effect (Figure 9).
Figure 9.
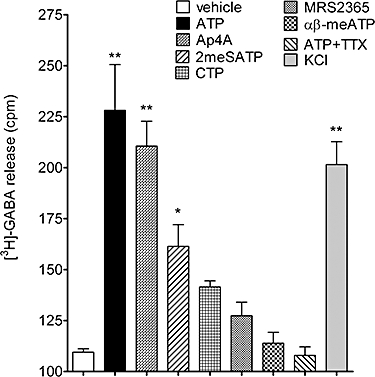
Effects of purinoceptor ligands on the efflux of [3H]-GABA from mouse embryonic stem cell-derived GABAergic neurons. ATP (100 µM), Ap4A (100 µM), 2-methylthioATP (100 µM) and KCl (30 mM), but not CTP (100 µM), MRS2365 (10 µM) or α, β-methylene ATP (100 µM), increased [3H]-GABA efflux. The ATP effect was inhibited by tetrodotoxin (TTX, 100 nM). *P < 0.05 and ***P < 0.001, compared with vehicle control, one-way anova with post hoc Dunnett's test, n= 5.
Discussion
In the 1960s Geoffrey Burnstock discovered a non-adrenergic and non-cholinergic neurotransmitter being released from the guinea pig gut (Burnstock et al., 1964). A basis for distinguishing between receptors using agonist potency was utilized to enable the classification of two distinct P2 purinoceptor subtypes; now identified as the ionotropic P2X and the metabotropic P2Y receptors (Burnstock and Kennedy, 1985). Although these receptors have been widely localized to various tissues, their pharmacological classification has remained difficult since there are a limited number of selective agonists or antagonists. In this study we utilize agonist orders of potency, some of the more selective antagonists and modification of the extracellular buffer pH to modify receptor function in an effort to characterize the P2 receptors present on GABAergic neurons derived from mESCs.
Our studies demonstrated four major populations of agonist-responding neurons. These neurons had rank orders of potency of ATP ⋙ ADP, UTP, UDP, ADP ⋙ ATP, UTP, UDP, ATP = ADP ⋙ UTP, UDP and ATP = ADP > UTP ⋙ UDP. Our interpretation of these findings is that the ATP and ADP response was predominant across the cultures, indicating that the majority of cells possess one or more of the ATP preferring P2 receptor subtypes, namely any of the P2X receptors and/or P2Y1,12 or 13. Supporting this idea we observed that most agonist-induced responses were reasonably rapid in onset, a finding broadly consistent with the preferential activation of ionotropic, rather than metabotropic receptor subtypes.
To further investigate the subtype of P2X purinoceptor responsible for elevating [Ca2+]i we incubated mESC-derived GABAergic neurons with ATP, the P2Y1 and non-selective P2X agonist, 2-methylthioATP, and the non-selective, non-hydrolysable, agonist, ATPγS (North, 2002; Jacobson et al., 2004; Burnstock, 2007). Most of the neurons that responded to ATP also responded to ATPγS, indicating that hydrolysis products do not play a significant role in the ATP response. However, the finding that α, β-methylene ATP, which does not activate P2X2 or P2X4 receptors (North, 2002), elicited elevations of [Ca2+]i from only 15 ± 7% of the GABAergic neuronal population, compared with 82 ± 4% of cells responding to ATP, is consistent with the presence of P2X2 and P2X4 receptor subtypes.
To discriminate between the P2X2 and P2X4 receptors we tested the effects of the P2X1,4 partial and P2X2,3 full agonist, Ap4A (Wildman et al., 1999) and the weak P2X4 selective agonist, CTP (Burnstock, 2007) on mouse embryonic stem cell-derived GABAergic neurons. Ap4A elicited a response from 45% of the cells that responded to ATP, but this response was of the same magnitude as the response to ATP, possibly indicating an action as a full agonist. In contrast CTP elicited a response from only 15 ± 10% of the cells responding to ATP and these neurons appear to form a subset of those that responded to AP4A. That both CTP and AP4A elevated [Ca2+]i is consistent with presence of both P2X2 and P2X4 receptors (Soto et al., 1996; Burnstock, 2007). Although there is a limited selection of pharmacological tools for the identification of purinoceptor subtypes, there are other mechanisms that enable further characterization of P2X2 and P2X4 subtypes. At recombinant P2X2 and P2X4 receptors, Zn2+ potentiates ATP-evoked currents (Soto et al., 1996; Wildman et al., 1999). In this study, the addition of Zn2+ increased the number of responding cells without affecting the maximal response, indicating P2X2 or P2X4 receptors. This was not quite expected and could indicate that some neurons possess such low densities of receptor that they are classified as non-responding. The subsequent addition of Zn2+ could then potentiate the P2X receptor response revealing the additional responding cells.
Agonist activity at P2X1,3 and P2X4 receptors is reduced by acidification, but at P2X2 receptors, acidification increases agonist activity (Stoop et al., 1997). In this study acidification increased the magnitude of the ATP response, but reduced the number of cells responding, possibly indicating the presence of P2X2 and possibly one of the other P2X receptor subtypes. Alkalinization of the media, as reported by Stoop et al. (1997), reduces the magnitude of response to P2X2, but not P2X1,3 or P2X4 receptors. Our cultured neurons responded to alkalinization with a reduction in the number of cells responding and also a reduced magnitude of response, effects consistent with those at P2X2 receptors. Curiously, at the highest pH used (8.5), the maximal response to ATP was no longer reduced compared with controls; at present we have no explanation for this effect.
Given the effects of AP4A and CTP, and given the effects of Zn2+ and altered pH on the responses to ATP we suggest that GABAergic neurons derived from mESCs possess both P2X2 and P2X4 receptors. That a population of neurons respond to ADP and the P2Y1 receptor-selective agonist, MRS2635, indicates the presence of a P2Y1 receptor on these neurons.
To further confirm the effects of ATP at cell surface receptors, we incubated neurons with the non-selective P2X antagonist suramin, the P2X1 selective antagonist NF023, the P2X1,2,3,5 selective antagonist PPADS and the P2Y1 selective antagonist MRS2179. Compared with ATP controls, suramin, PPADS and MRS2179, but not NF023, all reduced the fraction of cells responding to subsequent additions of ATP. These data are consistent with the idea of P2X2 and/or P2X4 receptors modulating the activity of the GABAergic neuronal population. The inhibition of the ATP response by MRS2179 is consistent with an effect of ATP mediated through P2Y1 receptors.
To establish the effects of P2 receptors upon GABA release from our cultured neuronal population we examined the effects of ATP and selected agonists upon [3H]-GABA release. Consistent with our [Ca2+]i data, ATP significantly increased [3H]-GABA outflow. That this effect was completely blocked by tetrodotoxin indicates that the effects of ATP are predominantly mediated via somal, rather than pre-synaptic, P2 receptors. Ap4A and 2meSATP were both able to elicit [3H]-GABA release, a finding consistent with effects at either or both P2X2 and P2X4 receptors. CTP and MRS2635 could not elicit [3H]-GABA release consistent with the weak [Ca2+]i elevating effects of CTP and the slow onset of response to MRS2635, which may enable the transmission of signal from the soma to the synapses, or it may provide ample time for GABA-induced negative feedback effect on release. Another potential complication in these [3H]-GABA release studies are the confounding effects of pre-synaptic P2 receptors upon release (see Rodrigues et al., 2005; Jameson et al., 2008) and we cannot rule out the possibility that there is a significant P2 receptor modulation of [3H]-GABA release.
The presence of P2X2, P2X4 and P2Y1 receptor mRNA in cultures supports a predominant role for these receptors in GABAergic neuronal function. However, the presence of other receptor mRNA in cultures indicates the presence of P2 receptors on the non-neuronal cells observed in these cultures. The exact composition of P2 receptors present on GABAergic neurons remains to be investigated by immunocytochemistry.
In summary, our data indicate that P2X2, P2X4 and P2Y1 receptors elevate [Ca2+]i in GABAergic neurons differentiated from mouse embryonic stem cells. The ability of ATP, 2meSATP and Ap4A to elevate [Ca2+]i is consistent with their ability to induce [3H]-GABA release, but the weak effects of CTP and MRS2365 indicate that P2X2 activation is the most effective means of elevating GABA release. These findings indicate a role for P2X and P2Y receptors in GABAergic neuronal function, but the exact role of these receptors on GABAergic neurons in situ is unknown. From these studies it appears that embryonic stem cell-derived GABAergic neurons appear to be excellent models of adult GABAergic neurons. As embryonic stem cells are self-renewable and, using this protocol easily differentiated, they offer a great opportunity to selectively investigate the functional, biochemical and pharmacological properties of GABAergic neurons. In addition, their ease of genetic manipulation will, we believe, make them useful tools for investigating the receptor and functional changes associated with neuronal development. How the P2X and P2Y expression patterns of the embryonic stem cell-derived GABAergic neurons compared with those of the adult mouse, and the physiological significance of this expression, remains to be resolved.
Acknowledgments
This work was partly supported by the Australian Research Council (LP0455327).
Glossary
Abbreviations:
- ApA4
P1,P4-di(adenosine-5′) tetraphosphate ammonium salt
- [Ca2+]i
intracellular Ca2+
- CTP
cytidine triphosphate
- FGF
fibroblast growth factor
- GAD
glutamic acid decarboxylase
- mESCs
mouse embryonic stem cells
- PPADS
pyridoxal-phosphate-6-azophenyl-2′,4′-disulphonate
Conflicts of interest
None.
References
- Ashour F, Atterbury-Thomas M, Deuchars J, Evans RJ. An evaluation of antibody detection of the P2X1 receptor subunit in the CNS of wild type and P2X1-knockout mice. Neurosci Lett. 2006;397:120–125. doi: 10.1016/j.neulet.2005.12.004. [DOI] [PubMed] [Google Scholar]
- Barberi T, Klivenyi P, Calingasan NY, Lee H, Kawamata H, Loonam K, et al. Neural subtype specification of fertilization and nuclear transfer embryonic stem cells and application in parkinsonian mice. Nat Biotechnol. 2003;21:1200–1207. doi: 10.1038/nbt870. [DOI] [PubMed] [Google Scholar]
- Buell G, Collo G, Rassendren F. P2X receptors: an emerging channel family. Eur J Neurosci. 1996;8:2221–2228. doi: 10.1111/j.1460-9568.1996.tb00745.x. [DOI] [PubMed] [Google Scholar]
- Burnstock G. Physiology and pathophysiology of purinergic neurotransmission. Physiol Rev. 2007;87:659–797. doi: 10.1152/physrev.00043.2006. [DOI] [PubMed] [Google Scholar]
- Burnstock G, Kennedy C. Is there a basis for distinguishing two types of p2-purinoceptor? Gen Pharmacol. 1985;16:433–440. doi: 10.1016/0306-3623(85)90001-1. [DOI] [PubMed] [Google Scholar]
- Burnstock G, Campbell G, Bennett M, Holman ME. Innervation of the guinea-pig taenia coli: are there intrinsic inhibitory nerves which are distinct from sympathetic nerves? Int J Neuropharmacol. 1964;3:163–166. doi: 10.1016/0028-3908(64)90003-6. [DOI] [PubMed] [Google Scholar]
- Collo G, North RA, Kawashima E, Merlo-Pich E, Neidhart S, Surprenant A, et al. Cloning of P2X5 and P2X6 receptors and the distribution and properties of an extended family of atp-gated ion channels. J Neurosci. 1996;16:2495–2507. doi: 10.1523/JNEUROSCI.16-08-02495.1996. [DOI] [PMC free article] [PubMed] [Google Scholar]
- Donato R, Rodrigues RJ, Takahashi M, Tsai MC, Soto D, Miyagi K, et al. GABA release by basket cells onto Purkinje cells, in rat cerebellar slices, is directly controlled by presynaptic purinergic receptors, modulating Ca2+ influx. Cell Calcium. 2008;44:521–532. doi: 10.1016/j.ceca.2008.03.006. [DOI] [PubMed] [Google Scholar]
- Fraichard A, Chassande O, Bilbaut G, Dehay C, Savatier P, Samarut J. In vitro differentiation of embryonic stem cells in glial cells and functional neurons. J Cell Sci. 1995;108:3181–3188. doi: 10.1242/jcs.108.10.3181. [DOI] [PubMed] [Google Scholar]
- Gomez-Villafuertes R, Gualix J, Miras-Portugal MT. Single gabaergic synaptic terminals from rat midbrain exhibit functional P2X and dinucleotide receptors, able to induce gaba secretion. J Neurochem. 2001;77:84–93. doi: 10.1046/j.1471-4159.2001.t01-1-00228.x. [DOI] [PubMed] [Google Scholar]
- Inoue K, Koizumi S, Ueno S. Implication of ATP receptors in brain functions. Prog Neurobiol. 1996;50:483–492. doi: 10.1016/s0301-0082(96)00037-8. [DOI] [PubMed] [Google Scholar]
- Jacobson KA, Costanzi S, Ohno M, Joshi BV, Besada P, Xu B, et al. Molecular recognition at purine and pyrimidine nucleotide (P2) receptors. Curr Top Med Chem. 2004;4:805–819. doi: 10.2174/1568026043450961. [DOI] [PMC free article] [PubMed] [Google Scholar]
- Jameson HS, Pinol RA, Mendelowitz D. Purinergic P2X receptors facilitate inhibitory gabaergic and glycinergic neurotransmission to cardiac vagal neurons in the nucleus ambiguus. Brain Res. 2008;1224:53–62. doi: 10.1016/j.brainres.2008.06.012. [DOI] [PMC free article] [PubMed] [Google Scholar]
- Kanjhan R, Housley GD, Burton LD, Christie DL, Kippenberger A, Thorne PR, et al. Distribution of the P2X2 receptor subunit of the ATP-gated ion channels in the rat central nervous system. J Comp Neurol. 1999;407:11–32. [PubMed] [Google Scholar]
- Kim DS, Kwak SE, Kim JE, Won MH, Kang TC. The co-treatments of vigabatrin and P2X receptor antagonists protect ischemic neuronal cell death in the gerbil hippocampus. Brain Res. 2006;1120:151–160. doi: 10.1016/j.brainres.2006.08.057. [DOI] [PubMed] [Google Scholar]
- Krugel U, Kittner H, Franke H, Illes P. Purinergic modulation of neuronal activity in the mesolimbic dopaminergic system in vivo. Synapse. 2003;47:134–142. doi: 10.1002/syn.10162. [DOI] [PubMed] [Google Scholar]
- Lang RJ, Haynes JM, Kelly J, Johnson J, Greenhalgh J, O'brien C, et al. Electrical and neurotransmitter activity of mature neurons derived from mouse embryonic stem cells by sox-1 lineage selection and directed differentiation. Eur J Neurosci. 2004;20:3209–3221. doi: 10.1111/j.1460-9568.2004.03782.x. [DOI] [PubMed] [Google Scholar]
- Moore D, Chambers J, Waldvogel H, Faull R, Emson P. Regional and cellular distribution of the P2Y(1) purinergic receptor in the human brain: Striking neuronal localisation. J Comp Neurol. 2000;421:374–384. doi: 10.1002/(sici)1096-9861(20000605)421:3<374::aid-cne6>3.0.co;2-z. [DOI] [PubMed] [Google Scholar]
- Moore DJ, Chambers JK, Wahlin JP, Tan KB, Moore GB, Jenkins O, et al. Expression pattern of P2Y receptor subtypes: a quantitative reverse transcription-polymerase chain reaction study. Biochim Biophys Acta. 2001;1521:107–119. doi: 10.1016/s0167-4781(01)00291-3. [DOI] [PubMed] [Google Scholar]
- Mori M, Heuss C, Gahwiler BH, Gerber U. Fast synaptic transmission mediated by P2X receptors in CA3 pyramidal cells of rat hippocampal slice cultures. J Physiol. 2001;535:115–123. doi: 10.1111/j.1469-7793.2001.t01-1-00115.x. [DOI] [PMC free article] [PubMed] [Google Scholar]
- North RA. Molecular physiology of P2X receptors. Physiol Rev. 2002;82:1013–1067. doi: 10.1152/physrev.00015.2002. [DOI] [PubMed] [Google Scholar]
- Raye WS, Tochon-Danguy N, Pouton CW, Haynes JM. Heterogeneous population of dopaminergic neurons derived from mouse embryonic stem cells: Preliminary phenotyping based on receptor expression and function. Eur J Neurosci. 2007;25:1961–1970. doi: 10.1111/j.1460-9568.2007.05489.x. [DOI] [PubMed] [Google Scholar]
- Rodrigues RJ, Almeida T, Richardson PJ, Oliveira CR, Cunha RA. Dual presynaptic control by atp of glutamate release via facilitatory P2X1, P2X2/3, and P2X3 and inhibitory P2Y1, P2Y2, and/or P2Y4 receptors in the rat hippocampus. J Neurosci. 2005;25:6286–6295. doi: 10.1523/JNEUROSCI.0628-05.2005. [DOI] [PMC free article] [PubMed] [Google Scholar]
- Safiulina VF, Kasyanova M, Sokolova E, Cherubini E, Giniatullin R. ATP contributes to the generation of network-driven giant depolarizing potentials in the neonatal rat hippocampus. J Physiol. 2005;565:981–992. doi: 10.1113/jphysiol.2005.085621. [DOI] [PMC free article] [PubMed] [Google Scholar]
- Simon J, Kidd EJ, Smith FM, Chessell IP, Murrell-Lagnado R, Humphrey PP, et al. Localization and functional expression of splice variants of the P2X2 receptor. Mol Pharmacol. 1997;52:237–248. doi: 10.1124/mol.52.2.237. [DOI] [PubMed] [Google Scholar]
- Soto F, Garcia-Guzman M, Gomez-Hernandez JM, Hollmann M, Karschin C, Stuhmer W. P2X4: An ATP-activated ionotropic receptor cloned from rat brain. Proc Natl Acad Sci USA. 1996;93:3684–3688. doi: 10.1073/pnas.93.8.3684. [DOI] [PMC free article] [PubMed] [Google Scholar]
- Stoop R, Surprenant A, North RA. Different sensitivities to ph of ATP-induced currents at four cloned P2X receptors. J Neurophysiol. 1997;78:1837–1840. doi: 10.1152/jn.1997.78.4.1837. [DOI] [PubMed] [Google Scholar]
- Strubing C, Ahnert-Hilger G, Shan J, Wiedenmann B, Hescheler J, Wobus AM. Differentiation of pluripotent embryonic stem cells into the neuronal lineage in vitro gives rise to mature inhibitory and excitatory neurons. Mech Dev. 1995;53:275–287. doi: 10.1016/0925-4773(95)00446-8. [DOI] [PubMed] [Google Scholar]
- Tanaka J, Murate M, Wang CZ, Seino S, Iwanaga T. Cellular distribution of the P2X4 ATP receptor mrna in the brain and non-neuronal organs of rats. Arch Histol Cytol. 1996;59:485–490. doi: 10.1679/aohc.59.485. [DOI] [PubMed] [Google Scholar]
- Von Kugelgen I. Pharmacological profiles of cloned mammalian P2Y-receptor subtypes. Pharmacol Ther. 2006;110:415–432. doi: 10.1016/j.pharmthera.2005.08.014. [DOI] [PubMed] [Google Scholar]
- Wildman SS, Brown SG, King BF, Burnstock G. Selectivity of diadenosine polyphosphates for rat p2x receptor subunits. Eur J Pharmacol. 1999;367:119–123. doi: 10.1016/s0014-2999(98)00976-5. [DOI] [PubMed] [Google Scholar]
- Xiao C, Zhou C, Li K, Davies DL, Ye JH. Purinergic type 2 receptors at GABAergic synapses on ventral tegmental area dopamine neurons are targets for ethanol action. J Pharmacol Exp Ther. 2008;327:196–205. doi: 10.1124/jpet.108.139766. [DOI] [PMC free article] [PubMed] [Google Scholar]