Abstract
Knowledge of resonant frequencies of contrast microbubbles is important for the optimization of ultrasound contrast imaging and therapeutic techniques. To date, however, there are estimates of resonance frequencies of contrast microbubbles only for the regime of linear oscillation. The present paper proposes an approach for evaluating resonance frequencies of contrast agent microbubbles in the regime of nonlinear oscillation. The approach is based on the calculation of the time-averaged oscillation power of the radial bubble oscillation. The proposed procedure was verified for free bubbles in the frequency range 1–4 MHz and then applied to lipid-shelled microbubbles insonified with a single 20-cycle acoustic pulse at two values of the acoustic pressure amplitude, 100 kPa and 200 kPa, and at four frequencies: 1.5, 2.0, 2.5, and 3.0 MHz. It is shown that, as the acoustic pressure amplitude is increased, the resonance frequency of a lipid-shelled microbubble tends to decrease in comparison with its linear resonance frequency. Analysis of existing shell models reveals that models that treat the lipid shell as a linear viscoelastic solid appear may be challenged to provide the observed tendency in the behavior of the resonance frequency at increasing acoustic pressure. The conclusion is drawn that the further development of shell models could be improved by the consideration of nonlinear rheological laws.
Keywords: Contrast agent, Lipid shell, Resonance frequency
1. Introduction
Knowledge of resonant frequencies of contrast agent microbubbles is an important factor for ultrasound contrast imaging and therapeutic techniques. For example, matching the resonant frequency of a contrast agent to the transmitted frequency provides optimized conditions for generating acoustic radiation force, which has shown to be beneficial in the enhancement of adhesion of targeted agents and drug delivery [1–3]. Imaging techniques such as subharmonic imaging take advantage of the bubbles subharmonic response which can be optimized by utilizing a transmitted frequency of twice the contrast agent’s resonant frequency [4–6].
The resonant properties of contrast agents are dependent on the parameters of encapsulation and the ambient medium. Moreover, at high acoustic pressures, the resonance frequency of an encapsulated bubble is expected to be also dependent perceptibly on the acoustic pressure amplitude like that of a free bubble [7]. Therefore it is important to have a method that could predict, for a given sort of contrast agent and given acoustic conditions, the value of the transmitted frequency at which the contrast agent resonates.
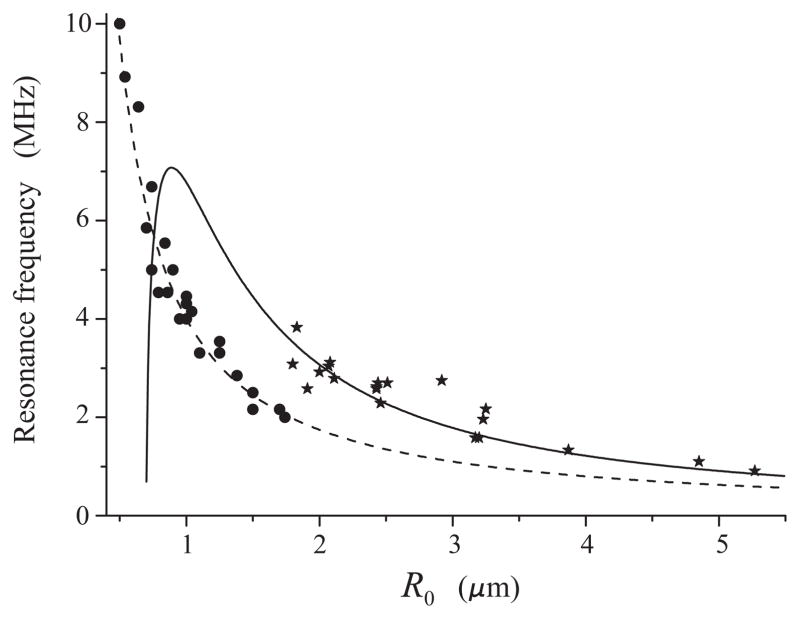
The subject of our interest in this paper is lipid-shelled contrast agents. Currently there are experimental estimates of resonance frequencies of lipid-shelled microbubbles only for the regime of linear oscillations [8,9]. However, even for the linear regime, there is little agreement between data obtained by different authors. Figure 1 compares experimental data obtained by Sun et al. [8] for the contrast agent Definity® (circles) with data obtained by van der Meer et al. [9] for the contrast agent BR-14 (asterisks). The dashed line shows the linear damped resonance frequency for a free (unencapsulated) bubble, calculated by equation (2), see section 2. The solid line shows the linear damped resonance frequency for an encapsulated bubble assuming that the encapsulating shell is described by de Jong’s model, see (8) – (10) in section 4 and the values of the shell parameters ibid. Both Definity® and BR-14 are lipid-shelled perfluorocarbon-core agents so one would expect that their resonance frequencies are close. However, one can see from Fig. 1 that Sun et al.’s data are close to resonance frequencies of free bubbles while van der Meer et al.’s data show a considerable increase in resonance frequencies as compared with free bubbles.
Fig. 1.
Experimentally determined resonance frequency versus equilibrium radius for lipid-shelled bubbles in the regime of linear oscillations. Circles indicate experimental estimates obtained by Sun et al. [8] for Definity®. Asterisks indicate experimental estimates obtained by van der Meer et al. [9] for BR-14. The dashed line shows the linear resonance frequency for a free bubble, calculated by (2). The solid line shows the linear resonance frequency for an encapsulated bubble, calculated by (8) – (10).
The objectives of the present paper are
To propose a method for evaluating resonance frequencies of contrast agent microbubbles at high acoustic pressure amplitudes when the bubble oscillation is essentially nonlinear.
To test the proposed method against free (unencapsulated) bubbles in order to demonstrate that it provides correct results.
To estimate then resonance frequencies of lipid-shelled microbubbles in the regime of nonlinear oscillations, using experimental radius-time curves at different acoustic pressure amplitudes.
It is known that in the regime of nonlinear oscillations the resonance frequency of an oscillatory system can both decrease and increase depending on the material parameters of the system. For example, resonance frequencies of free bubbles decrease with increasing acoustic pressure [7]. It is shown in this paper that resonance frequencies of lipid-shelled microbubbles decrease as well. In the context of this result, a comparison between different shell models is carried out the purpose of which is to check whether the existing shell models are capable of predicting the said downward tendency.
2. Free bubbles
As pointed out above, we start with considering free (unencapsulated) bubbles. The linear resonance frequency of a free bubble is known to be given by the Minnaert formula [10]:
| (1) |
where ω0 is the angular resonance frequency of a bubble with equilibrium radius R0, γ is the ratio of specific heats of the gas inside the bubble, P0 is the hydrostatic pressure in the surrounding liquid, ρ0 is the equilibrium density of the liquid, and σ is the surface tension at the gas-liquid interface. It should be noted, however, that because of damping effects the real resonance frequency is different from ω0 and given by [11,12]
| (2) |
where c is the speed of sound in the surrounding liquid and the viscous damping constant δη is defined as with ηL denoting the shear viscosity of the surrounding liquid.
For the regime of nonlinear oscillations, there are no analytical formulas similar to (1) and (2), so resonance frequencies can be evaluated only by numerical calculations. To calculate resonance frequencies of gas bubbles in the nonlinear regime, Lauterborn [7] used the so-called normalized amplitude RN = (Rmax − R0)/R0, where Rmax denotes the maximum radius of the bubble during its steady-state oscillation. Lauterborn calculated numerically RN as a function of the driving frequency ω for various values of initial bubble radii and then determined the resonance frequency of a bubble with initial radius R0 as the value of ω that corresponds to the main peak of the RN −ω curve obtained for this bubble.
Lauterborn’s approach is, however, not quite adequate in the case of medical ultrasonic applications. First, Lauterborn dealt with continuous sinusoidal waves while in medical ultrasonics, insonation is normally in the form of a pulse consisting of only a few acoustic cycles, so it is often difficult to determine the value of the instantaneous radius R(t) which should be accepted as Rmax, in addition to the fact that in some cases the bubble does not reach the steady-state oscillation. Second, it is difficult to apply Lauterborn’s approach in the case that resonance frequencies are estimated from experimental data since due to random fluctuations and measurement errors the amplitude of experimental radius-time curves is not constant even if the steady-state oscillation occurs. Finally, when experimental data are processed, one normally has a fixed driving frequency and a set of radius-time curves measured at this frequency for bubbles of different size. In other words, in experiments, the initial bubble radius is a variable quantity rather than the driving frequency.
For such cases, Lauterborn’s approach can be generalized. Instead of the normalized amplitude, we propose to calculate the following quantity:
| (3) |
where f = ω/2π and T is the duration of the bubble oscillation (or the duration of the driving acoustic pulse). The dimensionless quantity W (f, R0) has the sense of time-averaged oscillation power at a given frequency f for a bubble with equilibrium radius R0. This oscillation power can be plotted as a function of R0 at a fixed frequency f. The resonance radius for this frequency is then determined as the value of R0 that corresponds to the main maximum of this plot. This method can be applied to both theoretical and experimental radius-time curves.
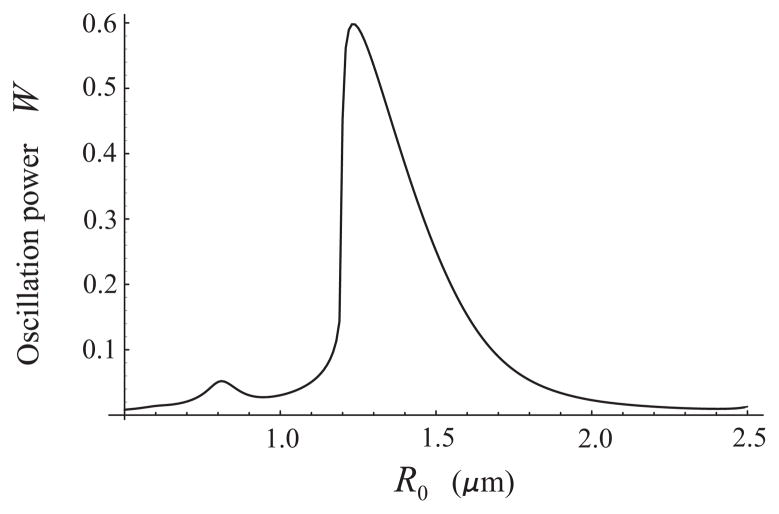
Figure 2 provides an example of a theoretical W−R0 curve assuming that the excitation is a single 20-cycle acoustic pulse with a pressure amplitude of 100 kPa and a center frequency of 2.5 MHz. One can see from Fig. 2 that the resonant radius for 2.5 MHz at 100 kPa is 1.23 μm. Radius-time curves used to plot Fig. 2 were calculated by the following equations [13,14]:
| (4) |
| (5) |
| (6) |
| (7) |
where the overdot denotes the time derivative, x(t) is the position of the center of the bubble in an inertial frame, mb is the mass of the bubble, Pac (x, t) is the driving acoustic pressure at the location of the bubble centroid, and Fd is the viscous drag force which is taken in the form of Levich’s law [15]. Eq. (4) governs the radial oscillation of the bubble and (5) its translation. The second term on the left-hand side of (5) is the added mass force and the first term on the right-hand side is the acoustic radiation force. At high acoustic pressure amplitudes, the effect of translation on the radial oscillation is no longer negligible. Therefore here, although of our prime interest is the radial oscillation, the translational motion is also taken into account. The values of the physical parameters used in the calculations are: P0=101.3 kPa, ρ0 = 1000 kg/m3, ηL = 0.001 Pa·s, c = 1500 m/s, σ = 0.072 N/m, and γ = 1.07. The value of the polytropic exponent corresponds to the ratio of specific heats for perfluorocarbon, a gas which is used in lipid-shelled contrast agents. We use the same value for free bubbles to make the comparison with lipid-shelled bubbles more adequate.
Fig. 2.
Oscillation power as a function of equilibrium radius for free bubbles. The excitation is a 20-cycle, 2.5 MHz, 100 kPa acoustic pulse.
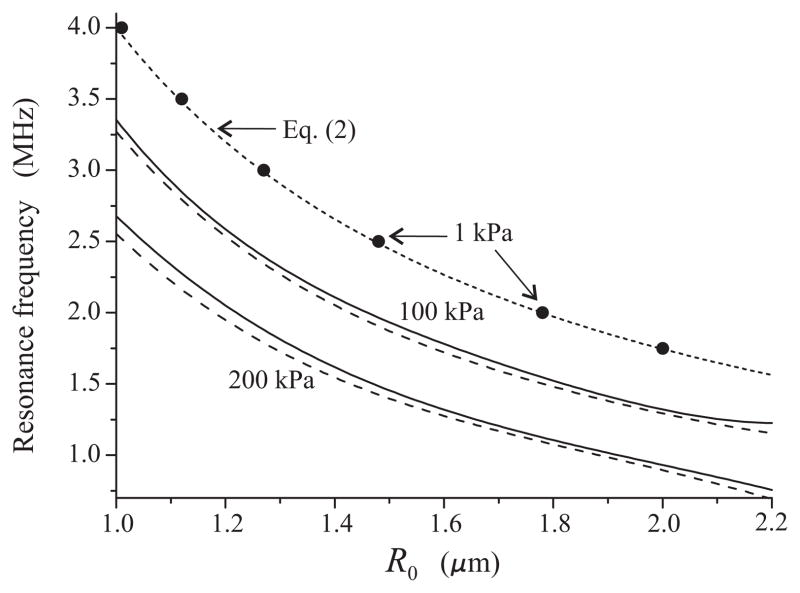
The dependence between the frequency of resonance response and the equilibrium radius which was obtained by means of W− R0 curves analogous to that in Fig. 2, is shown in Fig. 3 by solid lines for two values of acoustic pressure, 100 kPa and 200 kPa. The excitation is a single 20-cycle acoustic pulse (chosen to maximize the microbubble oscillation within the time window captured by the high-speed camera for experimental data). The frequency range was chosen to correspond to frequencies commonly used in medical ultrasound examinations. The dotted line was calculated by (2), i.e., it gives the linear damped resonance frequency. As a check of the applied method, the closed circles on the dotted line show values that were calculated by (3) at a pressure amplitude of 1 kPa. It is seen that, as they must, these values coincide with the results of (2). Also, the dashed lines show the results obtained by Lauterborn’s method assuming the excitation to be a continuous sinusoidal wave. All these checks confirm the correctness of the oscillation power method. It is also interesting to note that, as might be expected, in continuous waves, the nonlinear effects manifest themselves stronger so the decrease in resonance frequencies is slightly larger than in the pulse wave.
Fig. 3.
Resonance frequency versus equilibrium radius for free bubbles at increasing values of the acoustic pressure amplitude. The dotted line corresponds to the linear damped resonance frequency given by (2). The excitation is a 20-cycle acoustic pulse. The dashed lines represent results obtained in the case that the excitation is a continuous sinusoidal wave of the same amplitude.
3. Lipid-shelled bubbles
In this section, the oscillation power method is applied to evaluate resonance frequencies of lipid-shelled microbubbles in the regime of nonlinear oscillation. Experimental radius-time curves are used which were acquired for a lab-made lipid-shelled perfluorocarbon contrast agent. The formulation of these microbubbles, which consisted of a DSPC:DSPE-PEG2000 monolayer shell and a decafluorobutane gas core, has been described previously in detail [16]. The microbubbles were insonified with a single 20-cycle acoustic pulse at two values of the acoustic pressure amplitude, 100 kPa and 200 kPa, and at four frequencies: 1.5, 2.0, 2.5, and 3.0 MHz. The radius-time curves were optically recorded using a high speed imaging system described in detail previously [17,18].
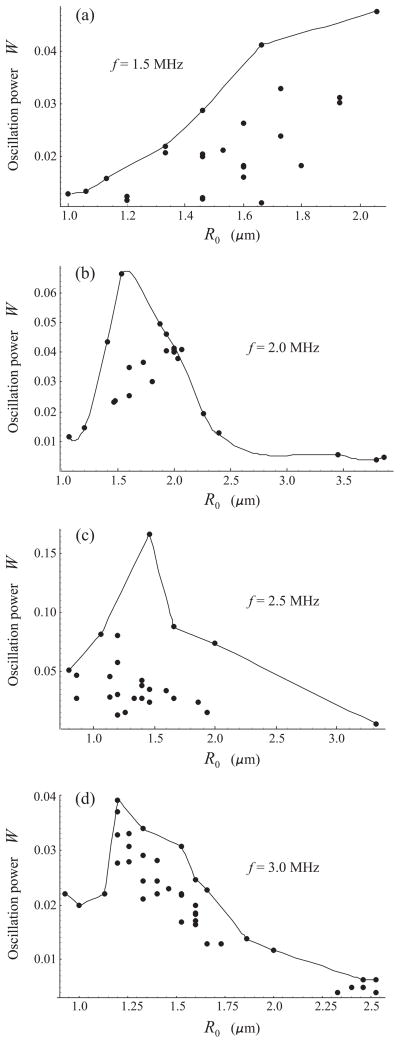
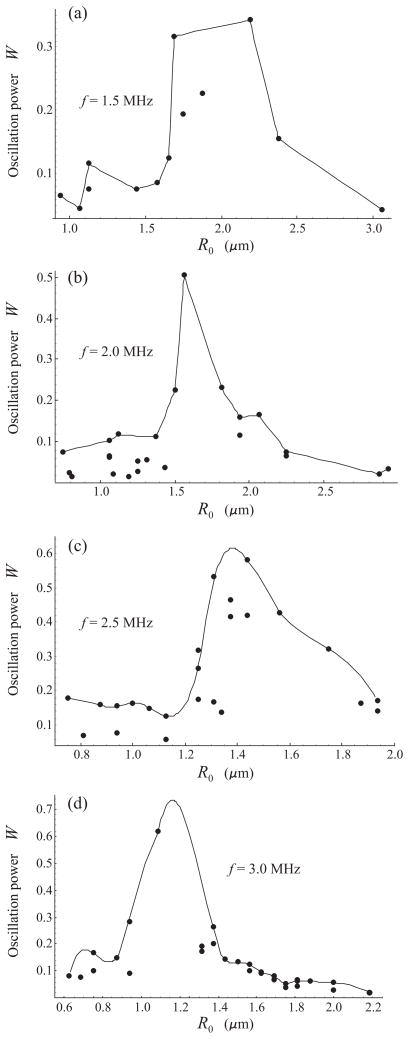
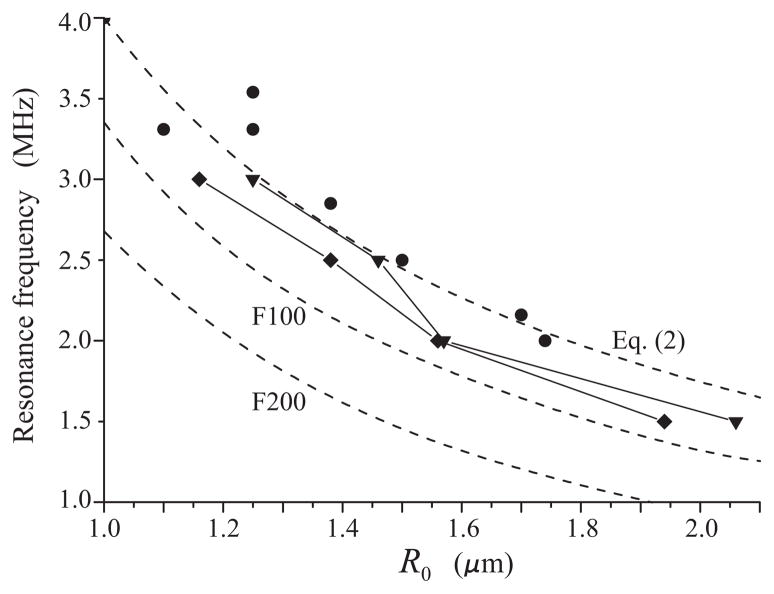
The results obtained by applying equation (3) to the experimental R − t curves are displayed by circles in Fig. 4 for 100 kPa and Fig. 5 for 200 kPa. The solid lines show a polynomial interpolation for the envelopes of the experimental points. The interpolation was made using the program package MATHEMATICA. The peaks of the interpolation curves correspond to supposed resonant radii. The values of the resonance frequencies and the corresponding bubble radii, obtained for 100 kPa from Fig. 4, are shown by triangles in Fig. 6. The results for 200 kPa, obtained from Fig. 5, are shown by diamonds. The dashed lines in Fig. 6, marked by F100 and F200, represent the resonance frequency-initial radius curves for free bubbles at 100 kPa and 200 kPa, respectively, and the upper dashed line, marked by Eq. (2), shows the linear damped resonance frequency for a free bubble which was calculated by equation (2). Finally, the circles represent the experimental data obtained by Sun et al. for the contrast agent Definity® in the linear regime [8].
Fig. 4.
Oscillation power versus equilibrium radius for lipid-shelled bubbles insonified with a 20-cycle, 100 kPa acoustic pulse at four frequencies. Circles indicate results obtained from experimental radius-time curves. The solid lines show a polynomial interpolation for the envelopes of the experimental points.
Fig. 5.
Oscillation power versus equilibrium radius for lipid-shelled bubbles insonified with a 20-cycle, 100 kPa acoustic pulse at four frequencies. Circles indicate results obtained from experimental radius-time curves. The solid lines show a polynomial interpolation for the envelopes of the experimental points.
Fig. 6.
Resonance frequency versus equilibrium radius for lipid-shelled bubbles. Triangles and diamonds indicate experimental estimates following from Fig. 4 (100 kPa) and Fig. 5 (200 kPa), respectively. The F100 and F200 curves correspond to free bubbles under the same acoustic conditions. Circles indicate experimental estimates obtained by Sun et al. [8] for the linear regime.
It is known from classical mechanics [19] that in the regime of nonlinear oscillation, the resonance frequency of an oscillatory system can both decrease and increase depending on the material parameters of the system. Figure 6 suggests that the resonance frequency of a lipid-shelled microbubble tends to decrease with increasing acoustic pressure, although the decrease is not as significant as that for a free bubble.
4. Discussion
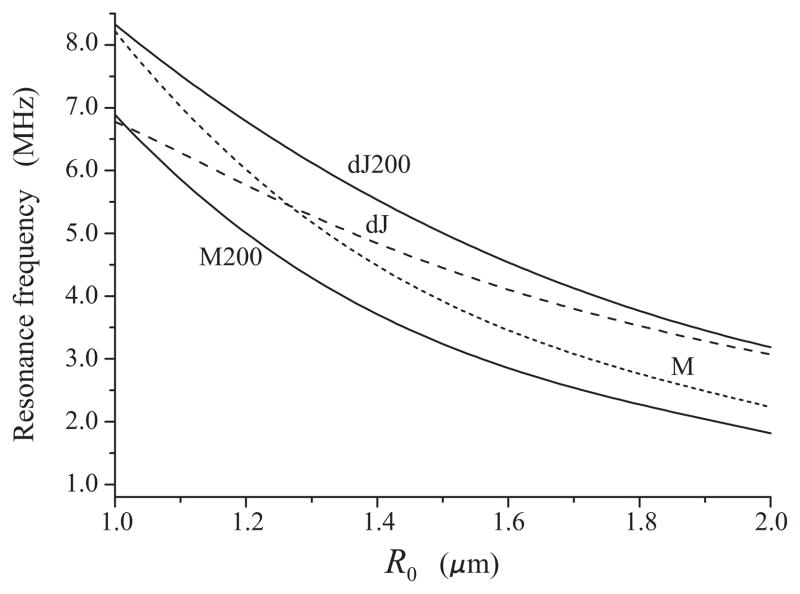
The question arises as to whether the result obtained in the preceding section is consistent with existing shell models. Do currently available models for lipid-coated microbubbles predict the same tendency, a decrease in the resonance frequency with increasing acoustic pressure, or not? Let us consider shell models based on two different rheological laws. Several models exist that consider the lipid shell as a linear viscoelastic solid. Among these models are the Sarkar [20], the Kelvin-Voigt [21,22], and the de Jong model [9]. In contrast, we have recently proposed a Maxwell model which assumes that the lipid shell behaves as a linear viscoelastic fluid [12]. It should be emphasized that the purpose of our comparison is not to determine which of these models better fits the experimental radius-time curves. Our aim is to compare the predictive capabilities of the two models in regard to the behavior of the resonance frequency at increasing acoustic pressure. For sake of evaluation of a bubble shell as a viscoelastic solid, we utilize the de Jong model, which has demonstrated good agreement with experimental data in linear regimes. This comparison is found to yield interesting results which are presented in Fig. 7.
Fig. 7.
Comparison of the de Jong and the Maxwell shell models. The dJ and dJ200 curves are given by the de Jong model in the linear regime and at 200 kPa, respectively. The M and M200 curves are given by the Maxwell model in the linear regime and at 200 kPa, respectively.
In Fig. 7, the dashed line, marked by dJ, shows the linear damped resonance frequency for an encapsulated bubble assuming that the encapsulating shell is described by the de Jong model. This curve was calculated by the following equations [9]:
| (8) |
| (9) |
| (10) |
where χ is the shell elasticity parameter and κS is the shell dilatational viscosity. The calculation was made at the values of the shell parameters which were obtained experimentally for lipid-shelled bubbles by van der Meer et al. [9]: χ = 0.54 N/m and κS = 10−8 kg/s. The upper solid line in Fig. 7, marked by dJ200, represents the dependence between the resonance frequency and the equilibrium radius that is predicted by the de Jong model at 200 kPa. This curve was calculated by the oscillation power method at the same shell parameters as for the dashed dJ line. Specifically, the radial dynamics of lipid-shelled bubbles was simulated by equation (4) of van der Meer et al.’s work [9]. One can see that the de Jong model predicts an increase in resonance frequencies contrary to the experimental estimates presented in Fig. 6. In the belief that the experimental estimates are correct, this disagreement suggests that either the values of the shell parameters which were evaluated by van der Meer et al. for the linear regime, are not suitable for the nonlinear regime, or the assumption that the lipid shell behaves as a linear viscoelastic solid may not be adequate.
Let us now consider the Maxwell shell model [12], which treats the lipid shell as a linear vis-coelastic fluid. In the limit of thin shell, the Maxwell model can be represented in the zero-thickness form as follows
| (11) |
| (12) |
| (13) |
where
| (14) |
| (15) |
κSM is the shell dilatational viscosity, λ is the shell relaxation time, and G denotes the right-hand side of (11). It will be recalled that our purpose here is only to check what tendency is predicted by the Maxwell model. Therefore the values of the shell parameters for the Maxwell model were chosen in such a way that in the linear regime the Maxwell model, as far as possible, gives values of the same order of magnitude as the de Jong model: κSM = 2.0×10⁻⁸ kg/s and λ = 0.03 μs. With these parameters, the Maxwell model in the linear regime gives the dotted line marked by M. With the same parameters at 200 kPa, the Maxwell model gives the lower solid line marked by M200. Thus, the Maxwell model predicts a decrease in resonance frequencies with increasing acoustic pressure.
In recent years, a number of experimental observations have been made that cannot be explained on the basis of the existing shell models. De Jong et al. [23] discovered the “compression-only” behavior of phospholipid-coated bubbles that implies that in some cases tested the microbubbles only compressed and hardly expanded beyond their initial diameters. Another confusing observation is the dependence of shell parameters on the initial bubble radius. Some models based on the assumption that the lipid shell behaves as a linear viscoelastic solid report that the fitting of experimental radius-time curves indicate that the shell viscosity increases considerably with the initial bubble radius [9,17]. In [24,25], it is reported that the shell elasticity behaves similarly. For the Maxwell shell model, an increase in the shell relaxation time and the shell viscosity with increasing bubble radius is observed as well [26]. Another experimental effect unaccountable by the existing models is the existence of an acoustic pressure threshold for the onset of microbubble pulsation [27]. The behavior of the resonance frequency suggested here supplements this list of unsolved problems.
We believe that if the resonance frequency of a lipid-shelled microbubble decreases with increasing acoustic pressure, it may suggest that further consideration of the rheological properties of the microbubble shell is needed. We propose the Maxwell model as one alternative, however, this result by no means implies that a viscoelastic fluid is the only possible way. For example, Tsiglifis and Pe-lekasis [28] have demonstrated that the model of a nonlinear viscoelastic solid can provide a decrease in the resonance frequency with increasing sound amplitude if a strain-softening rheological law, such as the Mooney-Rivlin law [29], is used to describe the viscoelastic properties of the lipid shell. Do-inikov et al. [30] also show that the inclusion of nonlinear shell viscosity allows one to model the “compression-only” behavior and reduce the dependence of the shell viscous coefficient on the initial bubble radius. These results suggest that nonlinear theory may be required that can take into account a more complex rheological nature of the lipid shell.
Acknowledgments
A.A.D. wishes to acknowledge the financial support of the International Science and Technology Center (ISTC) under Contract B-1213. P.A.D. and J.F.H. provided experimental data and are supported by the NIH Roadmap for Medical Research, EB005325. We thank Katherine Ferrara for use of the high-speed imaging system.
Footnotes
Publisher's Disclaimer: This is a PDF file of an unedited manuscript that has been accepted for publication. As a service to our customers we are providing this early version of the manuscript. The manuscript will undergo copyediting, typesetting, and review of the resulting proof before it is published in its final citable form. Please note that during the production process errors may be discovered which could affect the content, and all legal disclaimers that apply to the journal pertain.
References
- 1.Zhao S, Borden M, Bloch SH, Kruse D, Ferrara KW, Dayton PA. Radiation-force assisted targeting facilitates ultrasonic molecular imaging. Mol Imaging. 2004;3:135–148. doi: 10.1162/1535350042380317. [DOI] [PMC free article] [PubMed] [Google Scholar]
- 2.Rychak JJ, Klibanov AL, Ley KF, Hossack JA. Enhanced targeting of ultrasound contrast agents using acoustic radiation force. Ultrasound Med Biol. 2007;33:1132–1139. doi: 10.1016/j.ultrasmedbio.2007.01.005. [DOI] [PubMed] [Google Scholar]
- 3.Shortencarier MJ, Dayton PA, Bloch SH, Schumann PA, Matsunaga TO, Ferrara KW. A method for radiation-force localized drug delivery using gas-filled lipospheres. IEEE Trans Ultrason Ferroelectr Freq Contr. 2004;51:822–831. doi: 10.1109/tuffc.2004.1320741. [DOI] [PubMed] [Google Scholar]
- 4.Chomas J, Dayton P, May D, Ferrara K. Nondestructive subharmonic imaging. IEEE Trans Ultrason Ferroelectr Freq Contr. 2002;49:883–892. doi: 10.1109/tuffc.2002.1020158. [DOI] [PubMed] [Google Scholar]
- 5.de Jong N, Frinking PJ, Bouakaz A, Ten Cate FJ. Detection procedures of ultrasound contrast agents. Ultrasonics. 2000;38:87–92. doi: 10.1016/s0041-624x(99)00071-2. [DOI] [PubMed] [Google Scholar]
- 6.Shi WT, Forsberg F, Raichlen JS, Needleman L, Goldberg BB. Pressure dependence of sub-harmonic signals from contrast microbubbles. Ultrasound Med Biol. 1999;25:275–283. doi: 10.1016/s0301-5629(98)00163-x. [DOI] [PubMed] [Google Scholar]
- 7.Lauterborn W. Numerical investigation of nonlinear oscillations of gas bubbles in liquids. J Acoust Soc Am. 1976;59:283–293. [Google Scholar]
- 8.Sun Y, Kruse DE, Dayton PA, Ferrara KW. High-frequency dynamics of ultrasound contrast agents. IEEE Trans Ultrason Ferroelectr Freq Contr. 2005;52:1981–1991. doi: 10.1109/tuffc.2005.1561667. [DOI] [PMC free article] [PubMed] [Google Scholar]
- 9.van der Meer SM, Dollet B, Voormolen MM, Chin CT, Bouakaz A, de Jong N, Versluis M, Lohse D. Microbubble spectroscopy of ultrasound contrast agents. J Acoust Soc Am. 2007;121:648–656. doi: 10.1121/1.2390673. [DOI] [PubMed] [Google Scholar]
- 10.Minnaert M. On musical air bubbles and the sound of running water. Philos Mag. 1933;16:235–243. [Google Scholar]
- 11.Prosperetti A. Thermal effects and damping mechanisms in the forced radial oscillations of gas bubbles in liquids. J Acoust Soc Am. 1977;61:17–27. [Google Scholar]
- 12.Doinikov AA, Dayton PA. Maxwell rheological model for lipid-shelled ultrasound microbub-ble contrast agents. J Acoust Soc Am. 2007;121:3331–3340. doi: 10.1121/1.2722233. [DOI] [PMC free article] [PubMed] [Google Scholar]
- 13.Doinikov AA. Translational motion of a spherical bubble in an acoustic standing wave of high intensity. Phys Fluids. 2002;14:1420–1425. [Google Scholar]
- 14.Doinikov AA. Equations of coupled radial and translational motions of a bubble in a weakly compressible liquid. Phys Fluids. 2005;17:128101-1–4. [Google Scholar]
- 15.Levich BV. Physicochemical Hydrodynamics. Prentice-Hall; Englewood Cliffs, NJ: 1962. p. 445. [Google Scholar]
- 16.Borden MA, Kruse DE, Caskey CF, Zhao S, Dayton PA, Ferrara KW. Influence of lipid shell physicochemical properties on ultrasound-induced microbubble destruction. IEEE Trans Ultrason Ferroelectr Freq Contr. 2005;52:1992–2002. doi: 10.1109/tuffc.2005.1561668. [DOI] [PMC free article] [PubMed] [Google Scholar]
- 17.Morgan KE, Allen JS, Dayton PA, Chomas JE, Klibanov AL, Ferrara KW. Experimental and theoretical evaluation of microbubble behavior: Effect of transmitted phase and bubble size. IEEE Trans Ultrason Ferroelectr Freq Contr. 2000;47:1494–1509. doi: 10.1109/58.883539. [DOI] [PubMed] [Google Scholar]
- 18.Dayton PA, Allen JS, Ferrara KW. The magnitude of radiation force on ultrasound contrast agents. J Acoust Soc Am. 2002;112:2183–2192. doi: 10.1121/1.1509428. [DOI] [PubMed] [Google Scholar]
- 19.Landau LD, Lifshitz EM. Mechanics. § 29. Pergamon; Oxford: 1976. pp. 87–93. [Google Scholar]
- 20.Sarkar K, Shi WT, Chatterjee D, Forsberg F. Characterization of ultrasound contrast micro-bubbles using in vitro experiments and viscous and viscoelastic interface models for encapsulation. J Acoust Soc Am. 2005;118:539–550. doi: 10.1121/1.1923367. [DOI] [PubMed] [Google Scholar]
- 21.Church CC. The effect of an elastic solid surface layer on the radial pulsations of gas bubbles. J Acoust Soc Am. 1995;97:1510–1521. [Google Scholar]
- 22.Doinikov AA, Dayton PA. Spatio-temporal dynamics of an encapsulated gas bubble in an ultrasound field. J Acoust Soc Am. 2006;120:661–669. doi: 10.1121/1.2215228. [DOI] [PMC free article] [PubMed] [Google Scholar]
- 23.de Jong N, Emmer M, Chin CT, Bouakaz A, Mastik F, Lohse D, Versluis M. “Compression-only” behavior of phospholipid-coated contrast bubbles. Ultrasound Med Biol. 2007;33:653–656. doi: 10.1016/j.ultrasmedbio.2006.09.016. [DOI] [PubMed] [Google Scholar]
- 24.Chetty K, Sennoga CA, Hainal JV, Eckersley RJ, Stride E. High speed optical observations and simulation results of lipid based microbubbles at low insonation pressures. Proceedings of the 2006 IEEE International Ultrasonics Symposium; Vancouver, Canada: IEEE; 2006. pp. 1354–1357. [Google Scholar]
- 25.Doinikov AA, Haac J, Dayton PA. New theoretical models for lipid-shelled ultrasound contrast agents. DVD-ROM Proc. of Acoustics’08; Paris, France. June 29 - July 4, 2008; pp. 2287–2292. [Google Scholar]
- 26.Doinikov AA, Dayton PA. Nonlinear dynamics of lipid-shelled ultrasound microbubble contrast agents. In: Mammoli AA, Brebbia CA, editors. Computational Methods in Multiphase Flow IV. WIT press; Southampton, UK: 2007. pp. 261–270. [Google Scholar]
- 27.Emmer M, van Wamel A, Goertz DE, de Jong N. The onset of microbubble vibration. Ultrasound Med Biol. 2007;33:941–949. doi: 10.1016/j.ultrasmedbio.2006.11.004. [DOI] [PubMed] [Google Scholar]
- 28.Tsiglifis K, Pelekasis NA. Nonlinear radial oscillations of encapsulated microbubbles subject to ultrasound: The effect of membrane constitutive law. J Acoust Soc Am. 2008;123:4059–4070. doi: 10.1121/1.2909553. [DOI] [PubMed] [Google Scholar]
- 29.Mooney M. A theory for large elastic deformation. J Appl Phys. 1940;11:582–597. [Google Scholar]
- 30.Doinikov AA, Haac J, Dayton PA. Modeling of nonlinear viscous stress in encapsulating shells of lipid-coated contrast agent microbubbles. Ultrasonics. doi: 10.1016/j.ultras.2008.09.007. (submitted) [DOI] [PMC free article] [PubMed] [Google Scholar]


