

Abstract
Background:
Skin tags are common benign skin tumors usually occurring on the neck and major flexors of elder people.
Aims:
The aim of this study is to perform quantitation of mast cells and collagen fibers in skin tags and normal skin in diabetics and nondiabetics, to find a possible correlation between mast cells and collagen fibers in the pathogenesis of skin tags.
Methods:
Thirty participants with skin tags were divided into two groups (15 diabetic and 15 nondiabetic). Three biopsies were obtained from one anatomical site: A large skin tag, a small skin tag, and adjacent normal skin. Mast cells stained with Bismarck brown were counted manually in ten different fields of each section with magnification ×1000 and the average count was correlated with the percentage of mean collagen area in five fields done by the image analyzer.
Results:
A statistically significant correlation between mast cell count and percentage of collagen mean area was detected in both studied groups (except in large skin tags of the nondiabetic group).
Conclusion:
The positive correlation between mast cell count and percentage of collagen mean area suggests the critical role of mast cells in the etiogenesis of skin tags through its interaction with fibroblasts.
Keywords: Image analyzer, mast cells, mean collagen area %, skin tags, Bismarck brown
Introduction
Skin tags are small flesh colored to dark brown sessile or pedunculated papillomas commonly occuring on the neck, frequently seen in axilla and eyelids, less often on the trunk and groin. Both sexes have the same incidence.[1] Histologically, they are composed of loose collagen fibers and dilated capillaries.[2] Skin tags has been reported to be associated with many diseases, the list includes diabetes mellitus,[3] obesity,[4] acromegaly,[5] Crohn's disease,[6] aging,[7] child abuse,[8] organ transplants,[9] and colonic polyps.[10] It was also recorded with pregnancy[11] and human papilloma virus.[12] In 2007, Zaher et al.[13] recorded an increase in mast cell count in skin tags than normal skin.
The aim of this study is to perform quantitation of mast cells and collagen fibers in skin tags and normal skin in diabetics and nondiabetics, to find a possible correlation between mast cells and collagen fibers in the pathogenesis of skin tags.
Materials and Methods
For this study, 30 participants attending the outpatient clinic seeking for the removal of their skin tags were divided into two groups:
Group I: This group consisted of 15 nondiabetic participants, four males and 11 females with ages ranging between 25 and 55 years with a mean of 41.67 ± 9.9 years.
Group II: This group consisted of 15 diabetic participants, six males and nine females with ages ranging between 37 and 75 years with a mean of 53±10.29 years. Following general skin examination, the number, site, color, shape, and consistency of skin tags were recorded. The random blood sugar estimation for all participants was performed and documented. From each participant, three biopsies were taken in the same area (neck) as follows: Large skin tag (length > 4 mm, small skin tag (length < 2 mm), and normal skin (as a control). For local anesthesia, 1% xylocaine was injected around the area to be biopsied. Skin biopsy specimens were taken with a punch biopsy instrument 4 mm in diameter. Biopsies were fixed in 10% formalin solution for 24 h. All biopsies were processed by routine paraffin technique. Sections of 4 μm in thickness were cut as near the middle of the biopsy as possible and perpendicular to the skin surface. Each section was stained with Bismarck brown stain for mast cells[14] and Masson's trichrome stain for collagen fibers.[15]
Mast cell count
Mast cells were counted manually in ten different fields of each section using an Olympus microscope with magnification ×1000. All mast cell profiles were counted. All counts were done by the same doctor. Masson's trichrome stained collagen fibers in the form of dense green deposits of a fixed degree were submitted for image analysis using Leica Imaging System, Ltd., Cambridge, England (Leica Qwin), which is formed of a personal computer connected to a microscope. The image analyzer was first calibrated to convert the measurement unit produced by the image analyzer program (pixels) into actual micrometer units. Five fields from each section were selected and the area percent of the dense green deposits were measured by the image analyzer in relation to a standard measuring frame which was 7286.8 μm2 using magnification ×400. The area percent obtained from the image analyzer was subjected to statistical analysis.
Statistical analysis
Data were statistically described in terms of range, mean ± standard deviation (±SD), median, frequencies (number of cases), and relative frequencies (percentages) when appropriate. The comparison of quantitative variables between the study groups was done using Mann–Whitney U test for independent samples. The comparison of different groups within each group was done using Freidman analysis of variance (ANOVA) test with posthoc multiple two-group comparisons. For comparing categorical data, Chi square (χ2) test was performed. Exact test was used instead when the expected frequency is less than 5. A probability value (P value) less than 0.05 was considered to be statistically significant. All statistical calculations were done using computer programs Microsoft Excel version 7(Microsoft corporation, NY, USA). SPSS (Statistical Package for the Social Science: SPSS Inc., Chicago, IL, USA) and Arcus QuickStat (Biomedical), (Arcus Statistical Software, Research Solutions, Addison Wesley Longman Ltd. USA).
Results
Comparison between mast cell count in skin tags and normal skin in both studied groups
Mast cell count in large ST of diabetic group was statistically higher than the nondiabetic group P value = 0.001 (P < 0.05). Similarly, mast cell count in small ST of diabetic group was statistically higher than the nondiabetic group P value = 0.035 (P < 0.05). Mast cell count in control normal skin of diabetic group was statistically higher than the nondiabetic group P value = 0.001 (P < 0.05) [Table 1] [Figures 1 and 2] .
Table 1.
Comparison between mast cell count in skin tags and normal skin in both studied groups
| Study population | Large ST | Small ST | Normal skin | |
|---|---|---|---|---|
| No. of cases | 15 | 14 | 15 | |
| Group I | Mean | 7.33 | 9.86 | 7.47 |
| (Non DM) | SD | 3.68 | 5.59 | 2.9 |
| Maximum | 18 | 22 | 14 | |
| Median | 7 | 8 | 6 | |
| Minimum | 3 | 4 | 4 | |
| No. of cases | 14 | 14 | 15 | |
| Group II | Mean | 17.64 | 15.64 | 13.73 |
| (DM) | SD | 6.89 | 7.09 | 3.13 |
| Maximum | 26 | 25 | 21 | |
| Median | 19 | 16.5 | 14 | |
| Minimum | 3 | 1 | 9 | |
| Analysis | P value | 0.001 | 0.035 | 0.001 |
Figure 1.
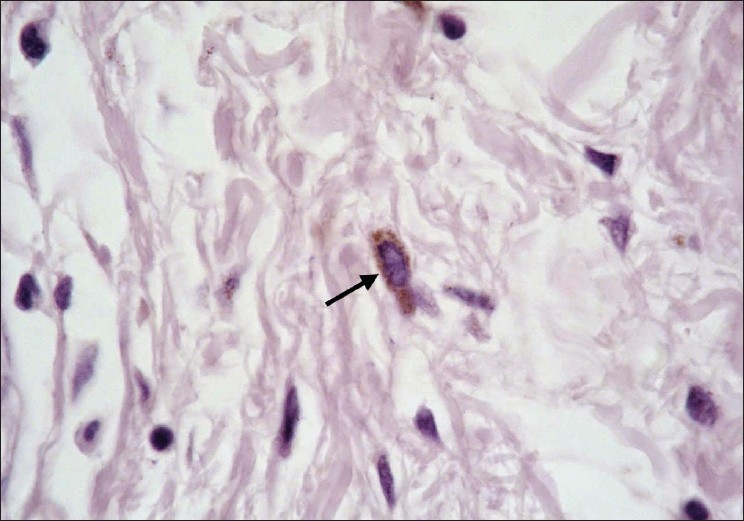
Skin tag in a non diabetic participant showing a brown stained mast cell (arrow) (Bismarck brown, ×1000)
Figure 2.
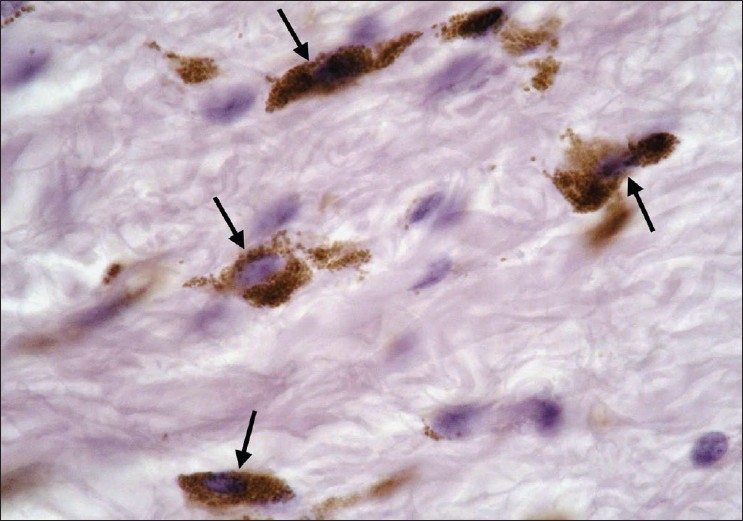
Skin tag in a diabetic participant showing a brown stained mast cell (arrow) (Bismarck brown, ×1000)
Comparison between the percentage of collagen mean area in skin tag lesions and control normal skin in both studied groups
The percentage of collagen mean area in large ST of diabetic group was statistically higher than the nondiabetic group P value = 0.002 (P < 0.05). Although the percentage of collagen mean area in small ST of diabetic group was higher than the nondiabetic group yet, it was non significant P value = 0.214 (P > 0.05).The percentage of collagen mean area in control normal skin of diabetic group was statistically higher than the nondiabetic group P value = 0.001 (P < 0.05) [Table 2] [Figures 3 and 4].
Table 2.
Comparison between percentage of collagen mean area in skin tag lesions and control normal skin in both studied groups
| Study population | Large ST | Small ST | Normal skin | |
|---|---|---|---|---|
| No. of cases | 14 | 14 | 12 | |
| Group I | Mean | 20.33 | 25.16 | 16.59 |
| (Non DM) | SD | 10.63 | 13.95 | 7.29 |
| Maximum | 48.56 | 46.97 | 37.12 | |
| Median | 16.05 | 16.38 | 14.54 | |
| Minimum | 10.23 | 10.23 | 10.23 | |
| No. of cases | 14 | 14 | 15 | |
| Group II | Mean | 38.97 | 36.6 | 31.2 |
| SD | 14.66 | 18.29 | 8.66 | |
| Maximum | 68.62 | 73.86 | 45.56 | |
| Median | 38.72 | 35.39 | 31.63 | |
| Minimum | 13.47 | 12.6 | 16.05 | |
| Analysis | P value | 0.002 | 0.214 | 0.001 |
Figure 3.
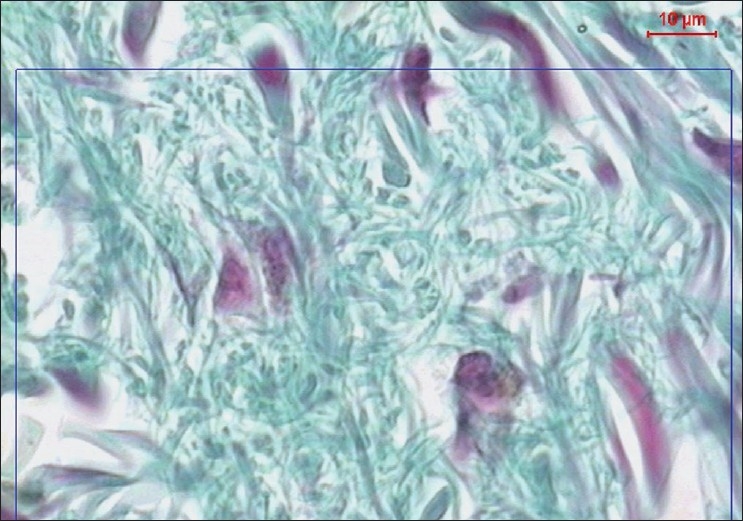
A copy of display on the monitor's screen of the image analyzer in non diabetic participant showing collagen fibres in green color (Masson's trichrom, ×400)
Figure 4.
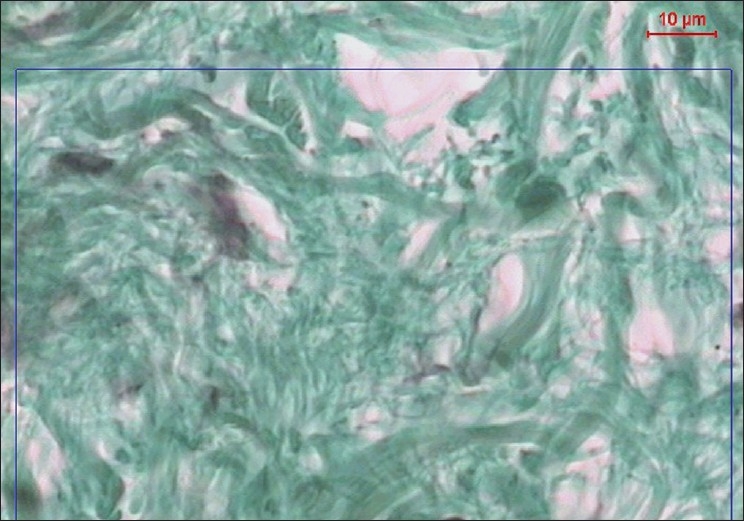
A copy of display on the monitor's screen of the image analyzer in diabetic participant showing collagen fibres in green color (Masson's trichrom, ×400)
Correlation between mast cell count and percentage of collagen mean area in both groups
In the nondiabetic group
There was statistically significant correlation between mast cell count and percentage of collagen mean area in small tags and control normal skin P values = 0.001 and 0.012, respectively (P < 0.05), while in large tags, there was no statistically significant correlation between mast cell count and the percentage of collagen mean area P value = 0.052 (P > 0.05) [Table 3].
Table 3.
Correlation between mast cell count and percentage of collagen mean area in the nondiabetic group
| Mast cell-large tag | Mast cell-small tag | Mast cell-control | ||
|---|---|---|---|---|
| Collagen mean area%-large tag | Correlation coefficient | 0.550 | 0.096 | 0.306 |
| Sig (2- tailed) | 0.052 | 0.767 | 0.309 | |
| N | 13 | 12 | 13 | |
| Collagen mean area%-small tag | Correlation coefficient | −0.045 | 0.926 | 0.091 |
| Sig (2- tailed) | 0.880 | 0.001 | 0.758 | |
| N | 15 | 13 | 14 | |
| Collagen mean area%-Control | Correlation coefficient | 0.332 | −0.023 | 0.694 |
| Sig (2- tailed) | 0.292 | 0.946 | 0.012 | |
| N | 12 | 11 | 12 |
Sig (2– tailed) = P value
In the diabetic group
There was statistically significant correlation between mast cell count and the percentage of collagen mean area in large tags, small tags, and control normal skin P values = 0.001, 0.001, and 0.001, respectively (P < 0.05) [Table 4].
Table 4.
Correlation between mast cell count and percentage of collagen mean area in the diabetic group
| Mast cell-large tag | Mast cell-small tag | Mast cell-control | ||
|---|---|---|---|---|
| Collagen mean area%-large tag | Correlation coefficient | 0.830 | 0.140 | 0.056 |
| Sig (2- tailed) | 0.001 | 0.647 | 0.850 | |
| N | 14 | 13 | 14 | |
| Collagen mean area%-small tag | Correlation coefficient | −0.040 | 0.893 | 0.190 |
| Sig (2- tailed) | 0.897 | 0.001 | 0.515 | |
| N | 13 | 13 | 14 | |
| Collagen mean area%-Control | Correlation coefficient | −0.040 | 0.194 | 0.796 |
| Sig (2- tailed) | 0.893 | 0.505 | 0.001 | |
| N | 14 | 14 | 15 |
Sig (2– tailed) = P value
Discussion
Zaher et al.,[13] reported a significant increase in mast cell count in skin tags in comparison to normal skin in both diabetic and nondiabetic participants. In this study, mast cell count was higher in diabetic than nondiabetic participants. It should be noted that mast cell count differs by using different stains. In 1987, Marshall et al.,[16] noticed that more mast cells were visualized with alcian blue / safranin than toluidine blue in human dermis. Also in 2000, Florenzano and Bentivoglio[17] reported that Pinacyanol, alone or with erythrosine, stained is more sensitive than toluidine blue (in rat thalamus).
Generally, mast cells participate in the pathogenesis of fibrotic diseases, they are found to stimulate fibroblast proliferation and collagen synthesis through some fibrotic mediators such as histamine and tryptase.[18] Mast cells are intimately associated with fibroblasts in tissues. Reciprocally, fibroblasts maintain mast cells in vivo. After co-culture with fibroblasts, immature mast cells changed to mature mast cells capable of synthesizing heparin and proteoglycans as well as changing their phenotype to resemble connective tissue type mast cells.[19] A study of the effect of human mast cells on fibroblast activity using an organotypic skin- equivalent culture system (mast cells in a collagen gel with neonatal dermal fibroblasts) revealed that there was increased synthesis of type a1(I) pro-collagen mRNA in presence of mast cells especially if degranulated. Mast cell tryptase stimulated fibroblast chemotaxis and also stimulated collagen messenger ribonucleic acid mRNA synthesis.[20] Clinically, Jones et al.,[21] found that there were an increased number of mast cells in diabetic nephropathy associated with renal fibrosis.
The correlation between mast cell count and percentage of collagen mean area in our study was statistically significant in both studied groups, except in large lesions of the nondiabetic group, but it was nearly significant. To our knowledge, no other studies demonstrated the correlation between mast cell count and percentage of collagen mean area in skin tags. However in 2006, Facoetti et al.,[22] used similar methodology in cardiologic research, their work was on rat cardiac muscle mast cells. Mast cell count was done and percent area of interstitial collagen deposits in 10 random fields was determined by the Image analyzer. Their data demonstrated a close relationship between rat cardiac muscle mast cell activation and collagen deposition.
Finally, we conclude that mast cells may play a critical role in the pathogenesis of skin tags through interaction with fibroblasts by increasing the collagen area.
Footnotes
Source of Support: Nil
Conflict of Interest: Nil.
References
- 1.Chiritescu E, Maloney ME. Acrochordons as a presenting sign of nevoid basal cell carcinoma syndrome. J Am Acad Dermatol. 2001;44:789–94. doi: 10.1067/mjd.2001.112399. [DOI] [PubMed] [Google Scholar]
- 2.Almeida SC, Perez PM, Sánchez AT. Giant skin tags: Report of two cases. Dermatol Online J. 2007;13:30. [PubMed] [Google Scholar]
- 3.Kahana M, Grossman E, Feinstein A, Cohen M, Ronnen M, Millet MS. Skin tags: A cutaneous marker for diabetes mellitus. Acta Dermatol Venereol. 1987;67:175–7. [PubMed] [Google Scholar]
- 4.Garcia-Hidalgo L, Orozco-Tropete R, Villa AR, Dalman JJ. Dermatoses in 156 obese adults. Obes Res. 1999;7:299–302. doi: 10.1002/j.1550-8528.1999.tb00410.x. [DOI] [PubMed] [Google Scholar]
- 5.Ben-Shlomo A, Melmed S. Skin manifestations in acromegaly. Clin Dermatol. 2006;24:256–9. doi: 10.1016/j.clindermatol.2006.04.011. [DOI] [PubMed] [Google Scholar]
- 6.Singh B, Mortensen NJ, Jewell DP, George B. Perianal Crohn's disease. Br J Surg. 2004;91:801–14. doi: 10.1002/bjs.4613. [DOI] [PubMed] [Google Scholar]
- 7.Turner ML. Skin changes after forty. Am Fam Physician. 1984;29:173–81. [PubMed] [Google Scholar]
- 8.Muram D. Anal and perianal abnormalities in prepubertal victims of sexual abuse. Am J Obstet Gynecol. 1989;161:278–81. doi: 10.1016/0002-9378(89)90498-5. [DOI] [PubMed] [Google Scholar]
- 9.Euvrard S, Kanitakis J, Cochat P, Claudy A. Skin diseases in children with organ transplans. J Am Acad Dermatol. 2001;44:932–9. doi: 10.1067/mjd.2001.113465. [DOI] [PubMed] [Google Scholar]
- 10.Leavitt J, Klein I, Kendricks F. Skin tags: A cutaneous marker for colonic polyps. Ann Intern Med. 1983;98:928–30. doi: 10.7326/0003-4819-98-6-928. [DOI] [PubMed] [Google Scholar]
- 11.Errickson CV. Matus NR Skin disorders of pregnancy. Am Fam Physician. 1994;49:605–10. [PubMed] [Google Scholar]
- 12.Dianzani C, Calvieri S, Pierangeli A, Imperi M, Bucci M, Degener AM. The detection of human papilloma virus DNA in skin tags. Br J Dermatol. 1998;138:649–51. doi: 10.1046/j.1365-2133.1998.02178.x. [DOI] [PubMed] [Google Scholar]
- 13.Zaher H, El Safoury OS, El Komy MM, Mahmoud SB, Abd El Hamid H. Study of mast cell count in skin tags. Indian J Dermatol. 2007;52:184–7. [Google Scholar]
- 14.Disbrey BD, Rack JH. Histological Laboratory Methods. London: Livingston Edinburgh; 1970. Bismarck brown for mast cells; pp. 194–5. [Google Scholar]
- 15.Culling CF. Handbook of histopathological and histochemical techniques. 3rd ed. London and Boston: Butterworths and Co. Ltd; 1975. p. 414. [Google Scholar]
- 16.Marshall JS, Ford GP, Bell EB. Formalin sensitivity and differential staining of mast cells in human dermis. Br J Dermatol. 1987;117:29–36. doi: 10.1111/j.1365-2133.1987.tb04087.x. [DOI] [PubMed] [Google Scholar]
- 17.Florenzano F, Bentivoglio M. Degranulation, density and distribution of mast cells in the rat thalamus: A light and electron microscopic study in basal conditions and after intra-cerebroventricular administration of nerve growth factor. J Comp Neurol. 2000;424:651–69. [PubMed] [Google Scholar]
- 18.Williams L, Wilkins Allergic inflammation and fibrosis: The role of mast cells and eosinophils. Curr Opin Allergy Clin Immunol. 2003;3:389–93. [Google Scholar]
- 19.Rothenberg ME, Austen KF. Influence of the fibroblast environment on the structure of mast cell proteoglycans. Ann N Y Acad Sci. 1989;556:233–44. doi: 10.1111/j.1749-6632.1989.tb22506.x. [DOI] [PubMed] [Google Scholar]
- 20.Gruber BL, Kew RR, Jelaska A, Ren S, Marchese MJ, Garlic J, et al. Human mast cells activate fibroblasts: Tryptase is a fibrogenic factor stimulating collagen ribonucleic acid synthesis and fibroblast chemotaxis. J Immunol. 1997;158:2310–7. [PubMed] [Google Scholar]
- 21.Jones R, Gilbert D. Tranilast reduces mesenteric vascular collagen deposition and chymase-positive mast cells in experimental diabetes. J Diabetes Compl. 2004;18:309–15. doi: 10.1016/j.jdiacomp.2004.02.002. [DOI] [PubMed] [Google Scholar]
- 22.Facoetti A, Fallarini S, Miserere S, Bertolotti A, Ferrero I, Tozzi R, et al. Histochemical study of cardiac mast cells degranulation and collagen deposition: Interaction with the catecolaminergic system in the rat. Eur J Histochem. 2006;50:133–40. [PubMed] [Google Scholar]