

Abstract
We investigated the saccade decision process by examining activity recorded in the frontal eye field (FEF) of monkeys performing 2 separate visual search experiments in which there were errors in saccade target choice. In the first experiment, the difficulty of a singleton search task was manipulated by varying the similarity between the target and distractors; errors were made more often when the distractors were similar to the target. On catch trials in which the target was absent the monkeys occasionally made false alarm errors by shifting gaze to one of the distractors. The second experiment was a popout color visual search task in which the target and distractor colors switched unpredictably across trials. Errors occurred most frequently on the first trial after the switch and less often on subsequent trials. In both experiments, FEF neurons selected the saccade goal on error trials, not the singleton target of the search array. Although saccades were made to the same stimulus locations, presaccadic activation and the magnitude of selection differed across trial conditions. The variation in presaccadic selective activity was accounted for by the variation in saccade probability across the stimulus–response conditions, but not by variations in saccade metrics. These results suggest that FEF serves as a saccade probability map derived from the combination of bottom-up and top-down influences. Peaks on this map represent the behavioral relevance of each item in the visual field rather than just reflecting saccade preparation. This map in FEF may correspond to the theoretical salience map of many models of attention and saccade target selection.
INTRODUCTION
The frontal eye field (FEF) plays a central role in saccade target selection during visual search (Bichot and Schall 1999b, 2002; Bichot et al. 2001a,b; Murthy et al. 2001; Sato and Schall 2003; Sato et al. 2001, 2003; Schall and Hanes 1993; Schall et al. 1995, 2004; Thompson et al. 1996). The consistent finding across all of these studies is that after the presentation of a visual search array, but before gaze shifts, a selection process takes place by which most visually responsive neurons in FEF signal the location of the singleton target stimulus. Missing from these reports, however, is information about what happens on error trials, on those trials in which one of the distractors is chosen as the saccade goal.
Models of visual attention and saccade target selection posit that peaks of activity across a hypothetical visual salience map in the brain encode stimulus conspicuity with the highest peak winning out to guide attention and gaze shifts (e.g., Findlay and Walker 1999; Itti and Koch 2001). However, the term “visual salience map” is somewhat misleading because during active vision, the physical salience of objects is only partly responsible for attracting gaze. The viewer’s knowledge contributes greatly to what attracts attention. For example, knowing the color of the object one is looking for makes all objects of that color stand out and therefore more likely to attract gaze (e.g., Bichot and Schall 1999a; Motter and Belky 1998). Normally, visual attention and gaze are guided by the combination of bottom-up intrinsic visual salience and by the top-down knowledge and expectations of the viewer (Yarbus 1967). Therefore in this report, the term “salience” is used to describe visual conspicuousness derived from both bottom-up and top-down influences.
Evidence is growing that, at least on correctly performed visual search trials, activity across the FEF reflects the combination of bottom-up and top-down influences and functions as a salience map for guiding saccades (reviewed in Thompson et al. 2001). According to the salience map hypothesis, activity on error trials should specify the next saccade and the magnitudes of activation representing the search stimuli should reflect the relative importance of each stimulus within the context of the task and predict the likelihood of making the saccade choice (Wolfe 1994). Alternatively, it is possible that FEF does not identify the goal of every saccade; instead FEF activity might identify the most physically salient object of the search array on both correct trials and error trials. Evidence for this possibility comes from previous work showing that FEF neurons select the singleton stimulus of a popout search array even when saccades are not made (Thompson et al. 1997). Further evidence comes from a study showing that FEF activity accurately tracks the jump of a singleton target in a double-step search task even when the saccade was not made to the singleton target but instead made to the distractor at the previous target location (Murthy et al. 2001). At the other extreme is the possibility that because the saccades are the same, the presaccadic activity will be the same on both correct and error trials and therefore not encode the salience of the stimulus. Evidence for this possibility comes from saccade countermanding studies that show that saccade-related activity in FEF rises to a specific and constant threshold on both correct and error trials before saccade initiation (Hanes and Schall 1996; Hanes et al. 1998).
To distinguish between these possibilities, we analyzed neuronal data collected from monkeys performing 2 different visual search tasks in which there were enough saccade choice errors to reliably evaluate the activation on error trials. The first task was an easy–hard search task in which the stimulus features were varied randomly from trial to trial. Easy search trials in which the singleton target was easily distinguished from the distractors were interleaved with hard search trials in which the singleton target was similar to the distractors. On hard search trials the monkeys made a significant number of erroneous saccades to one of the distractors. No target trials, in which monkeys were rewarded for maintaining fixation, were included with some of the recordings that resulted in some false alarm errors. Also, during the recordings that included no target trials, the monkeys occasionally maintained fixation when a target was present. The second task condition was a popout color search task in which the target and distractor features switched over trials. Unlike the bottom-up derived errors in the easy–hard task, in this task condition the errors are attributed to a top-down influence. In the feature-switching task the subjects become primed to make saccades to the stimulus with a specific feature, which leads to a higher percentage of errors on the first few trials after the switch (Maljkovic and Nakayama 1994).
Results were similar for both tasks and support the hypothesis that activity across FEF forms a salience map, a topographic representation of saccade probability. The selective activation was highest for the location that encoded the saccade goal, but the magnitude of selection before the saccade reflected the probability of choosing that item as the saccade goal. Some of these data previously appeared in abstract form (Thompson et al. 2002).
METHODS
Subjects and surgery
Data were collected from 4 macaque monkeys (F, M, L, O), Macaca mulatta and Macaca radiata, weighing 4–10 kg. The animals were cared for in accordance with the National Institutes of Health Guide for the Care and Use of Laboratory Animals and the guidelines of the Vanderbilt Animal Care Committee. The surgical procedures were described previously (Schall et al. 1995).
Behavioral procedure
Using operant conditioning with positive reinforcement, all of the monkeys were trained to perform a singleton visual search task in which reward was contingent on shifting gaze to an oddball target. After fixation of a central spot for about 600 ms, the target was presented at one of 4 or 8 iso-eccentric locations equally spaced around the fixation spot. The remaining locations were occupied by the distractors. During the physiological recordings the stimuli were placed so that at least one stimulus always fell within the response field of the neuron. The monkeys were rewarded for making a saccade to the target within 500 ms after the search array was presented and fixating the target for 400 or 500 ms. If the monkey broke fixation before stimulus presentation, made a saccade to a location other than the target, made a saccade to the target but failed to fixate it for the prescribed period, or did not initiate a saccade within the prescribed period, the trial was immediately aborted, and the monkeys failed to receive the juice reward. This undermined an analysis of subsequent saccades but encouraged monkeys to find the target on the first saccade. On average monkeys ran about 800 search trials while recordings were made from each neuron. Two different variations of this basic search task were used to manipulate the monkeys’ performance accuracy: easy–hard search and popout search with feature switching.
EASY–HARD SEARCH TASK
In the easy–hard visual search task the singleton target was presented with 7 distractors that were either different from or similar to the target. Target–distractor similarity was adjusted so that the mean reaction time was ≥30 ms longer in the hard search condition. The easy and hard search trials were randomly interleaved and on each trial the target appeared randomly at one of the 8 possible locations. The target and distractors were distinguished by either color or direction of motion (Fig. 1, A and B).
FIG. 1.
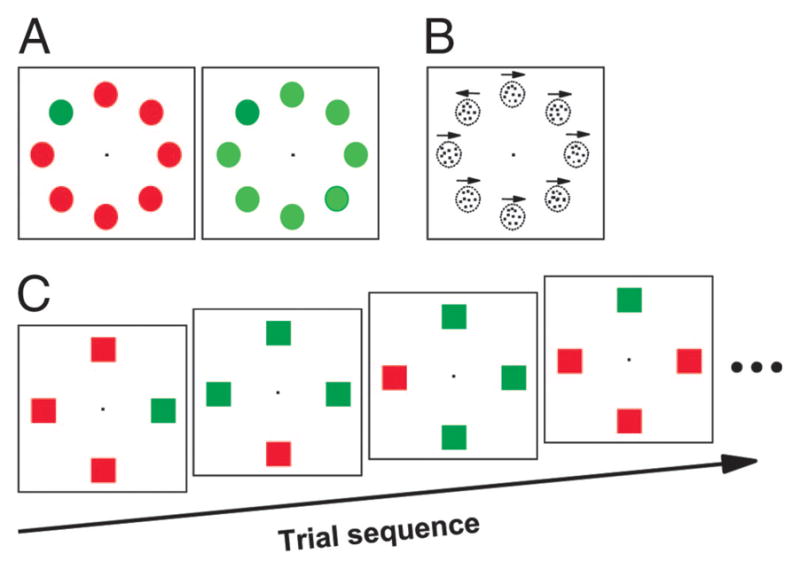
Visual search displays. Each trial began with the presentation of a fixation spot. After fixation for a variable interval a search array appeared. A: easy–hard color search. Stimuli were equiluminant, and the target–distractor similarity was manipulated by changing the color of the distractors. B: easy–hard motion search. Each stimulus was a circular aperture of randomly positioned dots. Direction of motion was either left or right. Motion of the target was opposite that of the distractors. Target–distractor similarity was manipulated by changing the proportion of dots moving coherently in all apertures. C: feature-switching task. Example sequence of 4 trials is shown. Monkeys’ task was to shift gaze to the popout oddball stimulus.
Data were collected from 2 monkeys (F and M) performing the color easy–hard search experiment. Stimuli were 1° squares (monkey F) or circles (monkey M) presented at 10° eccentricity; a few neurons had more eccentric response field and in those cases the stimuli were 1.5° squares at 15° eccentricity. The target was always green and the distractors were red on easy search trials and yellow-green on hard search trials (Fig. 1A) (e.g., D’Zmura 1991; Nagy and Sanchez 1990). For monkey F, the green was CIE (International Commission on Illumination) x = 283, y = 612, red was CIE x = 655, y = 327, and yellow-green was CIE x = 363, y = 552, all having luminance of 11.1 cd/m2. For monkey M, the green was CIE x = 281, y = 609, red was CIE x = 632, y = 338, and yellow-green was CIE x = 375, y = 538 with a luminance of 13.4 cd/m2.
Data were collected from 3 monkeys (L, M, and O) during the easy–hard motion search experiment. For motion search, each stimulus was a circular aperture of randomly positioned dots, a proportion of which translated coherently in a specified direction, whereas the remaining dots were replotted at random locations every 3 video frames (Fig. 1B). The apertures were 2.5° across and were presented at 10° eccentricity. This eccentricity allowed for at least one stimulus location to be inside the neuron’s response field. The stochastic motion stimulus corresponds to that used in earlier studies (e.g., Britten et al. 1992) and was described previously (Sato et al. 2001, 2003). The direction of motion was either left or right, and the direction of motion of the target and distractors remained the same during each recording session and varied pseudorandomly across sessions. On easy motion search trials all of the dots in a given aperture moved in the same direction. On hard motion search trials 40–50% of the dots in each aperture moved in random directions.
The easy–hard color and motion visual search experiments with monkeys L, M, and O included 30–45% randomly interleaved catch trials, in which only distractors were presented (Sato et al. 2003). On these catch trials, the monkeys had to maintain fixation on the central spot for 1,500 ms to obtain the reward. For both color and motion search, there were 2 different sets of distractors used for the catch trials; one set (red or high motion coherence) was associated with easy search and the other set (yellow-green or low motion coherence) was associated with hard search.
POPOUT SEARCH WITH FEATURE-SWITCHING TASK
Data were collected from 2 monkeys (C and F) performing the popout search task with feature switching. In this experiment, the monkeys were rewarded for making a single saccade to a target among 3 distractors that differed from it in color (i.e., red target among green distractors or green target among red distractors) (Fig. 1C). The color of the target and distractors switched across trials with a probability of 50 or 33%, or in blocks of 10 trials; the 3 different switch probabilities were pseudorandomly intermixed within each recording session. An example sequence of popout search trials is shown in Fig. 1C. The 2nd trial in this sequence represents the 1st trial after a feature switch, and the next trial represents the 2nd trial after the feature switch; the last trial of the sequence represents another 1st trial after a feature switch.
MEMORY-GUIDED SACCADE TASK
Monkeys were also trained on the memory-guided saccade task (Bruce and Goldberg 1985; Hikosaka and Wurtz 1983). This task served 2 purposes: to distinguish visual from movement activity for cell classification, and to map the spatial extent of each neuron’s response field. In this task, the target was flashed alone for 80 ms, but the monkeys were required to maintain fixation on the central spot for another interval of random duration ranging from 400 to 1,000 ms. When the fixation spot disappeared, the monkeys were rewarded for making a saccade to the remembered location of the target. Once gaze shifted, the target reappeared to provide feedback and a fixation target for the monkeys. Neurons were classified as those exhibiting only visual responses (visual neurons), those exhibiting only movement related responses (movement neurons), and those exhibiting both visual and movement related responses (visuomovement neurons).
Data collection and analysis
Single units were recorded with insulated tungsten electrodes (FHC). The electrodes were introduced through guide tubes positioned in a 1-mm-spaced grid (Crist et al. 1988) and were positioned with a hydraulic drive (FHC). Action potentials were amplified, filtered, and discriminated using either an analog time–amplitude window discriminator (BAK) or computer-based window discriminator (Plexon). FEF recordings were done in the rostral bank of the arcuate sulcus, which was confirmed with magnetic resonance imaging or histology.
We used a method adapted from signal detection theory (Green and Swets 1966) to determine the time course of discrimination and to what degree the activity of each neuron discriminated the saccade goal on correct trials and on error trials. This method was previously described (Thompson et al. 1996).
First we identified the stimulus locations that were clearly inside and outside of the neuron’s response field during the memory-guided saccade task. Often 2 or 3 of the stimulus locations were determined to be inside (or outside) the response field because the responses on correct trials were indistinguishable when the target was presented at those locations. Trials involving locations at the edge of a response field that produced weak responses to a target were excluded from all analyses. During the visual search task, the monkeys did not exhibit tendencies to preferentially make incorrect saccades to any of the stimulus locations so there was no evidence of saccade preference biases that could have potentially affected the results.
We generated a spike density function for each trial by convolving action potentials with a Gaussian filter (σ = 10 ms). For the analysis of neural activity on correct trials, we compared the distributions of discharge rates when the saccade was made to the target in the response field to the distributions of discharge rates during trials when only distractors were in the response field and the saccade was made to the target outside the response field. For the analysis of error trials we compared the distributions of discharges rates when the saccade was to a distractor in the response field and the singleton target was outside the response field to the distributions of discharge rates when the saccade was to a distractor outside the response field and the singleton target was inside the response field. The comparison was made at 1-ms intervals starting at the time of search array presentation for each neuron. The separation of the 2 distributions of activity at each time interval was quantified by calculating receiver operating characteristics (ROC) curves (Thompson et al. 1996). Points on the ROC curve were generated by plotting the fraction of trials of one distribution with discharge rates greater than a criterion as a function of the fraction of trials of the other distribution with discharge rates greater than the same criterion. The entire ROC curve was generated by incrementing the criterion from zero to the maximum discharge rate observed on a single trial in steps of 1 spike/s. The area under the ROC curve represents measures of the separation of the 2 distributions of activity. An area under the ROC curve value of 0.5 signifies that the 2 distributions being compared are completely indistinguishable, whereas a minimum value of 0.0 or a maximum value of 1.0 signifies that the 2 distributions do not overlap at all. As a convention, ROC area values >0.5 indicated that the activation on the trials when the saccade was into the response field was greater than the activation on the trials when the saccade was to a location outside the response field. For correct trials, the saccade goal was the same as target location; however, on error trials, the saccade goal was not the same as the target location. For clarity we use the term “target” when referring to the singleton target of the search array and “saccade goal” when referring to the stimulus to which the monkeys shifted gaze.
The time course of the discrimination process was quantified by plotting the area under the ROC curve as a function of time. The time course of the selection process after the presentation of the search array is most evident when the data are aligned on the time of search array presentation. The magnitude of selection reached before saccade initiation is best measured when the data are aligned on the time of saccade initiation. To determine how well neurons discriminated the saccade goal before saccade initiation, we averaged the ROC area over the last 30 ms before saccade initiation. The 30-ms time duration was arbitrary; however, when other durations were used, the results did not differ qualitatively. Potential changes in baseline neuronal discrimination were investigated by calculating the average ROC area for the first 30 ms after search array presentation. This duration probed neural activity biases that may have been present immediately before the initial visual responses to the search array. The nonparametric Kruskal–Wallis test was used to identify significant variation in the average ROC area across trial conditions.
RESULTS
Easy–hard visual search
MISLOCALIZED TARGET ERRORS
Easy search trials were randomly interleaved with hard search trials (Fig. 1, A and B). Neural activity on correct trials recorded with this task was previously examined (Bichot et al. 2001; Sato et al. 2001). Data were collected with 3 variations of the easy–hard search task: color search without target absent trials, color search with target absent trials, and motion search with target absent trials (see METHODS). In this section we will compare the activity on target-present trials in which the monkey incorrectly shifted gaze to one of the distractors to the activity on correct trials.
The monkey’s behavioral performance during the easy–hard search task revealed the difference in task difficulty on easy and hard trials. During easy search the target was very different from the distractors (e.g., a green target among red distractors) and the monkeys correctly performed the task on 95.4% of trials. During hard search the target was similar to the distractors (e.g., a green target among yellow-green distractors) and the monkeys correctly performed the task on only 76.1% of trials. The relative difficulty was also evident in the saccadic reaction times (Fig. 2). On correct trials, the average reaction time for easy search was 200.3 ms and for hard search was 264.0 ms. On error trials in which the monkey made a saccade to one of the distractor stimuli, the average reaction time was 215.2 ms for easy search and 251.8 ms for hard search.
FIG. 2.

Cumulative distributions of saccadic reaction times during the easy–hard visual search task. Probability of a saccade occurring is plotted as a function of time from search array presentation. All color and motion search trials that included a target are combined. Easy and hard correct trials are those trials in which the saccade was made to the singleton target (shown in red and green, respectively). Easy and hard error trials are those trials in which the saccade was made to one of the distractors (shown in orange and blue, respectively).
A total of 245 FEF neurons were recorded from 4 monkeys while they performed the easy–hard visual search tasks. To be included in any of the analyses in this study a neuron had to exhibit significant selective activity on correct trials and have ≥5 trials for each of the 2 error conditions to be compared. For this analysis, the first error condition was when the target fell in the neuron’s response field and the saccade was made to a distractor outside the neuron’s response field, and the second error condition was when the target fell outside the neuron’s response field and the saccade was made to a distractor in the neuron’s response field. For hard search, enough data were collected from 102 neurons. There were too few errors on easy search trials to analyze for any of the neurons. The results obtained from the individual monkeys, from data collected with the color or motion search, and from data collected during recording sessions that included or did not include target absent trials were not different, and therefore the results are combined.
The activity of a visually responsive FEF neuron on easy correct trials, hard correct trials, and hard error trials is shown in Fig. 3 aligned on the time of search array presentation (Fig. 3A) and on the time of saccade initiation (Fig. 3B). This neuron exhibited the typical target-selection response on correct trials that was reported previously for FEF neurons (Bichot et al. 2001b; Sato et al. 2001; Schall et al. 1995; Thompson et al. 1996). The initial visual response did not discriminate the target from distractors, but over time the activity evolved to indicate whether the target was in its response field. The time course and magnitude of this discrimination process were determined using an ROC analysis (Thompson et al. 1996). The area under the ROC curve estimates the probability of an ideal observer to correctly choose to which of 2 distributions a sample belongs. It is also a convenient nonparametric method of obtaining a measure of the difference between 2 distributions normalized to values between 0 and 1, with 0.5 indicating completely overlapping distributions. Initially after the search array presentation but before the initial visual response of the neuron (0–50 ms), ROC areas were about 0.5, which indicates equivalent baseline activity. During the initial visual response beginning at about 50 ms the ROC areas remained at 0.5, which reflects the inability of the initial visual response to distinguish the target from distractors. At about 100 ms after search array presentation the ROC area begins to grow and it eventually reaches an asymptotic level before saccade initiation. This growth reflects the process by which the target of the search array is identified. The maximum level of the ROC area before saccade initiation is a measurement of how well the neuron was able to distinguish the target from the distractors. There are 2 main differences in the discrimination process between easy and hard correct trials. First, after search array presentation the discrimination process emerged earlier on easy trials than on hard trials. Second, the reliability of selection before saccade initiation, as indexed by the presaccadic ROC area, reached a higher level before saccade initiation during easy search than during hard search. Both of these findings were previously reported (Bichot et al. 2001b; Sato et al. 2001).
FIG. 3.

Saccade target discrimination by a visually responsive frontal eye field (FEF) neuron recorded during the easy–hard color search task. Activity on easy correct, hard correct, and hard error trials is shown in separate columns. A: average neural activity and receiver operating characteristics (ROC) area aligned on the time of search array presentation. Top panels: plots of the average firing rate when the singleton target was presented in the response field (solid line) and when only distractors were presented in the response field (dotted line) for easy correct trials (left), hard correct trials (middle), and hard error trials (right). For hard error trials (right), the plot compares the activity on trials in which the monkey made a saccade to a distractor in the response field (dotted line) to trials in which the singleton target was presented in the response field and the monkey made saccade to a distractor outside the response field (solid line). Bottom panels: plots of ROC area as a function of time for each trial condition. Only presaccadic activity was used in the analysis and each plot ends at the mean reaction time. B: neural activity and ROC area from the same trials aligned on the time of saccade initiation.
Figure 3 also shows the average activity of the same neuron on error trials during hard search. On error trials, saccades were made to one of the distractor stimuli. The error activity shown in the right column of Fig. 3 compares the activity on trials when a saccade was made to a distractor in the neuron’s response field to the activity on trials when the singleton target was in the response field and the saccade was made to a distractor outside the response field. The conventions of the ROC analysis were such that ROC areas >0.5 indicate selection of the saccade goal, not selection of the singleton target of the search array. Alternatively, ROC areas <0.5 indicate selection of the singleton target, not selection of the saccade goal. In this neuron, as in nearly all neurons in our sample, before saccade initiation the selective activity identified the location of the saccade goal, not the singleton target of the search array. The particular neuron shown in Fig. 3 also exhibited for a brief time, from 50 to 100 ms after stimulus presentation, greater activation for the singleton target, which suggests that there may have been an initial selection of the singleton stimulus before the selection of the saccade goal (see Sato and Schall 2003). However, this pattern was not observed in the other neurons in our sample (see pooled average in Fig. 5); thus overall there was not an initial selection for the singleton target of the search array on error trials.
FIG. 5.

Pooled average of FEF activity and ROC area in the easy–hard visual search task for easy correct, hard correct, and hard error trials. Average responses pooled from 102 neurons are shown. Trial types are differentiated by color (red: easy corrects; green: hard corrects; blue: hard errors). A: time course of FEF activity aligned on the time of search array presentation and plotted up to the mean saccade latency for each condition. B: average ROC areas plotted as a function of time aligned on the time of search array presentation (corresponds to the activity plotted in A). C: pooled FEF activity aligned on the time of saccade initiation. D: average ROC areas aligned on the time of saccade initiation (corresponds to the activity plotted in C).
Figure 4 shows the distributions of the baseline ROC areas (the average ROC area for the 30 ms after search array presentation), and the maximum ROC areas (the average ROC area for the 30 ms before saccade initiation) reached before saccade initiation by FEF neurons during hard search error trials. There was no evidence of a pretrial bias that could influence saccade choice. In the 30 ms immediately after the presentation of the search array, the neurons had not yet begun to respond to the search array stimuli. During this time the ROC areas on error trials did not differ from 0.5 [mean = 0.51; t-test, t(101) = 0.523, P = 0.6]. In the 30 ms before saccade initiation, nearly all of the neurons had ROC areas >0.5 [mean = 0.73; t(101) = 16.3, P < 0.001]. Therefore before saccade initiation, FEF neurons select the saccade goal, not the oddball of the search array. The same results were obtained when maximum ROC areas were measured from trials aligned on stimulus presentation and when postsaccadic spikes were excluded from the Gaussian smoothing of firing rate.
FIG. 4.

Distribution of ROC areas for the population of FEF neurons on hard error trials during the easy–hard search task. ROC area was calculated so that values <0.5 indicate selection for saccade direction and values >0.5 indicate selection for the location of the oddball stimulus. Top panel: distribution of the ROC area averaged over the 30 ms after search array presentation, which is before the neurons begin to respond to the presentation of the search array. Bottom panel: distribution of ROC areas in the 30 ms before saccade initiation.
The population average activity and ROC areas are shown in Fig. 5. We combined the activity of all neurons regardless of whether they were classified having visual, visuomovement, or movement-related activity (Bruce and Goldberg 1985). This was done because the results were indistinguishable across the different neuron types (see following text, Fig. 10). Aligning on the time of target presentation or the time of saccade initiation did not alter the results. However, the time course of the selection process after the presentation of the search array is most evident when the trials are aligned on the time of search array presentation (Fig. 5, A and B), and the presaccadic selection activity is most easily observed when the trials are aligned on the time of saccade initiation (Fig. 5, C and D). At the population level, selective activity emerged earliest on easy trials. The selection process on hard correct trials and hard error trials had a similar time course. Also, on error trials, neurons selected the saccade goal, not the singleton stimulus of the search array. However, the magnitudes of selection before saccade initiation across the 3 trial conditions were not equal. A Kruskal–Wallis test revealed that there was significant variation in ROC areas in the 30 ms before saccade initiation (P <0.001) across the 3 trial conditions. The magnitude of selection before saccade initiation was highest for easy correct trials, followed by hard correct trials, and lowest for hard error trials (Fig. 5, B and D). Lower ROC areas are a result of both lower activity representing the saccade goal and higher activity representing the nonsaccade stimulus (Fig. 5, A and C).
FIG. 10.

Activity of movement neurons. A: pooled activity of the 17 movement neurons included in B during the memory-guided saccade task aligned on stimulus presentation (left) and on saccade initiation (right). Thick line: the activity when the target and saccade was in the neurons’ movement field; thin line: the activity when the target and saccade was outside the neurons’ movement field. Movement neurons are defined as neurons that do not exhibit visual responses after stimulus presentation and exhibit an increase in activity before saccades into their movement field. B–C: pooled responses of FEF movement neurons during the easy–hard search task aligned on the time of saccade initiation and the corresponding ROC area plots. B: 17 movement neurons with enough hard error trials (a subset of the data shown in Fig. 5). C: 5 movement neurons with enough trials for all trial conditions that ended in a saccade (a subset of the data shown in Fig. 8A). Conventions are the same as in Figs. 5 and 8A.
FALSE ALARMS
Some easy–hard visual search recording sessions included catch trials (30–45% of trials); trials when the target was absent and only distractors were presented. On catch trials, one set of distractors was presented without a target and the monkey was rewarded for maintaining fixation on the central fixation spot for 1,500 ms. On the target-present trials monkeys were required to make a saccade within 500 ms after search array presentation. The stimuli presented on catch trials were either the distractors associated with easy trials, or the distractors associated with hard trials (heretofore referred to as easy catch and hard catch, respectively). On average the monkeys performed correctly on 82.1% of the easy catch trials and on 57.5% of the hard catch trials. The activity on correct catch trials was the subject of a previous report (Sato et al. 2003). False alarm errors are defined as those catch trials on which the monkey made a saccade to one of the stimuli before the 1,500-ms time limit expired. Figure 6B shows the cumulative reaction time distributions for the data collected with catch trials. The reaction times of easy false alarms averaged 297.3 ms, and hard false alarms averaged 318.0 ms. Approximately 10% of the false alarm trials had reaction times >500 ms and were outliers from the main part of the distribution. On target present trials, the monkeys were required to make a saccade within 500 ms. Therefore to make a fair comparison across all trial types, only those trials with reaction times <500 ms were included in the neural activity analysis.
FIG. 6.

A: visual search displays showing the possible stimulus response combinations when catch trials were included. Arrows indicate saccades and dotted circles represent maintained fixation on the central fixation spot. B: cumulative distributions of saccadic reaction times during the easy–hard visual search task sessions that included catch trials in which false alarms were made. Conventions are the same as in Fig. 3 with the addition that false alarms are included. An easy false alarm (magenta) is a trial in which only distractors associated with easy search are presented and the monkey made a saccade to one of them. A hard false alarm (cyan) is a trial in which only distractors associated with hard search are presented and the monkey made a saccade to one of them.
When catch trials were included with target-present trials, there were 10 possible stimulus–response combinations (Fig. 6A). A target-present trial could result in a correct saccade to the target, a mislocalized saccade to a distractor, or no saccade (a miss, see following text). A catch trial could result in no saccade (the correct response), or a saccade to a distractor (a false alarm). Each of these 5 types of trials could be associated with either the easy or the hard distractor. Sixty-two neurons were recorded when catch trials were included in the task. Thirty-one of these neurons had enough mislocalized saccade target-present trials during hard search and were included in the analysis that was presented in the previous section. There were enough easy and hard false alarm trials for 28 neurons; 21 of these neurons had enough hard mislocalized saccade trials to compare the activity on mislocalized saccade trials with the activity on easy and hard false alarm trials. The results of the analysis during color and motion search were not different so they were combined.
Figure 7 shows the pooled average activity on false alarm trials for the 28 neurons that met the trial number criteria for easy and hard false alarms. Also shown in Fig. 7A is the activity on correct catch trials (thin lines). The activity on correct hard catch trials was greater than the activity on correct easy catch trials after about 150 ms after stimulus presentation; this difference between correct easy and hard catch trials is attributed to the similarity of the distractors to monkeys’ memory of the target feature and was the subject of a previous report (Sato et al. 2003). The presaccadic activity on false alarms identified which distractor stimulus was the saccade goal. The distractor that was the saccade goal on false alarm trials evoked greater responses than identical distractors on correct catch trials. In addition, distractors that were not the saccade goal on false alarm trials evoked weaker responses than identical distractors on correct catch trials. The time course of the selection of the saccade goal on false alarm trials most closely matched the time course of selection process on the target-present trials that shared the same distractor feature; the saccade goal was selected earlier on easy false alarms than on hard false alarms (Fig. 7B). Before the saccade (Fig. 7, C and D), the level of discrimination was slightly higher on hard false alarms than on easy false alarms. Although the difference in the magnitude of presaccadic selection between the 2 false alarm trial groups did not reach statistical significance (Kruskal–Wallis, P = 0.18), there was significant variation in the magnitude of presaccadic selection across the 5 trial conditions that ended with a saccade (P = 0.002). In the next section we will relate the variation in the magnitude of presaccadic selection to the probability of making each saccade choice.
FIG. 7.

Activity on false alarms. A false alarm trial is defined as a trial in which no target was presented but the monkey behaved as if there was a singleton target by making a saccade to one of the distractor stimuli. Average responses pooled from the 28 neurons for which enough easy and hard false alarm trials were recorded are shown (magenta: easy false alarms; cyan: hard false alarms). Thick solid lines indicate the activity on trials in which the saccade was made to a stimulus in the response field and dotted lines indicate activity on trials in which the saccade was made to a stimulus outside of the response field. A: time course of FEF activity aligned on the time of search array presentation and plotted up to the mean saccade latency for each condition. Thin magenta and cyan lines plot the activity on correct easy and hard catch trials, respectively. B: average ROC area plotted as a function of time aligned on the time of search array presentation for each trial condition. C: pooled FEF activity aligned on the time of saccade initiation. D: average ROC area aligned on the time of saccade initiation.
RELATIONSHIP OF SELECTION MAGNITUDE TO PROBABILITY OF SACCADE CHOICE
In this study, the ROC area is a probabilistic measurement of the difference of activation at 2 separate retinotopic locations within the FEF, the location that represents the saccade goal and a location that represents a stimulus that was not the saccade goal. In reality, the monkeys had to discriminate which of 8 separate stimuli was the singleton target. As an analysis tool, we simplified the discrimination into a 2-alternative choice; the saccade goal was either inside the response field of the neuron or it was outside. A more detailed analysis that considers the actual number of possible choices was previously published (Bichot et al. 2001b). In the present analysis, the ROC area corresponds to the probability of an observer correctly assigning the activation on a single trial to the group of trials it belongs to when the decision rule is that higher values correspond to the location of the saccade goal and lower values correspond to one of the other stimulus locations. Our hypothesis is that the population activity across the retinotopic map within FEF represents the integration of bottom-up and top-down salience and the peak on this map guides the saccade in a probabilistic fashion. This hypothesis predicts that when 2 activity peaks are similar, there is a greater likelihood that because of variability, the usually lower activation will exceed the usually higher activation and will result in more errors. If this hypothesis is correct, then the ROC area reached before saccade initiation will be correlated with the probability of making a saccade to the location with the highest activation. As in previous studies using “antineuron” analysis techniques (e.g., Britten et al. 1992; Thompson et al. 1996), this analysis assumes that pooling multiple trials from single neurons estimates the population response on single trials. Our previous work has shown that this assumption is reasonable for these data (Bichot et al. 2001b).
The probability of the monkeys generating a saccade varied across the different stimulus–response conditions. There were enough trials to compare presaccadic activity for 21 neurons. All neurons were recorded in separate recording sessions. For these 21 recording sessions the monkeys, on average, made a correct saccade to the target on 94% of easy search trials and 75% of hard search trials. On 20% of hard search trials the monkeys made an incorrect saccade to one of the distractors. False alarm saccades were made on 19% of easy catch trials and on 43% of hard catch trials. These percentages varied somewhat across recording sessions and provided the behavioral measurement of saccade probability for each stimulus–response condition (see Fig. 8B).
FIG. 8.

Correlation of magnitude of presaccadic selection to probability of behavioral choice in the easy–hard search task. A: pooled activity plots (top) and ROC areas (bottom) for each of the trial conditions aligned on the time of saccade initiation. Average responses pooled from the 21 neurons for which enough trials were recorded in each condition are shown. Black bar in the ROC plot indicates the time range in which ROC area was averaged for the different trial types (from 30 to 0 ms before saccade initiation). Trial types are differentiated by color as in Figs. 5 and 7. B: ROC area averaged over the 30 ms before saccade initiation for each trial type is plotted as a function of the monkey’s probability of making that saccade choice. Data from each of the 21 recording session contributed 5 data points, one for each of the trial types (small circles, differentiated by color). Equation of the principal axis of the regression ellipse is shown. There is significant correlation (r = 0.44, P < 0.001). Large colored circles plot ROC area as a function of saccade probability averaged across all recording sessions for the 5 trial types.
The average activation and ROC areas aligned on saccade initiation for the 5 stimulus–response conditions are plotted in Fig. 8A. We performed a correlation analysis on ROC area averaged over the 30 ms before the saccade and the probability of making each type of saccade choice across the 5 stimulus–response conditions (Fig. 8B). Each neuron (n = 21) contributed 5 pairs of values to the analysis, saccade probability, and ROC area—one pair of values for each of the 5 stimulus–response conditions. There was a significant correlation (r = 0.44, P < 0.001).
However, it is possible that differences in saccade metrics between the different trial conditions contributed to the differences in neural activity and therefore to ROC area. To test for this possibility, we performed a multiple regression analysis, regressing ROC area against probability of saccade choice, average saccade peak velocity, average saccade amplitude, and average saccade latency. Because the eccentricity of the stimuli varied across sessions according to response field eccentricity, it was necessary to normalize the velocity, amplitude, and saccade latency measurements as a percentage of the mean values from each session. The result of the multiple regression analysis was that only saccade probability accounted significantly (P < 0.05) for the variation in ROC area [y-intercept = 0.76, slope = 0.15; F(1,103) = 24.9, P < 0.001].
The only behavioral measure that accounted for the variation in presaccadic ROC area was the monkeys’ probability of generating the behavior. We cannot know whether the relationship continues to be linear as the probability of saccade choice approaches zero. Nevertheless, the correlation does suggest that, when given the option of not making a saccade, the difference in activation between 2 similar activity peaks in FEF must reach some threshold before a saccade is made. An analysis of activity on trials in which a singleton target was present but a saccade was not made tests this hypothesis.
MISSES
Previous work has shown that when activity in FEF movement neurons reaches a threshold, a saccade is generated. When the growth of movement activity is suppressed before the threshold is met, no saccade is made (Hanes and Schall 1996, Hanes et al. 1998). Our data now suggest this may also be true for FEF activity related to deciding which object to look at. The hypothesis that a threshold of selection must be reached before an object is chosen as the saccade goal was examined by looking at the activity on miss trials. A miss was defined as those target-present trials on which the monkey maintained fixation for the entire time allowed (500 ms), at which time the visual stimulus was turned off and the trial was aborted. For easy search, misses occurred on just 0.2% of trials; there were not enough data to analyze easy search misses for any of the neurons. For hard search, misses occurred a little more frequently, on 3.7% of trials. There were enough data to analyze the activity on misses on hard search trials for 10 neurons. For the data collected from these 10 neurons the miss rate was 6.7%.
Figure 9 compares the pooled average activation for the trials associated with the hard search condition for the 10 neurons with enough trials to analyze in all 4 possible stimulus–response conditions: correct trials, mislocalized saccade trials, false alarms, and misses. On miss trials, there was a selective response that identified the location of the singleton stimulus. Because no saccade was made on miss trials, it is not possible to compare the magnitude of selection on miss trials to the values plotted in Fig. 8B. However, it is evident in Fig. 9 that on miss trials the magnitude of selection never reached the level that was reached for the trials that resulted in a saccade. Although the data are limited, this result supports the hypothesis that when given a choice to make a saccade or not in the presence of multiple competing stimuli, there is a selection threshold that must be reached in FEF before a saccade goal is identified and a saccade is made.
FIG. 9.

FEF activity on hard search misses. A miss trial is defined as a trial in which a target was presented but the monkey behaved as if it was a catch trial by maintaining fixation on the central spot for the entire trial. Pooled responses of the 10 FEF neurons for which enough miss trials were recorded are shown. Top: activity on misses that occurred on hard search trials (orange) is compared with the activity on hard correct, hard error, and hard false alarm trials. Solid orange line plots the activity on trials in which the singleton target was presented in the response field and the dotted orange line plots the activity on trials in which distractors were presented in the response field. Color conventions of the other trial conditions are the same as in Fig. 8ABottom: average ROC area as a function of time pooled across the same 10 neurons.
MOVEMENT NEURONS
The previous analyses combined the activity from all FEF neurons regardless of whether they exhibited presaccadic movement activity in the memory-guided saccade task. This was done because there was no evidence that the results from movement neurons and visual neurons differed. The neural activity and ROC plots in Fig. 10 illustrate this point. The plots in Fig. 10 show the pooled average activation obtained during the easy–hard search task from those neurons that exhibited only movement-related activation in the memory-guided saccade task. Figure 10A plots the pooled activity from the 17 movement neurons that were included in the mislocalized saccade analysis shown in Fig. 5. These movement neurons did not have a visual response during the memory-guided saccade task. However, the pattern of activity for the movement neurons during visual search was not distinguishable from the overall averages shown in Fig. 5, C and D. The results from the 5 movement neurons collected with catch trials and included false alarm data (Fig. 10B) were qualitatively the same as the overall population (Fig. 8A). Even with only 5 movement neurons in the sample, paired t-tests (with Bonferroni correction) showed significant differences (P < 0.05) in the presaccadic firing rates, but no differences in saccade amplitudes or velocities, between correct saccades and false alarm saccades made to the same stimulus location. Therefore contrary to previous studies showing a constant threshold of activation in FEF before saccades (e.g., Hanes and Schall 1996), the presaccadic movement activation in FEF was different across different stimulus–response combinations in this task, even though the saccades were not different.
Popout visual search with feature switching
In the 2nd experiment, 2 monkeys performed a popout color search task in which the stimulus colors that defined the target and distractors switched unpredictably. The target and distractors colors were easily distinguishable, red and green. On each trial, the monkey was rewarded for making a saccade to the singleton target. However, the target and distractor colors switched unpredictably every few trials (Fig. 1C), and this manipulation resulted in a saccade to a distractor on many trials. The greatest effect on saccade choice was on the 1st trial after the target and distractors switched colors. The monkeys made an incorrect saccade to a distractor on 34% of the 1st trials after the feature switch. On the 2nd trial the error rate decreased to 20% and by the 5th trial after the switch the error rate stabilized at about 9%. A complete description of the behavior and neural activity on correct trials during this task was previously published (Bichot and Schall 2002). Because there were relatively few error trials after the 2nd trial after the switch, it was necessary to combine the results from the 2nd trial and all subsequent trials until the next feature switch into one group.
Reaction times reflected the differences in difficulty across trials. Figure 11 shows the cumulative reaction time distributions. The longest reaction times were on correct trials immediately after the feature switch (average = 292.1 ms). The shortest reaction times were on the easy correct trials, trials that occurred on the 2nd trial or later after the feature switch (243.3 ms). Reaction times on error trials were intermediate to the correct trials, and the reaction time distributions did not differ significantly for the errors that occurred on the first trial or on the later trials after the feature switch (1st trial errors = 254.7 ms; 2+ trial errors = 252.2 ms).
FIG. 11.

Cumulative distributions of saccadic reaction times during the popout search with feature switching task. Shown separately are the distributions of reaction times on the 1st trials after the feature switch (green: correct saccades to the singleton target; blue: error saccade to a distractor), and all the remaining trials (red: corrects; orange: errors).
A total of 78 neurons were recorded from the FEF of 2 monkeys while they performed the feature switching task. Of these neurons, 30 exhibited task-related modulation and provided enough error trials for the analysis. Analysis of these data was identical to that performed on the easy–hard data. For this set of data, there were 4 groups of trials: 1) correct trials occurring on the 2nd or later trials after feature switches, 2) error trials occurring on the 2nd or later trials after feature switches, 3) correct trials occurring on the 1st trial after feature switches, and 4) error trials occurring on the 1st trial after the feature switches.
The distribution of baseline ROC areas and presaccadic ROC areas on error trials from individual neurons is shown in Fig. 12. The results were the same as in the easy–hard visual search task. There was no evidence of a pretrial bias that could influence saccade choice in the 30 ms immediately after the presentation of the search array. During this time the ROC areas averaged 0.51 on the first trial after the switch, and 0.50 on the later trials. Neither distribution was significantly different from 0.5 [1st trial: t-test, t(29) = 0.347, P = 0.7; 2+ trials: t(29) = 0.141, P = 0.9]. In the 30 ms before saccade initiation, nearly all of the neurons had ROC areas >0.5 [1st trials: t(29) = 8.25, P <0.001; 2+ trials: t(29) = 6.47, P < 0.001]. Before errant saccades the ROC areas averaged 0.71 on the 1st trials after the switch and 0.75 on the later trials. As in the easy–hard visual search task, FEF neurons selected the saccade goal, not the oddball of the search array.
FIG. 12.

Distribution of ROC areas for the population of FEF neurons on error trials during the feature switching task. Conventions are the same as in Fig. 4. White bars: distribution of ROC areas obtained from the 1st trials after feature switches; dark bars: distribution of ROC areas obtained from all remaining trials.
Figure 13 shows the combined average spike density functions and ROC areas, pooled across the sample of 30 neurons aligned on search array presentation (Fig. 13, A and B), and saccade initiation (Fig. 13, C and D). The population average ROC areas exhibit some of the same trends as during easy–hard search. On error trials, neurons selected the saccade goal, not the oddball stimulus of the search array, even though the oddball was very different from the distractors. Even at the beginning of the selective response that started around 100 ms after search array presentation (Fig. 13, A and B), we found no evidence of selection for the singleton target. The selection of the saccade goal emerges earliest on correct trials after the 1st trial after the feature switch, and latest on the 1st trial after the feature switch. Also, before the saccade, the magnitude of selection reached is highest on correct trials. There was one notable difference. On errors occurring on the 1st trial after the feature switch (the most difficult trials), the time course of the growth of the ROC after the presentation of the search array coincided best with the correct later trials (the easiest trials), not with the correct 1st trials. This result is probably attributable to feature priming. On the 1st trial after the feature switch the monkey had been primed to look for a target stimulus with the same color as that of the previous trial, but the previous trial’s target color was now the distractor color. Thus when errors were made on the 1st trials after the feature switch it was because the monkey selected the expected target color at the same speed as that of the previous trials. For the later trials after the switch, the selection occurred later on error trials than on correct trials, but the reaction times were about the same (Fig. 11). This suggests that the selection process on some trials, for an unknown reason, was not as efficient and the monkey generated a saccade before the correct target was identified. The magnitude of selection reached before the saccade was the lowest for these errors.
FIG. 13.

Pooled average of FEF activity and ROC areas from the feature switching task. Average responses pooled from 30 neurons are shown. Trial types are differentiated by color (green: 1st trial corrects; blue: 1st trial errors; red: 2+ trial corrects; orange: 2+ trial errors). Conventions are the same as in Fig. 5. A: time course of FEF activity aligned on the time of search array presentation and plotted up to the mean saccade latency for each condition. Solid lines plot the activity when the target was in the response field and dotted lines plot the activity when distractors were in the response field. B: average ROC areas plotted as a function of time aligned on the time of search array presentation (corresponds to the activity plotted in A). C: pooled FEF activity aligned on the time of saccade initiation. D: average ROC area aligned on the time of saccade initiation (corresponds to the activity plotted in C).
Of particular interest was whether there was a correlation between the probability of the saccade choice and the maximum ROC area reached for the feature-switching task that was similar to what was observed with the easy–hard task. Figure 14 shows this relationship for the feature-switching task for the 4 conditions for the 30 neurons with enough trials to analyze. The ROC area values were obtained by averaging the ROC area across the 30 ms before saccade initiation when the trials were aligned on the time of saccade initiation. There was a significant correlation (r = 0.25, P = 0.007). A multiple regression analysis, regressing ROC area against probability of saccade choice, average saccade peak velocity, average saccade amplitude, and average saccade latency, showed that only the probability of saccade choice accounted significantly for the variation in ROC area [y-intercept = 0.71, slope = 0.12; F(1,118) = 7.63, P = 0.007]. (As before, the saccade metric measurements were normalized to the mean values from each session because different eccentricities were used.) Although a completely different set of data was analyzed from 2 different experiments, the results from the easy–hard task (Fig. 8B) and the feature switching task (Fig. 14) are remarkably similar.
FIG. 14.

Correlation of magnitude of presaccadic selection to probability of behavioral choice in the feature switching task. Conventions are the same as in Fig. 8B. ROC area averaged over the 30 ms before saccade initiation for each trial condition (see Fig. 13D) is plotted as a function of the monkey’s probability of making that choice. Data from each of the 30 recording session contributed 4 data points, one for each of the trial types (small circles, differentiated by color). Equation of the principal axis of the regression ellipse is shown. There is significant correlation (r = 0.25, P = 0.007). Large colored circles plot ROC area as a function of saccade probability averaged across all recording sessions for the 4 trial types.
DISCUSSION
In 2 different visual search experiments, monkeys often made errors in choosing the correct target stimulus as the saccade goal. Instead of shifting gaze to the singleton target, they made a saccade to one of the distractor stimuli. In this study, we compared the target selection signals in the FEF on the error trials to that on correct trials. The errors in choosing the saccade goal in the 2 experiments were likely the result of different mechanisms. Errors while performing the easy–hard visual search task were attributed to a bottom-up perceptual ambiguity, an increase in the difficulty in discriminating the target from distractors. In contrast, errors while performing the feature switching task were likely attributable to the top-down influence of expecting a specific target feature; this is often referred to as perceptual priming (Bichot and Schall 2002; Malkovic and Nakayama 1994; McPeek et al. 1999). Nevertheless, the results from the 2 different tasks were remarkably similar. FEF neurons exhibited selection for the saccade goal, not the oddball stimulus in the search array, and the magnitude of the selection before saccades was proportional to the probability of making each choice. These results are consistent with the view that FEF activity forms a salience map: an integration of bottom-up and top-down influences in a topographic map with multiple peaks of activity with the highest activity peak specifying the goal of the next saccade (reviewed in Thompson et al. 2001).
Relationship to saccade production
The present results strengthen the argument that FEF is involved in perceptual decision processes leading to a saccade decision rather than only preparing a saccade to a goal chosen elsewhere in the brain, such as in LIP (e.g., Roitman and Shadlen 2002). The evidence for this is that the magnitude of activity depends on both the visual similarity of objects in the visual scene (easy–hard search task), and on top-down knowledge based on previous trials (feature-switching search task). Also, the magnitude of presaccadic selection was correlated with the probability of the monkeys’ decision and not with the metrics of the saccades. This is consistent with previous work that showed that visually responsive neurons in FEF are more related to visual processing than to saccade production (Hanes et al. 1998; Murthy et al. 2001; Sato and Schall 2003; Thompson et al. 1996, 1997).
The same pattern of activity in movement neurons as visual neurons corroborates theories of information processing that propose that information flows continuously from visual selection processes to movement preparation processes (Bichot et al. 2001a; Eriksen and Schultz 1979). This was surprising because, although the saccades made on error trials were to visual stimuli located at the same positions as on correct trials, the presaccadic activation of movement neurons reached different levels across the different stimulus–response conditions (Fig. 10). This result was not expected because previous work has shown that the activity of movement neurons rises to a constant threshold before saccade initiation (Hanes and Schall 1996). There are 2 possible explanations for the difference in results that are still consistent with the rise-to-threshold hypothesis. First, a threshold was reached earlier than in the time measured in this study. In the easy–hard task movement neurons exhibited a similar level of activity across the different trial conditions at about 60 ms before saccade initiation at which time the activity diverged. However, Hanes and Schall (1996) also measured movement activity within the 30 ms before saccade initiation. An alternative explanation is that the saccade initiation threshold was different across the different trial conditions. In the previous study (Hanes and Schall 1996), the visual target stimulus was always presented alone and was the only possible saccade target. In this study the visual target was presented within the context of a search array and a decision of which stimulus to look at was required. It is possible that a threshold was reached, but the threshold was different for the different target–distractor combinations or it is possible that lower thresholds favored error trials. Resolving this apparent inconsistency will require further investigation.
A visual salience map in FEF
When viewing a scene, our attention and gaze are directed to conspicuous objects that stand out from the background. Visual conspicuity occurs when an object has a unique feature (e.g., color, motion) that sets it apart from the rest of the image. When an object is visually conspicuous, it captures attention through a bottom-up process. Bottom-up refers to the automatic, preattentive processing that occurs in a massively parallel manner across the entire visual field and is based exclusively on the properties of the image. In addition, an object will stand out when it matches the viewer’s expectations, such as when searching for something familiar or for an object with a specific feature (e.g., Bichot and Schall 1999a; Motter and Belky 1998). In this case attention is guided through a top-down process. Top-down refers to selection based on cognitive factors such as the goals and knowledge. Usually, attention and gaze are guided by a combination of bottom-up and top-down influences (Yarbus 1967).
Models of attention and saccade target selection posit the existence of a 2-dimensional topographic “salience map” of the visual world in the brain that controls the deployment of covert attention and saccadic eye movements (Cave and Wolfe 1990; Findlay and Walker 1999; Itti and Koch 2001; Olshausen et al. 1993; Treisman 1988; Wolfe 1994). To effectively guide visual attention and eye movements in a complex world, it is essential that the activity on this map represent bottom-up physical salience regardless of what visual feature renders the salience, and top-down knowledge and expectations of the viewer. Therefore because of top-down influences, the most physically salient object may not necessarily be represented by the highest activity. A winner-take-all competition within this “salience map” gives rise to the most behaviorally relevant location, and specifies the goal for the next eye movement (reviewed in Itti and Koch 2001).
Behaviorally, an object’s “salience” is indexed by the probability that it becomes the goal of the next saccade. During each fixation, there are multiple peaks of activity across the theoretical salience map. The behavioral relevance of any one object in the world depends not only on the magnitude of its representation on the map, but also on the other activity peaks across the map that represent competing objects. An object is more behaviorally relevant when its peak on the map is much greater than the other peaks and is less behaviorally relevant when the peaks are similar in magnitude. Therefore in a saccade choice task, the relative differences between the activity peaks on the salience map would be indexed by saccade probability.
We previously proposed that FEF serves as a salience map (reviewed in Thompson and Bichot 2004; Thompson et al. 2001). This view was based on the results of several different experiments that probed the visual selection process in FEF during visual search. Unlike in other areas of the visual system (e.g., Ogawa and Komatsu 2004), FEF neurons do not exhibit feature selectivity (Mohler et al. 1973; Schall et al. 1995); instead they exhibit selective activation that represents the spatial location of behaviorally relevant stimuli, whether that relevance is derived from bottom-up or from top-down factors (Bichot and Schall 1999b, 2002; Bichot et al. 2001a; Sato et al. 2001, 2003). However, the conclusions from these studies were based solely on activity during correct trials.
The salience map hypothesis makes specific predictions about the activation patterns on error trials during visual search. The peak on the theoretical salience map specifies the goal for the saccade. When the distractor representation on the salience map approaches that of the singleton target, there is a greater probability that on any one trial the activation to a distractor will exceed that of the target and an incorrect saccade will be made to the distractor. Furthermore, the magnitude of selection on correct trials should be inversely related to the magnitude of selection on corresponding error trials.
Consistent with the predictions, our results show that the highest peak of activity in FEF corresponds to the goal of the forthcoming saccade, even when that saccade was not to the most physically salient stimulus. In the easy–hard task too few errors were made in the easy condition to analyze. The lack of errors in this case is likely a result of the large difference between the distractor and target representations and thus the low probability of the distractor-related activation exceeding that of the target. In the feature-switching task there were enough errors to analyze for both conditions, and the magnitude of selection on correct trials was inversely related to the magnitude of selection on error trials.
Previously, Bichot et al. (2001b) showed that the differences in the magnitude of selection on correct easy and hard search trials are correlated with the monkey’s probability of making a saccade to the oddball stimulus across different search conditions. We have now extend these findings by demonstrating that the magnitude of selection in FEF that is associated with choosing an item of a search array is correlated with the probability of making that choice. The magnitude of selection could be described as being related to the monkeys’ confidence that the chosen item is the correct target. On misses (Fig. 9), the monkeys did not reach a sufficient level of confidence to produce a saccade, and instead reported that no target was present. The pattern of activity observed across trial conditions is more consistent with the hypothesis that FEF-selective activity forms a saccade probability (or salience) map, than with the alternate hypothesis that the selective activity in FEF is directly related to saccade production.
Other work has shown that the representation of salience in FEF is dissociated from saccade production. Visual selection occurs in FEF visual neurons when the monkey passively views popout visual search arrays (Thompson et al. 1997), and in a visual search task that required manual responses without saccades (Biscoe and Thompson 2003). In an experiment in which the target of a search array changed locations before the monkey could make a saccade, the selective activation of FEF neurons tracked the location of the popout visual stimulus even on trials in which the saccade was made to the original target location (Murthy et al. 2001). Finally, in an antisaccade search task in which the monkeys were instructed by the shape of the singleton target to make a saccade to the distractor opposite the target, FEF neurons first exhibited selection for the singleton target before selecting the opposite distractor that was the saccade goal (Sato and Schall 2003). Altogether, the evidence suggests that the selection signal in FEF is independent of saccade production; it is an explicit representation of the visual world that could serve as a general map of salience for guiding covert attention and other types of orienting behavior.
Identifying a salience map in FEF is important because it means that the concept of a salience map that predicts saccade behavior is a physiologically sound theoretical construct that can be useful in guiding future theoretical and empirical investigations of attention and eye movements. Also, the relative roles of top-down and bottom-up influences to visual salience can be measured physiologically in FEF activity. It should be noted that, although we have focused on our data from FEF, the representation of visual salience is likely distributed in a network involving many visuomotor structures such as the superior colliculus (Findlay and Walker 1999; McPeek and Keller 2002) and posterior parietal cortex (Gottlieb et al. 1998; Kusunoki et al. 2000).
Acknowledgments
We thank Dr. Jeffrey Schall for helpful comments on the manuscript. The data were collected in Dr. Schall’s laboratory at Vanderbilt University.
GRANTS
This work was supported by National Eye Institute Grants R01-EY-08890 and P30-EY-08126.
References
- Bichot NP, Rao SC, Schall JD. Continuous processing in macaque frontal cortex during visual search. Neuropsychologia. 2001a;39:972–982. doi: 10.1016/s0028-3932(01)00022-7. [DOI] [PubMed] [Google Scholar]
- Bichot NP, Schall JD. Saccade target selection in macaque during feature and conjunction visual search. Vis Neurosci. 1999a;16:81–89. doi: 10.1017/s0952523899161042. [DOI] [PubMed] [Google Scholar]
- Bichot NP, Schall JD. Effects of similarity and history on neural mechanisms of visual selection. Nat Neurosci. 1999b;2:549–554. doi: 10.1038/9205. [DOI] [PubMed] [Google Scholar]
- Bichot NP, Schall JD. Priming in macaque frontal cortex during popout visual search: feature-based facilitation and location-based inhibition of return. J Neurosci. 2002;22:4675–4685. doi: 10.1523/JNEUROSCI.22-11-04675.2002. [DOI] [PMC free article] [PubMed] [Google Scholar]
- Bichot NP, Schall JD, Thompson KG. Visual feature selectivity in frontal eye fields induced by experience in mature macaques. Nature. 1996;381:697–699. doi: 10.1038/381697a0. [DOI] [PubMed] [Google Scholar]
- Bichot NP, Thompson KG, Rao SC, Schall JD. Reliability of macaque frontal eye field neurons signaling saccade targets during visual search. J Neurosci. 2001b;21:713–725. doi: 10.1523/JNEUROSCI.21-02-00713.2001. [DOI] [PMC free article] [PubMed] [Google Scholar]
- Biscoe KL, Thompson KG. Society for Neuroscience Abstracts. Washington, DC: Society for Neuroscience; 2003. Visual selection without saccade planning in the frontal eye field of macaques. Program No. 180.7, 2003 Abstracts Viewer/Itinerary Planner. CD-ROM. [Google Scholar]
- Britten KH, Shadlen MN, Newsome WT, Movshon JA. The analysis of visual motion: a comparison of neuronal and psychophysical performance. J Neurosci. 1992;12:4745–4765. doi: 10.1523/JNEUROSCI.12-12-04745.1992. [DOI] [PMC free article] [PubMed] [Google Scholar]
- Bruce CJ, Goldberg ME. Primate frontal eye fields. I. Single neurons discharging before saccades. J Neurophysiol. 1985;53:603–635. doi: 10.1152/jn.1985.53.3.603. [DOI] [PubMed] [Google Scholar]
- Cave KR, Wolfe JM. Modeling the role of parallel processing in visual search. Cognit Psychol. 1990;22:225–271. doi: 10.1016/0010-0285(90)90017-x. [DOI] [PubMed] [Google Scholar]
- Crist CF, Yamasaki DS, Komatsu H, Wurtz RH. A grid system and a mircrosyringe for single cell recording. J Neurosci Methods. 1988;26:117–122. doi: 10.1016/0165-0270(88)90160-4. [DOI] [PubMed] [Google Scholar]
- D’Zmura M. Color in visual search. Vision Res. 1991;31:951–966. doi: 10.1016/0042-6989(91)90203-h. [DOI] [PubMed] [Google Scholar]
- Eriksen CW, Schultz D. Information processing in visual search: a continuous flow conception and experimental results. Perception and Psychophysics. 1979;25:249–263. doi: 10.3758/bf03198804. [DOI] [PubMed] [Google Scholar]
- Findlay JM, Walker R. A model of saccade generation based on parallel processing and competitive inhibition. Behav Brain Sci. 1999;22:661–674. doi: 10.1017/s0140525x99002150. [DOI] [PubMed] [Google Scholar]
- Gottlieb JP, Kusunoki M, Goldberg ME. The representation of visual salience in monkey parietal cortex. Nature. 1998;391:481–484. doi: 10.1038/35135. [DOI] [PubMed] [Google Scholar]
- Green DM, Swets JA. Signal Detection Theory and Psychophysics. New York: Wiley; 1966. [Google Scholar]
- Hanes DP, Patterson WF, Schall JD. Role of frontal eye fields in countermanding saccades: visual, movement, and fixation activity. J Neurophysiol. 1998;79:817–834. doi: 10.1152/jn.1998.79.2.817. [DOI] [PubMed] [Google Scholar]
- Hanes DP, Schall JD. Neural control of voluntary movement initiation. Science. 1996;274:427–430. doi: 10.1126/science.274.5286.427. [DOI] [PubMed] [Google Scholar]
- Hikosaka O, Wurtz RH. Visual and oculomotor functions of monkey substantia nigra pars reticulata. III. Memory-contingent visual and saccade responses. J Neurophysiol. 1983;49:1268–1284. doi: 10.1152/jn.1983.49.5.1268. [DOI] [PubMed] [Google Scholar]
- Horwitz GD, Newsome WT. Separate signals for target selection and movement specifications in the superior colliculus. Science. 1999;284:1158–1161. doi: 10.1126/science.284.5417.1158. [DOI] [PubMed] [Google Scholar]
- Itti L, Koch C. Computational modelling of visual attention. Nat Rev Neurosci. 2001;2:194–203. doi: 10.1038/35058500. [DOI] [PubMed] [Google Scholar]
- Kim J-N, Shadlen MN. Neural correlates of a decision in the dorsolateral prefrontal cortex of the macaque. Nat Neurosci. 1999;2:176–185. doi: 10.1038/5739. [DOI] [PubMed] [Google Scholar]
- Kusunoki M, Gottlieb J, Goldberg ME. The lateral intraparietal area as a salience map: the representation of abrupt onset, stimulus motion, and task relevance. Vision Res. 2000;40:1459–1468. doi: 10.1016/s0042-6989(99)00212-6. [DOI] [PubMed] [Google Scholar]
- Maljkovic V, Nakayama K. Priming of pop-out: I. Role of features. Mem Cognit. 1994;22:657–672. doi: 10.3758/bf03209251. [DOI] [PubMed] [Google Scholar]
- McPeek RM, Keller EL. Saccade target selection in the superior colliculus during a visual search task. J Neurophysiol. 2002;88:2019–2034. doi: 10.1152/jn.2002.88.4.2019. [DOI] [PubMed] [Google Scholar]
- McPeek RM, Maljkovic V, Nakayama K. Saccades require focal attention and are facilitated by a short-term memory system. Vision Res. 1999;39:1555–1566. doi: 10.1016/s0042-6989(98)00228-4. [DOI] [PubMed] [Google Scholar]
- Mohler CW, Goldberg ME, Wurtz RH. Visual receptive fields of frontal eye field neurons. Brain Res. 1973;61:385–389. doi: 10.1016/0006-8993(73)90543-x. [DOI] [PubMed] [Google Scholar]
- Motter BC, Belky EJ. The guidance of eye movements during active visual search. Vision Res. 1998;38:1805–1815. doi: 10.1016/s0042-6989(97)00349-0. [DOI] [PubMed] [Google Scholar]
- Murthy A, Thompson KG, Schall JD. Dynamic dissociation of visual selection from saccade programming in frontal eye field. J Neurophysiol. 2001;86:2634–2637. doi: 10.1152/jn.2001.86.5.2634. [DOI] [PubMed] [Google Scholar]
- Nagy AL, Sanchez RR. Critical color differences determined with a visual search task. J Opt Soc Am A. 1990;7:1209–1217. doi: 10.1364/josaa.7.001209. [DOI] [PubMed] [Google Scholar]
- Ogawa T, Komatsu H. Target selection in area V4 during a multidimensional visual search task. J Neurosci. 2004;24:6371–6382. doi: 10.1523/JNEUROSCI.0569-04.2004. [DOI] [PMC free article] [PubMed] [Google Scholar]
- Olshausen BA, Anderson CH, Van Essen DC. A neurobiological model of visual attention and invariant pattern recognition based on dynamic routing of information. J Neurosci. 1993;13:4700–4719. doi: 10.1523/JNEUROSCI.13-11-04700.1993. [DOI] [PMC free article] [PubMed] [Google Scholar]
- Roitman JD, Shadlen MN. Response of neurons in the lateral intraparietal area during a combined visual discrimination reaction time task. J Neurosci. 2002;22:9475–9489. doi: 10.1523/JNEUROSCI.22-21-09475.2002. [DOI] [PMC free article] [PubMed] [Google Scholar]
- Sato T, Murthy A, Thompson KG, Schall JD. Search efficiency but not response interference affects visual selection in frontal eye field. Neuron. 2001;30:583–591. doi: 10.1016/s0896-6273(01)00304-x. [DOI] [PubMed] [Google Scholar]
- Sato T, Watanabe K, Thompson KG, Schall JD. Effect of target–distractor similarity on FEF visual selection in the absence of the target. Exp Brain Res. 2003;151:356–363. doi: 10.1007/s00221-003-1461-1. [DOI] [PubMed] [Google Scholar]
- Sato TR, Schall JD. Effects of stimulus–response compatibility on neural selection in frontal eye field. Neuron. 2003;38:637–648. doi: 10.1016/s0896-6273(03)00237-x. [DOI] [PubMed] [Google Scholar]
- Schall JD, Hanes DP. Neural basis of saccade target selection in frontal eye field during visual search. Nature. 1993;366:467–469. doi: 10.1038/366467a0. [DOI] [PubMed] [Google Scholar]
- Schall JD, Hanes DP, Thompson KG, King DJ. Saccade target selection in frontal eye field of macaque. I. Visual and premovement activation. J Neurosci. 1995;15:6905–6918. doi: 10.1523/JNEUROSCI.15-10-06905.1995. [DOI] [PMC free article] [PubMed] [Google Scholar]
- Schall JD, Sato TR, Thompson KG, Vaughn AA, Juan CH. Effects of search efficiency on surround suppression during visual selection in frontal eye field. J Neurophysiol. 2004;91:2765–2769. doi: 10.1152/jn.00780.2003. [DOI] [PubMed] [Google Scholar]
- Thompson KG, Bichot NP. A visual salience map in the primate frontal eye field. Prog Brain Res. 2004;147:251–262. doi: 10.1016/S0079-6123(04)47019-8. [DOI] [PubMed] [Google Scholar]
- Thompson KG, Bichot NP, Schall JD. Dissociation of visual discrimination from saccade programming in Macaque frontal eye field. J Neurophysiol. 1997;77:1046–1050. doi: 10.1152/jn.1997.77.2.1046. [DOI] [PubMed] [Google Scholar]
- Thompson KG, Bichot NP, Schall JD. From attention to action in frontal cortex. In: Braun J, Koch C, Davis J, editors. Visual Attention and Cortical Circuits. Cambridge, MA: MIT Press; 2001. [Google Scholar]
- Thompson KG, Bichot NP, Schall JD. Society for Neuroscience Abstracts. Washington, DC: Society for Neuroscience; 2002. Frontal eye field activity before visual search errors. Program No. 464.3, 2002 Abstracts Viewer/Itinerary Planner. CD-ROM. [Google Scholar]
- Thompson KG, Hanes DP, Bichot NP, Schall JD. Perceptual and motor processing stages identified in the activity of macaque frontal eye field neurons during visual search. J Neurophysiol. 1996;76:4040–4055. doi: 10.1152/jn.1996.76.6.4040. [DOI] [PubMed] [Google Scholar]
- Treisman A. Features and objects: The Fourteenth Bartlett Memorial Lecture. Q J Exp Psychol. 1988;40A:201–237. doi: 10.1080/02724988843000104. [DOI] [PubMed] [Google Scholar]
- Wolfe JM. Guided Search 2.0: a revised model of visual search. Psychonom Bull Rev. 1994;1:202–238. doi: 10.3758/BF03200774. [DOI] [PubMed] [Google Scholar]
- Yarbus AL. Eye Movements and Vision. New York: Plenum Press; 1967. [Google Scholar]