Summary
We estimate a Cox proportional hazards model where one of the covariates measures the level of a subject's cognitive functioning by grading the total score obtained by the subject on the items of a questionnaire. A case study is presented where the sample includes partial respondents, who did not answer some questionnaire items. The total score takes hence the form of an interval-censored variable and, as a result, the level of cognitive functioning is missing on some subjects. We handle partial respondents by taking a likelihood-based approach where survival time is jointly modelled with the censored total score and the size of the censoring interval. Estimates are obtained by an E-M-type algorithm that reduces to the iterative maximization of three complete log-likelihood functions derived from two augmented datasets with case weights, alternated with weights updating. This methodology is exploited to assess the Mini Mental State Examination index as a prognostic factor of survival in a sample of Chinese older adults.
Keywords: Composite index, Cox model, Data augmentation, E-M algorithm, Generalized linear mixed models, Interval censoring, Non-ignorable missing covariate, Partial respondents
1. Introduction
Composite covariates are indexes that summarize the values taken by several variables and are often exploited as predictors in regression modelling. In longevity studies, for example, the Mini-Mental State Examination (MMSE; [1]) index is frequently used to assess the cognitive mental status in older adults, and is often included as a covariate in a Cox [2] proportional hazards model, to detect significant mortality differentials [3, 4, 5]. The MMSE index is based on a questionnaire whose items are tests assessing orientation, attention, language skills, and the ability to follow simple commands. A number of versions of mini-mental examination questionnaires have been proposed in the literature: differences include both the type and the number of items. Regardless of the structure of the questionnaire, however, the cognitive mental status of a subject is typically assessed by summing the scores that she/he obtained on the questionnaire items and comparing her/his total score to a reference cut-off. This cutoff is chosen according to a specific definition of cognitive impairment [6] or on the basis of population-based norms [7], depending on the purpose of the analysis. Accordingly, the MMSE index grades the questionnaire total score in two levels, say 1 if the total score is greater than or equal to a cut-off d and 0 otherwise, clustering subjects into cognitively normal and impaired cases, respectively.
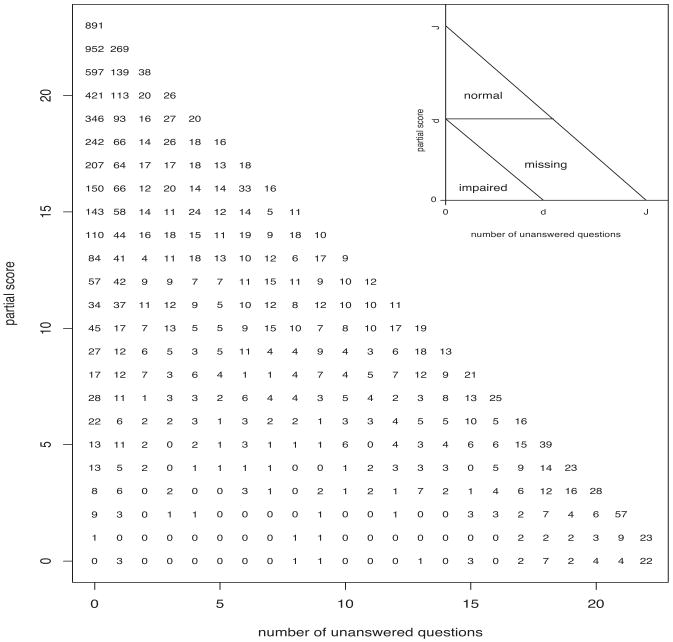
In large studies where cognitive functioning is assessed through a MMSE, the sample often includes partial respondents, who did not answer some questionnaire items. The MMSE total score of partial respondents takes the form of an interval-censored variable, because the total score is only known to lie within a censoring interval. The lower extreme of this interval is equal to the partial score obtained by the subject on the observed part of the questionnaire. The size of the censoring interval is given by the maximum score that can be obtained on the missing items. Because the MMSE index is a piece-wise constant function of the MMSE total score, with a jump at a cut-off point d, this index is missing when the censoring interval of the total score includes d. Given this cut-off, the sample is hence partitioned into three sub-samples that respectively include normal and impaired cases, and cases whose MMSE index level is unknown. These three sub-samples can be geometrically described by representing questionnaires as points whose coordinates are the maximum score that can be obtained on the unanswered items and the partial score obtained on the observed part of the questionnaire. In this two-dimensional questionnaires space, subjects with a MMSE index level 0 (1) are included in a lower (upper) triangle, while subjects with a missing MMSE index are included in a parallelogram. The sizes of these three polygons depend on the cut-off d that have been chosen to specify the index (Figure 1: top right corner).
Figure 1.
The 7352 questionnaires in the CLHLS dataset, clustered by the number of unanswered questions and the partial score obtained on the answered questions. Top right corner: the questionnaires space, where subjects that are examined by a MMSE questionnaire are represented as points whose coordinates are the maximum score that can be obtained on the unanswered items of the questionnaire and the partial score that has been obtained on the answered items, in an example when the maximum total score that can be obtained is equal to J. If the MMSE index grades the total score according to a cut-off d, subjects in the lower (upper) triangle receive an index level 0 (1), while the index level is missing for all the questionnaires that are included in the parallelogram.
We present a case study of the Chinese Longitudinal Health and Longevity Survey (CLHLS), where cognitive functioning is assessed through a MMSE questionnaire and the MMSE index is used as covariate in a Cox model to detect mortality differentials in older adults. Because the sample include partial respondents, we face a missing value problem, as standard estimation methods of a Cox model require full covariate information.
In gerontology studies that use the MMSE index to assess cognitive impairment, two are the most popular approaches that are pursued to handle partial respondents. Referred to as complete cases (CC) analysis, a first approach is based on discarding subjects with a missing index from the study [8] and [9]. All the subjects with questionnaires in the parallelogram of the questionnaires space are therefore discarded and the effect of the index is estimated by comparing subjects with questionnaires in the lower triangle and cases included in the upper triangle. A second approach is based on counting missing answers as incorrect answers (missing-as-incorrect; MAI), i.e., partial respondents receive a 0 score for each question they leave unanswered [10, 11]. By pursuing a MAI analysis, the lower triangle and the parallelogram of the questionnaire space are merged in one class of cognitively impaired cases. The index effect is thus estimated by comparing subjects with questionnaires in the upper triangle to the rest of the sample.
Both MAI and CC analyses are based on two implicit assumptions on the probability distribution of the failures to observe a MMSE index value, also known as the missing-data mechanism in the literature on missing data [12, 13]. According to the missing-data terminology, data are said missing completely at random (MCAR) if the missing-data mechanism does not depend on any data, either observed or missing. Under MCAR, subjects with a missing MMSE index are a random sample of the data and they are not expected to differ systematically from the complete cases with respect to the survival outcome. In this case, the exclusion of incomplete cases, as operated by a CC analysis, does not bias the estimates. If the data are not MCAR, however, CC estimates may be seriously biased. In the case of MMSE partial respondents, it is difficult to motivate an MCAR assumption, because a missing MMSE index is the outcome of a combination of the cut-off chosen for grading the total scores, the maximum score achievable on the missing items and the observed partial score. Moreover, as the fraction of missing data increases, the deletion of all subjects with missing data decreases the efficiency of CC estimates, whether or not bias is involved. If failure to observe a MMSE index depends on the subject's cognitive functioning then the data are said non-ignorable missing (NIM). If values of the MMSE index are NIM, then a missing value is informative of cognitive functioning and the missing value mechanism should be either estimated jointly with the Cox model [13, 14] or at least a priori assumed to impute missing data [15]. MAI analysis is an imputation method, where the failure to observe an MMSE index value is assumed to occur with certainty among cognitively impaired subjects, regardless of their covariate profile and survival outcome. If this missing-data mechanism holds, MAI analysis is an efficient and simple strategy to account for partial respondents. Otherwise, MAI estimates may be difficult to interpret. Beside cognitive impairment, there are many factors that may lead to missing items in a questionnaire, including poor physical health, depression and anxiety. The effects of these factors are mixed with cognitive functioning when missing answers are counted as incorrect answers. Moreover, the precision of MAI estimates may be overestimated, because subjects with a missing MMSE index contribute to the analysis as complete cases, and, as a result, the uncertainty that results from censored MMSE total scores is not taken into account.
As a compromise between discarding partial respondents and including them as impaired cases, we work with a likelihood function where questionnaires contribute with different terms, according to the complete or partial information they provide. Our analysis is based upon the likelihood-based (LB) approach that has been suggested by Herring et al. [14], to estimate a Cox model with non-ignorable missing covariates. Within this methodological framework, we consider a parsimonious strategy to account for the composite nature of the missing covariate. Parameter estimation is carried out by a E-M-type algorithm, which essentially reduces to the iterative maximization of three complete log-likelihood functions on two augmented datasets with case weights, alternated with weights updating.
The rest of the paper is organized as follows. After reporting some details on the CLHLS data that motivated this study (Section 2), modelling assumptions on the observed and missing data are outlined in Section 3. The practical implementation of the LB approach is discussed in Section 4. In Section 5, we show the results provided by the proposed method on the CLHLS data and compare them with those obtained by CC- and MAI-based methods. Final comments are summarized in Section 6.
2. Data
The CLHLS data that motivated this article are drawn from the Study No. 3891 of the Inter-University Consortium for Political and Social Research (www.icpsr.umich.edu; [16]). The study was carried out on subjects aged between 80 and 106 in 1998 and in two subsequent follow-up waves in 2000 and 2002. We have left-truncated, right censored survival data on 7352 subjects with a number of fully observed covariates, collected at the entry time: gender, type of residence (rural or urban), whether the subject is sedentary or active, and limits in activities of daily living (ADL; six activities including bathing, dressing, eating, indoor transferring, toileting and continence), categorized into three levels: no, one, two or more limits. In this sample, the median age upon entry into the study is 92 years, while the lower and the upper quartiles are respectively 91 and 100 years, 59% of the subjects are males, 64% are rural residents, 45% have a sedentary lifestyle, 14% have one limit in ADL and finally 20% have two or more ADL limits.
The covariate of main interest in this study is the MMSE index, which is computed from the total score obtained by a subject on the Chinese version of the MMSE questionnaire. We concentrate on the assessment of cognitive impairment as a prognostic factor and, accordingly, only the MMSE index obtained by subjects upon entry into the study is included in the analysis. Subjects who missed all MMSE items were not included in the study: it is likely that these subjects were not examined using the MMSE questionnaire, for reasons that are not related to cognitive impairment. The methods described in Sections 3 and 4 however allow for the inclusion of completely missing questionnaires.
Questions in a MMSE questionnaire are typically compound and include a number of single items to be separately asked to the subject. Scores on each item are normally binary (e.g., 1 for a correct answer and 0 otherwise). The scoring range of each question hence includes all the integer values between zero and the number of compounding items. With respect to the popular 30-items MMSE [1], the 23-items Chinese MMSE adopts some appropriate adjustments to make the questions more understandable and answerable among ordinary oldest old Chinese, the majority of whom are illiterate [16]. Overall, respondents were asked a 5-items orientation-related question (naming the current time, animal year, season, festival, and county), a 12-items language-related question (6 items on word recalling, 3 items on word repetition and 3 items on sentence comprehension), a 5-items calculation question (respondents are asked to subtract 3 from 20, then 3 from the previous result, and so on) and a single-item drawing question (drawing a figure that is shown to the respondent). Orientation, language, calculation and drawing are therefore the four dimensions of cognitive impairment that are captured by the questionnaire and can be exploited to cluster the questionnaire items into G = 4 homogeneous groups. In the application (Section 5), we take this approach, although the proposed methodology (Sections 3 and 4) is described for a generic partitioning of the MMSE items into G groups.
Figure 1 displays the distribution of the questionnaires used in this study, clustered by the number of unanswered single items and the partial score obtained on the answered items. The effect of these two variables on survival is shown in Table I, which displays the results obtained after fitting the survival data by a Cox proportional hazards model, whose covariates include the percentage of missing items and correct answers. Conditionally on the percentage of correct answers, mortality risks significantly increase with the amount of unanswered questionnaire items, even after controlling for the remaining covariates in this study.
Table I.
Cox model estimates
| estimate | standard error | |
|---|---|---|
| age at entry (months) | -0.045400 | 0.000515 |
| male | 0.25348 | 0.029287 |
| rural residence | -0.00703 | 0.029344 |
| sedentary | 0.29669 | 0.031279 |
| one ADL limit | 0.24574 | 0.041029 |
| two or more ADL limits | 0.50045 | 0.037261 |
| % missing items | 0.00438 | 0.000625 |
| % correct answers | -0.00211 | 0.000677 |
The distribution of the MMSE index depends on the cut-off chosen for defining the index. As the cut-off increases from d = 10 to d = 17, percentages of the cognitively normal (impaired) cases monotonically decrease (increase). Percentages of the missing cases monotonically increase from 10% to 17%, as the cut-off increases from d = 10 to d = 17, then monotonically decrease down to 10%.
3. Modelling
3.1. Likelihood-based analysis
In the present study, the data are available for n subjects as vectors (ei, yi, δi, xi, zi, mi), i = 1… n. For each subject i, ei and yi are respectively the entry and exit time, while δi is a failure indicator (δi = 1 if a death occurred at yi, and 0 otherwise) and xi is a row profile of K fully observed covariates. Furthermore, the components of the row vector zi = (zi1 … zij …ziJ) indicate the subject's scores on the J single items of a MMSE questionnaire, some of which may be missing. Because single items are binary (zij = 0 or 1), J is the maximum score achievable on a MMSE questionnaire. The information available after a MMSE interview is completed by the row vector mi = (mi1 … mij …miJ) of missing indicators, where mij = 1 if zij is missing and 0 otherwise.
For each questionnaire i, we partition the items set {1… J} into the set M(i) = {j : mij = 1} of the missing items and the set O(i) = {j : mij = 0} of the observed items. Accordingly zM(i) denotes the vector of the missing scores, while zO(i) indicates the vector of the J – mi· observed scores. Furthermore, and respectively denote the partial and the unobserved scores obtained by the ith subject. Because the unobserved score may take any integer value between 0 and mi·, the total score is an interval-censored variable, with censoring interval .
Information provided by zi is summarized by the MMSE index D(zi) = D(zi·), which is equal to 1 if zi· ≥ d and 0 otherwise. In other words, this index is a piece-wise constant function of the total score zi·, with jump at the cut-off d. In the presence of missing items, only the partial score is known and, as result, index D is equal to 1 if , it alternatively takes the value 0 if , and it is otherwise missing.
Conditionally on the fully observed covariates, xi, and the entry time, ei, we model the joint distribution of the missing pattern mi, the exit time yi and the MMSE scores zi of subject i by the product of three conditional distributions:
| (1) |
The first distribution on the right hand side of (1) is the missing-data mechanism, which we assume known up to a vector of unknown parameters α. Given her/his MMSE scores zi = (zO(i), zM(i)), we denote the likelihood contribution that subject i provides to the missing-data mechanism as
| (2) |
to stress the dependence on the missing MMSE scores zM(i), whereas subscript i indicates dependence on the remaining data.
The third distribution on the right hand side of equation (1) is the conditional distribution of the MMSE scores given the observed covariates, which we assume known up to a vector of unknown parameters γ. Consistently with the notation exploited in (2), we denote the individual likelihood contribution as
| (3) |
To specify the exit time distribution p(yi∣ei, δi, zi, xi; β), time up to death t is modelled by a semi-parametric Cox proportional hazards model. Precisely, we assume that the survival time of subject i is drawn from a positive random variable T with hazard function
| (4) |
where h0(t) is a nonparametric baseline hazard function, β = (β0, βK) is a vector of fixed effects to be estimated and ri(β) is a parametric hazards ratio. Accordingly, the cumulative hazard is given by H(t∣xi, zi) = H0(t)ri(β) where is the baseline cumulative hazard. Under the hypothesis of noninformative censoring, the likelihood contribution of a left-truncated, right-censored subject is thus proportional to
| (5) |
Under model (1), therefore, the survival outcome (ei, yi, δi) of a subject with profile (zO(i), xi, mi) contributes to the likelihood with a term proportional to
| (6) |
where θ = (α, β, γ, h0) denotes all the parameters to be estimated.
In this study, the parameter of main interest is the effect β0 of being cognitively normal, as measured by the MMSE index. Parameters α and γ are instead treated as nuisance parameters. Because parameter estimation may become too computationally intensive and unstable with many nuisance parameters, we need to employ strategies to reduce the number of nuisance parameters in the specification of both the missing data mechanism p(mi∣α) and the MMSE score vector distribution p(zi∣γ). These two joint distributions could be, for example, modelled as a product of one-dimensional conditional distributions, a strategy that greatly reduces the number of nuisance parameters [18]. Unfortunately, this idea is unpractical when the dimension of a MMSE questionnaire is large, as happens in the case of the Folstein's (J = 30) and the Chinese MMSE questionnaires (J = 23). We therefore propose an alternative parsimonious specification of the two distributions, by clustering the questionnaire items in a number of homogeneous groups. Specifically, we partition the MMSE questionnaire in G groups of J1 … Jg … JG questions, , and introduce a G × J matrix B, whose generic element bgj is equal to 1 if item j belongs to group g and 0 otherwise. We accordingly refer to as the (censored) group-specific MMSE score (i.e., the censored number of correct answers in group g) and to as the number of unanswered questions in group g.
3.2. The missing value mechanism
An outcome often reported by the literature is the observation that missing scores on tests of cognitive impairment occur more frequently among cognitively impaired and/or physically disable patients [19, 20, 21]. Moreover, occurrences of missing data may systematically vary with the type and the difficulty of the unanswered questions. Motivated by this, we consider a binomial regression model where, conditionally on the fully observed covariates and the survival outcome, the expected number of missing items in each group of questions depends on the number of correct answers in that group. More precisely, the missing-data mechanism (2) is specified by
| (7) |
where the subject-specific conditional probability of a missing item in group g, namely pig(α) = pig(zig, xi, ei, yi), depends on zi only through zig. We complete the specification of the binomial regression model by assuming a canonical link transformation logit pig(α) = ηig(α), where ηig(α) is a linear predictor that is defined on the basis of the variables (ei, yi, xi, zig). The following linear predictor was exploited in the application (Section 5):
| (8) |
where α0g (Σg α0g = 0, for identifiability) and α1g capture the effect of the type and the difficulty of the gth group of questions, after correcting for other factors that may be influential in the individual coping with the questionnaire (age at interview, follow-up length, gender, type of residence, physical disabilities and life style).
3.3. The MMSE score distribution
Studies on the same CLHLS data considered in this paper have shown significant gender differentials in cognitive impairment [23] and a strong link between cognitive functioning and limits in daily activities [22]. A mixed logistic regression model is a parsimonious specification that allows us to include the effects of these covariates and simultaneously accounts for correlated scores between groups of questions. Specifically, we assume that, conditionally on a subject-specific random effect, scores obtained on different groups of questions are independent. More precisely, the MMSE score vector zi is assumed to be distributed according to
| (9) |
where Jg is the maximum score achievable within the gth group of questions, f(u∣σ2) = N(0, σ2) is a centered normal density with unknown variance σ2, and pig (u, γ) is the probability of a correct answer in group g. The specification of the MMSE score distribution is completed by logit pig(u, γ) = u + ηig(γ), where ηig(γ) is a linear predictor that is defined on the basis of the fully observed covariates xi and the entry time ei. The following linear predictor was exploited in the application (Section 5):
| (10) |
where parameters γ0g (Σg γ0g = 0, for identifiability) capture the effect of the type of the gth group of questions, after correcting for age and the remaining fully observed covariates.
4. Data augmentation and parameter estimation
Parameter θ = (α, β, γ, h0) can be computed by an E-M-type algorithm [14, 17]. This algorithm reduces to the iterative evaluation of a set of weighted score equations, alternated with weights updating, and can be conveniently illustrated by using the counting process notation. Using this notation, the information contained in (ei, yi, δi) is represented by the bivariate process (Ni(t), Ri(t)), where the death process Ni(t) = 1 if the subject dies at or before time t and 0 otherwise, while the risk process Ri(t) = 1 if the subject is in the study at time t and 0 otherwise.
At each step of the iteration, the estimate θ̂ available from the previous iteration is exploited to compute the predictive distribution of the missing MMSE scores in the ith case (E-step), namely
| (11) |
Given γ̂, the probabilities pi(zi∣γ̂) must be approximated numerically, by exploiting, for example, standard quadrature techniques, because the integral in (9) cannot be computed in an analytical closed form. Parameter estimates are then updated (M-step) by solving the following set of weighted likelihood score equations
| (12) |
where
while
The first two components of (12) are the K + 1 score equations suggested by Herring and Ibrahim ([17]; eq. 3.2) to update the parameters of a Cox model with missing covariates. These equations provide an updated estimate β̃ that can be exploited in ui(h0∣D(zi)) to update the baseline hazard and computing a new Breslow's estimate H̃0 of the cumulative hazard [24]. The last two components of (12) separately provide us with the updated estimates α̃ and γ̃. To obtain γ̃, likelihood contributions Li(γ∣zM(i)) must be approximated numerically exploiting standard quadrature techniques. Estimate θ̃ = (β̃, H̃0, α̃, β̃) is then used to update the weighting schemes (11). The algorithm is iterated up to convergence of the estimates.
Significant simplifications arise in the practical implementation of this algorithm, under the parsimonious specification considered in this paper. Under the modelling assumption (5), (7) and (9), the predictive weights depend on zi only through the vector of the G partial scores and the vector of the G unobserved scores , as follows
where j = (j1 … jG). As a result, the last two components of the score vector (12) reduce to
| (13) |
where . The roots of the equation above can be computed by separately fitting a binomial regression model and a mixed logistic regression model on an augmented dataset D1, obtained by including all the subjects with no missing items, each weighted by w = 1, and replacing each partial respondent i with pseudo-profiles, each given a total MMSE score and a case weight wi(j1 … jG; θ͂).
The first two components of (12) reduce to
| (14) |
where
Estimates β̃ can be hence found by exploiting an augmented dataset D2, obtained by including all the subjects with an observed MMSE index D, each weighted by 1, and replacing each subject i with a missing MMSE index with two pseudo-subjects with composite index equal to 0 and 1, respectively weighted by Wi0(θ̂) and Wi1(θ̂). Finally the baseline hazard can be updated as follows:
In keeping with the well known limitations of the EM algorithm, the sequence of the estimates that results from the M-steps of the algorithm can converge to a local maximum of the likelihood surface, depending on the initial parameter estimates that must be provided for initialization. It is hence necessary to repeatedly run the algorithm for a number of initial estimates. This procedure can be quite demanding from a computational point of view if the number of nuisance parameters is large. Because the number of parameters in the model increases with the number of items groups G, the partitioning of the questionnaire in a small number of groups is preferable. Working with a small number of groups of questions is also advisable as the algorithm includes the estimation of a mixed logistic model, as in our case study. With G = 4 groups, we found that a 10-points Gauss-Hermite quadrature approximation of Li(γ∣zM(i)) is numerically stable. For larger values of G, more sophisticated approximation methods may be necessary [25]. We also remark that the size of the augmented dataset D1 increases with G, because the number of pseudo-profiles that need to be included for each subject is given by . Large values of G may therefore lead to memory limits issues. In summary, the computational complexity of the algorithm increases with the number G of groups of questions.
Standard errors of the parameters of interest can be computed on the basis of the predictive distribution of the missing MMSE index, as obtained from the estimates of the last iteration of the E-M algorithm [26]. We impute missing data by sampling values from this distribution, and obtain naive point estimates and variance estimates of the parameters. Finally, the variance of the EM estimator is obtained as a weighted sum of the mean of the imputation variances and the empirical variance of the imputation point estimates, with weights 1 and m, where m is the number of imputation used. For the CLHLS data considered in this study, stable variance estimates can be obtained with m = 50. Values of D can be imputed by sampling values from the predictive distribution of the unobserved scores within each group of questions, namely
| (15) |
where γ̂ is the point estimate of γ that is obtained at the last iteration of the algorithm.
5. Results
The structure of the missing value problem considered in this paper depends on the choice of the cut-off point d that specifies the MMSE index. Specifically, the partitioning of the questionnaire space (Figure 1) in subsamples of normal, impaired and missing cases depends on d. The outcomes of alternative estimation strategies can be therefore conveniently compared by repeating the analysis for a sequence of different cut-offs. Although the analysis could be in principle be carried out for each possible cut-off value from d = 0 to d = 23, we have chosen to present the results only for cut-offs larger than or equal to d = 10, because MMSE indexes that are based on lower cut-offs are not reliable indicators of variation in cognitive impairment. We have thus considered a battery of 14 MMSE indexes, as defined by a sequence of cut-off points (d = 10 … 23). These indexes have been then separately included among the covariates of 14 Cox models which have been estimated under a CC, MAI and LB analysis. LB estimates were obtained jointly with the estimates of the nuisance parameters of the two models (8) and (10), that are exploited by the LB method to weight partial respondents.
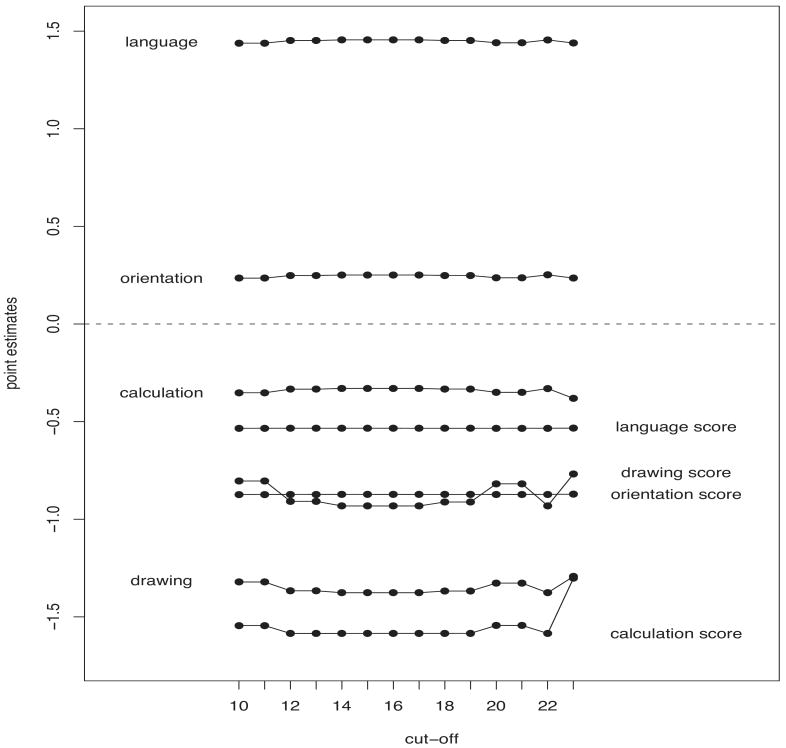
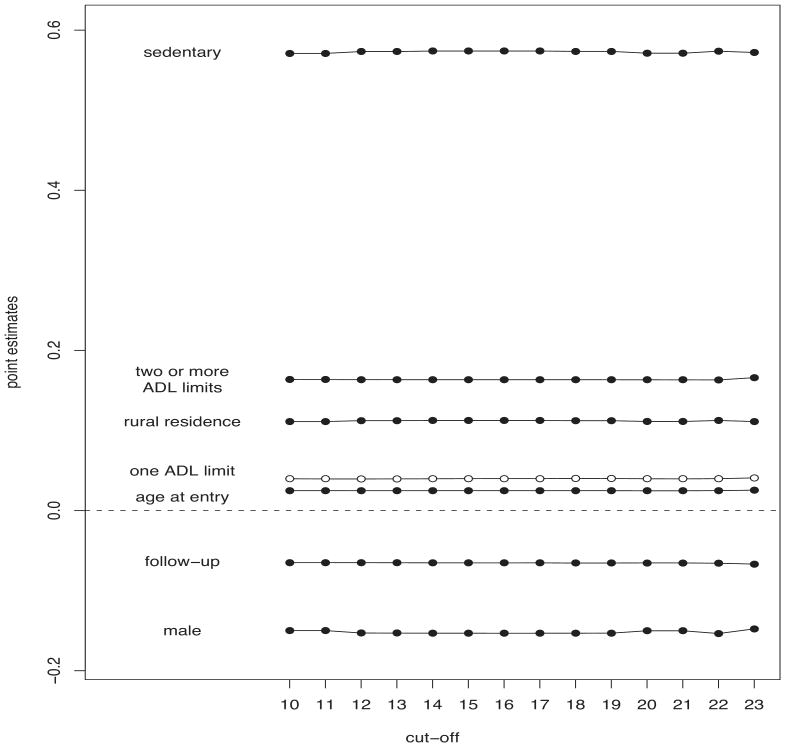
The estimates of model (8) are displayed in Figures 2 and 3. Figure 2 indicates that missing values occur more frequently among language and orientation questions than in calculation and drawing questions. The level of cognitive functioning in each of the four dimensions of the questionnaire (measured by the count of correct items in each group of questions) significantly reduces the probability of missing items, especially when calculation questions are asked to the subject. The effects displayed in Figure 3 however indicate that the occurrence of unanswered items also depends on factors that are not related to cognitive impairment. For example, partial respondents occur more frequently among sedentary subjects who live in rural areas. Strong physical disabilities (two or more ADL limits) and age at the interview increase the probability of leaving an item unanswered. Males answer the MMSE questionnaire items more often than females.
Figure 2.
Differences between question-specific log-odds of leaving a MMSE item unanswered and effects of cognitive functioning (score) in language, orientation, calculation and drawing, as estimated by a binomial regression model, for each MMSE cut-off point, under a LB estimation strategy.
Figure 3.
Effects of the fully observed covariates on a subject's probability to leave a questionnaire item unanswered, as estimated by a binomial regression model, for each MMSE cut-off point, under a LB estimation strategy. Black (white) symbols indicate significant (not significant) estimates at a .95 confidence level.
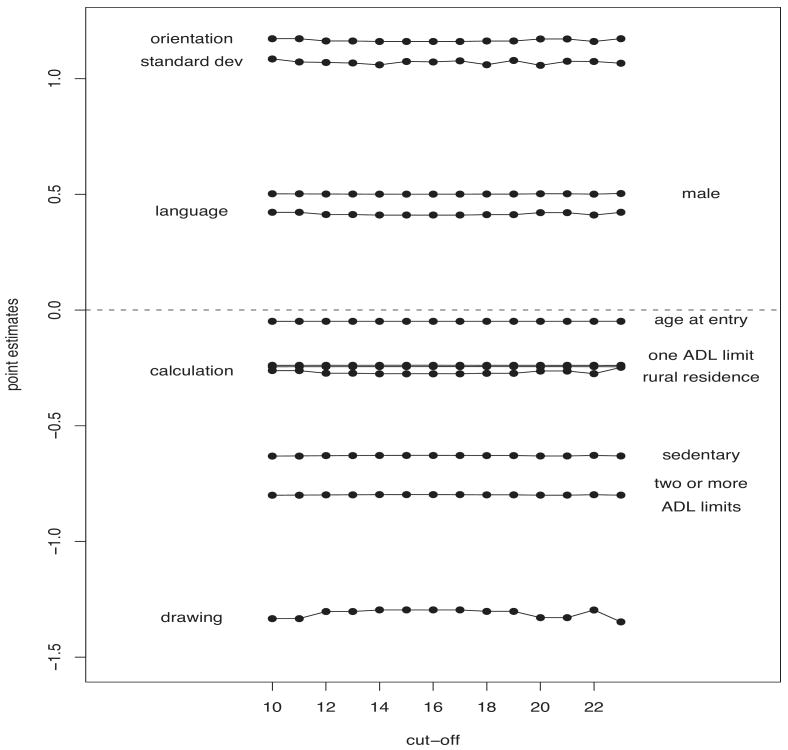
Figure 4 displays the effects on cognitive functioning (model (10)), as measured by the number of correct answers on each compound question, after adjusting for intra-subject correlation. Impairment in orientation and language occur less often than impairment in calculation and drawing. Overall, males are less cognitively impaired than females, confirming the results on gender differentials found by Zhang [23] on the same data used in this paper. In keeping with the outcomes reported by [22], urban residents are less cognitively impaired than rural residents, while physical disabilities and life styles negatively influence a subject's cognitive functioning, even after correcting for age at the interview.
Figure 4.
Effects of the fully observed covariates on cognitive functioning in orientation, language, calculation and drawing, as estimated by a mixed logistic regression model, including the random effect standard deviation, for each MMSE cut-off point, under a LB approach.
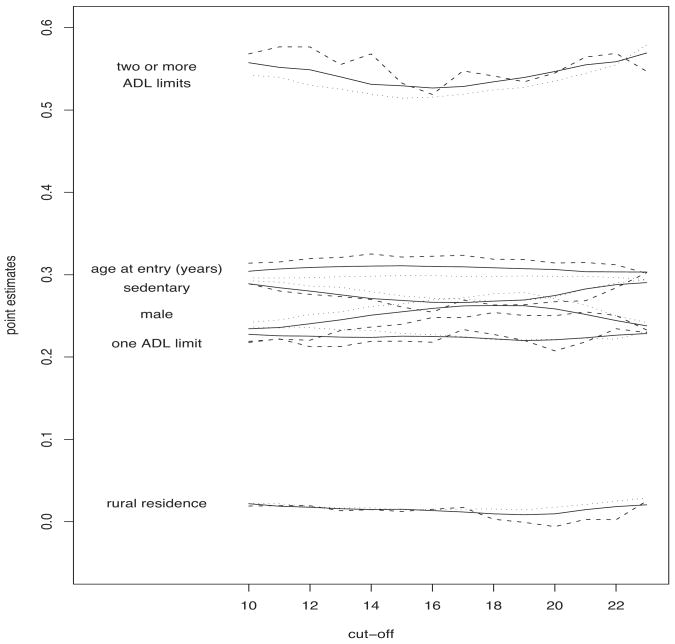
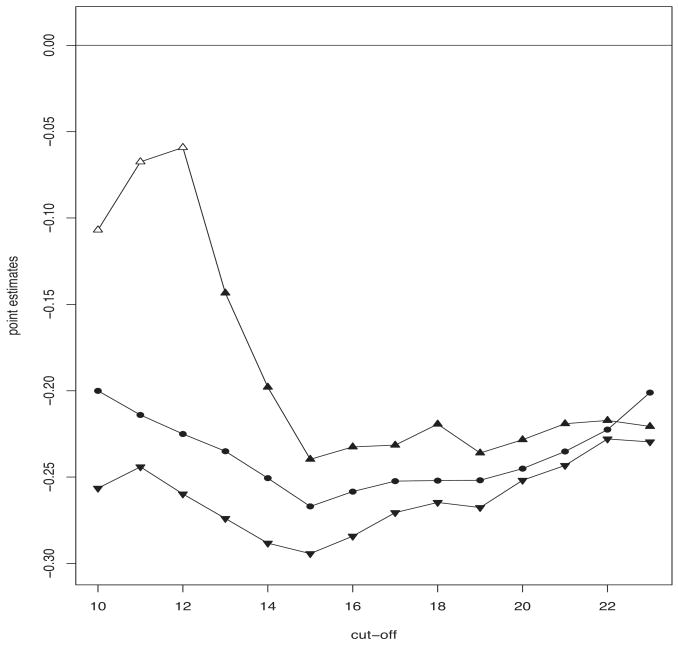
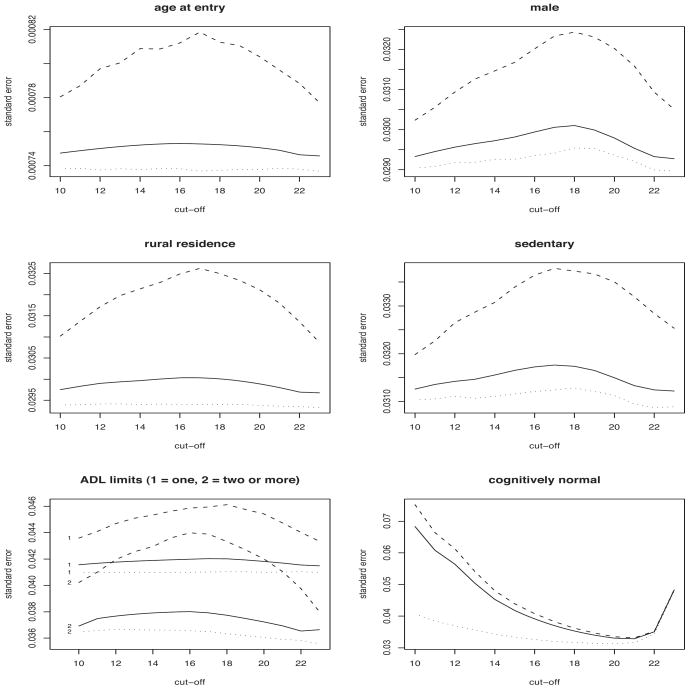
Figures 5 and 6 depict the impact of the fully observed covariates and the MMSE index on survival, as estimated by a Cox model, under the three estimation strategies (black/white symbols indicate significant/not significant estimates at a .95 confidence level), while Figure 7 displays the standard errors. With regards to the influence of the fully observed covariates, there are not substantial differences between the alternative estimation strategies. The individual physical status, as measured by ADL limits and life style, is strongly significant, while the type of residence does not seem to have a significant impact on survival. As expected, males have a significantly higher mortality risk than females. Viewed as functions of the threshold d, LB and MAI estimates appear smoother than those resulting from a CC analysis. It is possible that cut-off-specific exclusions and replacements of partial respondents affect the pattern of CC estimates.
Figure 5.
The effect of a number of covariates, as estimated by a battery of Cox models that include different definitions of the MMSE index, according to a sequence of cut-off points. Results under a MAI approach (dotted lines), a CC analysis (dashed lines) and a LB strategy (solid lines).
Figure 6.
CC (point-up triangles), MAI (point-down triangles) and LB (circles) estimates of the effect of being cognitively normal, as estimated by a battery of Cox models that include different definitions of the MMSE index, according to a sequence of cut-off points. Black (white) symbols indicate significant (not significant) estimates at a .95 confidence level.
Figure 7.
Standard errors of the estimates displayed in Figures 5 and 6, under a MAI approach (dotted lines), a CC analysis (dashed lines) and a LB strategy (solid lines).
Regardless of the estimation method and the MMSE cut-off point, the estimated effect of the MMSE index is never positive (Figure 6), indicating that, overall, the mortality risk among normal subjects is not higher than the risk experienced by impaired subjects, even after adjusting for age at entry, gender, type of residence, physical disabilities and life style. Differences between CC and MAI estimates are due to the way partial respondents are treated by the two estimation methods. Under a MAI analysis, partial respondents are treated as impaired cases if their partial MMSE score is less than the threshold d. For lower values of the cut-off point (10 ≤ d ≤ 12), most of these partial respondents are discarded by a CC analysis. When these subjects are excluded from the analysis, the significant effect of cognitive impairment, as detected by a MAI analysis, becomes not significant under a CC analysis. As the cut-off increases, partial respondents with lower MMSE scores are progressively re-placed in the sample under a CC analysis, and treated as impaired cases under both a MAI and a CC analysis. As a result, differences between MAI and CC estimates decrease. LB estimates appear as a reasonable compromise between the outcomes of the MAI and CC analysis, because they appropriately include subjects who are discarded by a CC methodology and, simultaneously, do not treat all partial respondents as cognitively impaired cases. Nevertheless, the LB estimation method essentially confirms the effects of the fully observed covariates (age, gender, type of residence, physical disabilities and life style), as estimated by pursuing a CC or a MAI procedure (Figure 5).
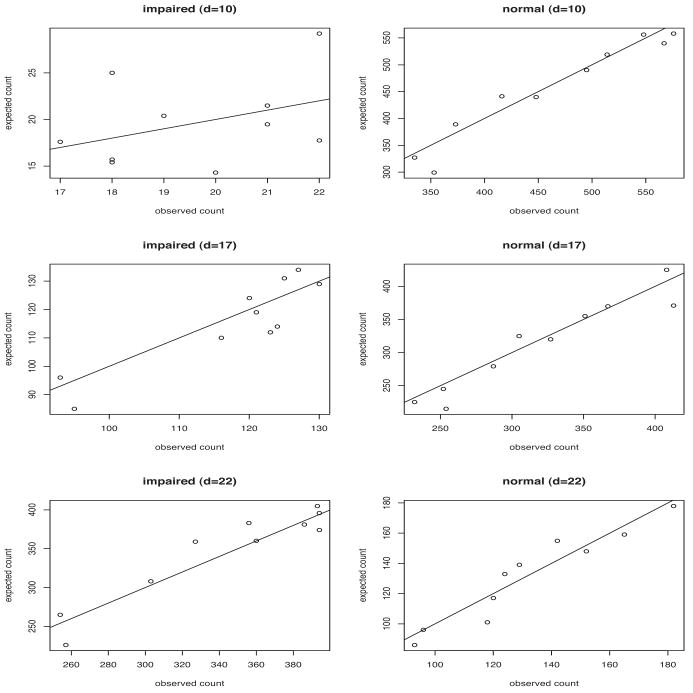
To compare the three methods, we have computed the risk score ri(β̂) of all the subjects in the lower and upper triangles of the questionnaire space, for each cut-off d. Within each triangle, we created groups of subjects based on deciles of risk and compared the observed number of deaths to the expected number of deaths, as predicted by the Cox model, under the three estimation strategies considered in this study. For brevity, Figure 8 depicts the results that were obtained under a LB approach, for the cut-off points d = 10, 17, 22.
Figure 8.
Expected versus observed counts of deaths in cognitively impaired and normal subjects, under a LB estimation strategy, for three MMSE index cut-offs d.
The three methods perform similarly on predicting survival in cognitively normal subjects. Remarkable differences however appear in the prediction of survival among impaired subjects. For the lowest cut-off (d = 10), CC (MAI) estimates tend to underestimate (overestimate) the observed counts, in contrast with the unbiased performance of the LB-based expected counts. These differences decrease for larger cut-offs, reflecting the convergence of the outcomes displayed in Figure 5. Nevertheless, differences between expected and observed counts, as obtained under a LB strategy, are always smaller than or equal to those resulting from either a CC or MAI procedure.
In summary, the MAI-based inclusion of partial respondents with low MMSE scores as impaired cases enhances the significance of the effect of the MMSE index on survival. On the other side, the exclusion of partial respondents with low MMSE scores, as operated by a CC analysis, leads to an effect of the MMSE index that is smaller than that estimated by a MAI analysis and even not significant for the lowest cut-offs. Because partial respondents leave some questionnaire items unanswered for reasons that are not only related to cognitive impairment (Figure 3), a MAI methodology tends to overestimate the effect of cognitive impairment on survival. On the other hand, a CC method tends to underestimate the effect of cognitive impairment on survival, because most of the excluded subjects experience a higher mortality risk than that experienced by those with similar scores that have been included in the analysis (Table I).
LB-based standard errors (Figure 7) of the effects of the fully observed covariates are always much smaller that those computed under a CC analysis. Differences increase with the proportion of missing values that varies with the cut-off chosen. Only in the case of the MMSE index, LB standard errors are slightly lower than those computed by a CC-based procedure. As expected, LB standard errors are always larger than those computed under a MAI analysis, regardless of the cut-off, reflecting the uncertainty about the missing MMSE scores.
6. Discussion
Motivated by a specific case study, we have presented a likelihood-based strategy to estimate the Cox model when one of the covariates is a piece-wise constant function of the total score obtained by a subject on a questionnaire, but some of the questionnaires in the sample are partially observed. We have shown that this particular missing value problem can be naturally handled by a likelihood-based approach where the survival outcome is jointly modelled with the missing value mechanism and the total score distribution. A parsimonious specification of the latter two models greatly reduces the number of nuisance parameters and the computational complexity of the estimation algorithm, through an appropriate augmentation of the observed data. The proposed LB approach enhances the outcomes that are obtained when subjects with missing values are removed from the analysis or when missing answers are counted as incorrect answers. The signs of the nuisance parameters are in keeping with the findings reported by the literature about both the relationship between cognitive impairment and physical disabilities, and the factors that are influential in the occurrence of unanswered items in a MMSE questionnaire.
Although the proposed LB methodology allows including subjects who missed completely a MMSE questionnaire, we have decided to present the results after discarding these cases from the sample. There is not a standard protocol for handling such subjects under a MAI methodology. The inclusion of fully missing questionnaires therefore makes it difficult to compare MAI and LB estimates. Moreover, it is likely that subjects who missed out completely the questionnaire were not actually examined for reasons that are not related to cognitive impairment. In this case, including these subjects in a MAI analysis with a zero MMSE score would increase the bias of the MAI estimates and make the comparison between MAI and LB estimates unfair.
The outcomes of a LB strategy depend on the explicit assumptions that have been made on the distributions of both the missing and observed data. Through this paper, we have assumed that the items within a group of questions are homogeneous. Specifically, scores on the single items were assumed to be conditionally independent, given a subject-specific random effect. The inclusion of a random effect simultaneously allows for unobserved heterogeneity between subjects and correlated scores within the questionnaire of each subject, strategically compensating for unobserved covariates (e.g., educational level) that could be influential in the measurement of cognitive functioning. On the other side, the model exploited in this study could be generalized by increasing the number G of items groups. Because more flexible models would typically involve a greater number of nuisance parameters and massive augmented datasets, we have based our analysis on G = 4 groups of questions, as a reasonable compromise between realism and parsimony. Items homogeneity within each groups of questions was also assumed in the specification of the missing value mechanism. Conditionally on cognitive impairment, we have assumed that the pattern of the unanswered items is (within each group) drawn at random by a Binomial distribution. This can be a shortcoming when factors such as fatigue or anxiety are responsible for a dependence structure between answered and unanswered items belonging to the same group. The availability of detailed information on the MMSE interview would allow to check this independence assumption and perhaps to try more complex models. On the basis of the available data, a binomial regression model parsimoniously captures the relationship between the number of missing items and the cognitive impairment experienced by a subject in orientation, language, calculation and drawing skills.
Although with these limitations, the LB estimation strategy presented here can reduce the bias and improve the efficiency of the estimates in survival analysis applications that involve composite covariates and partial respondents. In our study of the effect of mental health on survival, a LB approach allowed for a sharper validation of the Chinese MMSE index as a prognostic factor, compared to popular protocols that are based upon either the exclusion or the deterministic classification of partial respondents.
Acknowledgments
The authors are grateful to Dr. Heiner Maier and Dr. Li Qiang for their valuable suggestions. The 1998, 2000, and 2002 CLHLS waves were supported by NIA/NIH grant P01 AG 08761.
References
- 1.Folstein MF, Folstein SE, McHugh PR. ‘Mini-mental state’: A practical method for grading the cognitive state of patients for the clinician. Journal of Psychiatry Research. 1975;12:189–198. doi: 10.1016/0022-3956(75)90026-6. [DOI] [PubMed] [Google Scholar]
- 2.Cox DR. Regression Models and Life-Tables (with discussion) Journal of the Royal Statistical Society. 1972;B34:187–220. [Google Scholar]
- 3.Frisoni GB, Fratiglioni L, Fastbom J, Viitanen M, Winblad B. Mortality in Nondemented Subjects with Cognitive Impairment: The Influence of Health-related Factors. American Journal of Epidemiology. 1999;150:1031–1044. doi: 10.1093/oxfordjournals.aje.a009927. [DOI] [PubMed] [Google Scholar]
- 4.Tilvis RS, Khnen-Vre MH, Jolkkonen J, Valvanne J, Pitkala KH, Strandberg TE. Predictors of Cognitive Decline and Mortality of Aged People Over a 10-Year Period. The Journals of Gerontology. 2004;A59:M268–M274. doi: 10.1093/gerona/59.3.m268. [DOI] [PubMed] [Google Scholar]
- 5.Lee HB, Kasper JD, Shore AD, Yokley JL, Black BS, Rabins PV. Level of Cognitive Impairment Predicts Mortality in High-Risk Community Samples: The Memory and Medical Care Study. Journal of Neuropsychiatry and Clinical Neurosciences. 2006;18:543–546. doi: 10.1176/jnp.2006.18.4.543. [DOI] [PubMed] [Google Scholar]
- 6.Lopez MN, Charter RA, Mostafavi B, Nibut LP, Smith WE. Psychometric Properties of the Folstein Mini-Mental State Examination. Assessment. 2005;12:137–144. doi: 10.1177/1073191105275412. [DOI] [PubMed] [Google Scholar]
- 7.Crum RM, Anthony JC, Bassett SS, Folstein MF. Population-based norms for the Mini-Mental State Examination by age and educational level. Journal of the American Medical Association. 1993;269:2386–2391. [PubMed] [Google Scholar]
- 8.Dodge HH, et al. Cross-cultural comparisons of the Mini-mental State Examination between Japanese and US cohorts. International Psychogeriatrics. 2009;21:113–122. doi: 10.1017/S1041610208007886. [DOI] [PMC free article] [PubMed] [Google Scholar]
- 9.Bassuk SS, et al. Cognitive Impairment and Mortality in the Community-dwelling Elderly. American Journal of Epidemiology. 2000;151:676–688. doi: 10.1093/oxfordjournals.aje.a010262. [DOI] [PubMed] [Google Scholar]
- 10.Zhang Z, et al. Early-life Influences on cognitive impairment among Chinese oldest-old. Journal of Gerontology: Social Sciences. 2008;63B:S25–S33. doi: 10.1093/geronb/63.1.s25. [DOI] [PubMed] [Google Scholar]
- 11.Zimmer Z. Health and living arrangement transitions among China's oldest-old. Research on Aging. 2005;27:526–555. [Google Scholar]
- 12.Rubin DB. Inference and Missing Data. Biometrika. 1976;63:81–92. [Google Scholar]
- 13.Ibrahim JG, Chen MH, Lipsits SR, Herring A. Missing-Data Methods for Generalized Linear Models: A Comparative Review. Journal of the American Statistical Association. 2005;100:332–346. [Google Scholar]
- 14.Herring AH, Ibrahim JG, Lipsitz SR. Non-ignorable missing covariate data in survival analysis: a case-study of an International Breast Cancer Study Group trial. Applied Statistics. 2004;53:293–310. [Google Scholar]
- 15.White IR, Royston P. Imputing missing covariate values for the Cox model. Statistics in Medicine. 2009;28:1982–1998. doi: 10.1002/sim.3618. [DOI] [PMC free article] [PubMed] [Google Scholar]
- 16.Zeng Y, Vaupel JW. Functional Capacity and Self-Evaluation of Health and Life of Oldest Old in China. Journal of Social Issues. 2002;58:733–748. [Google Scholar]
- 17.Herring AH, Ibrahim JG. Likelihood-based Methods for Missing Covariates in the Cox Proportional Hazards Model. Journal of the American Statistical Association. 2001;96:292–302. [Google Scholar]
- 18.Ibrahim JG, Lipsitz SR. Parameter estimation from incomplete data in binomial regression when the missing data mechanism is nonignorable. Biometrics. 1996;52:1071–1078. [PubMed] [Google Scholar]
- 19.Herzog AR, Wallace RB. Measures of cognitive functioning in the AHEAD Study. Journals of Gerontology: Psycological Sciences and Social Sciences. 1997;52B:37–48. doi: 10.1093/geronb/52b.special_issue.37. [DOI] [PubMed] [Google Scholar]
- 20.Hayward MD, Gorman BK. The Long arm of childhood: the influence of early-life social conditions on men's mortality. Demography. 2004;41:87–107. doi: 10.1353/dem.2004.0005. [DOI] [PubMed] [Google Scholar]
- 21.Zimmer Z, Martin LG, Chang MC. Changes in functional limitation and survival among older Taiwanese, 1993, 1996, and 1999. Population Studies. 2002;56:265–276. doi: 10.1080/00324720215931. [DOI] [PubMed] [Google Scholar]
- 22.Gu D, Qiu L. Cognitive functioning and its determinants among the oldest-old in China. Journal of Nanjng College for Population and Management. 2003;2:3–9. [Google Scholar]
- 23.Zhang Z. Gender differentials in cognitive impairment and decline in the oldest old in China. Journal of Gerontology: Social Sciences. 2006;61B:S107–S115. doi: 10.1093/geronb/61.2.s107. [DOI] [PubMed] [Google Scholar]
- 24.Breslow N. Covariance Analysis of Censored Survival Data. Biometrics. 1974;30:89–99. [PubMed] [Google Scholar]
- 25.Rabe-Hesketh S, Skrondal A. Reliable estimation of generalized linear mixed models using adaptive quadrature. The Stata Journal. 2002;2:1–21. [Google Scholar]
- 26.Goetghebeur E, Ryan L. Semiparametric regression analysis of interval-censored data. Biometrics. 2000;56:1139–1144. doi: 10.1111/j.0006-341x.2000.01139.x. [DOI] [PubMed] [Google Scholar]
- 27.Zeng Y, et al. Sociodemographic and Health Profiles of the Oldest Old in China. Population and Development Review. 2002;28:251–273. [Google Scholar]


