

Abstract
Prostatic acid phosphatase (PAP) is expressed in nociceptive neurons and functions as an ectonucleotidase. Injection of the secretory isoform of PAP has potent antinociceptive effects in mouse models of chronic pain. These data suggested that a small molecule activator of PAP may have utility as a novel therapeutic for chronic pain, while inhibitors could be used to acutely inhibit PAP in vitro and in vivo. To identify small molecule modulators of PAP activity, we validated a high throughput, fluorescence-based biochemical assay and then used this assay to screen a compound library. We decreased the frequency of false positive activators by subtracting compound fluorescence from the final assay fluorescence. This approach significantly reduced the number of false positive activators found in the screen. While no activators were confirmed, seven novel inhibitors of PAP were identified. Our results suggest this high throughput assay could be used to identify small molecule modulators of PAP activity.
INTRODUCTION
Recently, we found that Prostatic Acid Phosphatase (PAP, also known as ACPP, EC 3.1.3.2) was expressed in nociceptive neurons and functioned as an ectonucleotidase, generating adenosine from adenosine monophosphate (AMP) [1, 2]. PAP knockout mice displayed enhanced nociceptive responses in models of chronic inflammatory and neuropathic pain. Conversely, intrathecal injection of purified PAP protein had antinociceptive effects that lasted three days and were dependent on A1-adenosine receptor activation. These data suggested it might be possible to mimic the antinociceptive effects of PAP by identifying small-molecules that allosterically activate PAP in nociceptive neurons. Currently, no small molecule activators of PAP exist.
In addition, there are no small molecules that selectively and potently inhibit PAP. While non-selective inhibitors like L-(+)-tartrate exist, these molecules inhibit other acid phosphatases [3]. The only other known PAP inhibitor, α-benzylaminobenzylphosphonic acid (BABPA), has a much lower IC50, in the nanomolar range [4, 5]. BABPA has not been extensively studied and may lack selectivity because it is a derivative of benzylphosphonic acid (BPA). BPAs were originally designed to inhibit protein tyrosine phosphatases (PTP), including those found in mitochondria [6], fibroblasts [7] and endothelial cells [8]. BPAs also inhibit PAP [5].
The crystal structures of human and rat PAP are available [9-11] and could be used to rationally design inhibitors. However, a high throughput screen is needed to provide an unbiased approach to identify allosteric activators and inhibitors. Predicting a small molecule activator without knowing a potential docking site and mechanism would be very challenging.
A PAP activity assay using the fluorigenic substrate difluoro-4-methylumbelliferyl phosphate (DiFMUP) has been reported [12]. In this assay, the non-fluorescent DiFMUP is dephosphoylated by PAP converting it to 6,8-difluoro-4-methylumbelliferone, a highly fluorescent molecule. In this report, we describe the validation of a high throughput version of this PAP activity assay for the discovery of small molecule modulators of PAP activity. This assay was also used to screen a chemical library in search of activators and inhibitors of PAP. Small molecule activators of PAP may have use as research tools and/or serve as leads for novel antinociceptive therapeutic agents. Potent and selective inhibitors of PAP could be useful as research tools in exploring the biological function of PAP.
MATERIALS AND METHODOLOGY
Reagents
All common reagents such as HEPES, EDTA, fatty acid-free bovine serum albumin (BSA), sodium L-(+)-tartrate, dimethyl formamide (DMF) and dimethyl sulfoxide (DMSO) were reagent-grade quality obtained from Thermo Fisher Scientific (Waltham, MA) or Sigma-Aldrich (St. Louis, MO). Purified human PAP (catalog # P1774) was obtained from Sigma-Aldrich. Difluoro-4-methylumbelliferyl phosphate (DiFMUP) was obtained from Invitrogen (cat # D22065). The solid black 384-well plates (cat# 3573) for the assay were from Corning Incorporated (Corning, NY). The Prestwick Chemical Library was obtained from Prestwick Chemical (Washington DC). The compounds for screening and IC50 determinations were obtained from the Asinex Corporation (Moscow, Russia).
PAP Assay
The PAP assay was performed by the addition of 0.5 μl of compound (or DMSO) to the well of a black 384-well plate followed by the addition of 25 μl of diluted PAP enzyme. After addition of enzyme, the compound fluorescence (background) was measured using a Victor V (Perkin Elmer) fluorescence plate reader. The fluorescence was measured using the 355 nm excitation filter and 460 nm emission filter (the ubelliferone filter set). Read time was 0.1 s/well. Following this “pre-read”, the reaction was initiated by addition of 25 μl of diluted DiFMUP substrate. DiFMUP stock solutions were made in the solvent DMF. PAP and DiFMUP were diluted with assay buffer consisting of 50 mM HEPES pH 7.0, 1 mM EDTA, and 100 ug/ml fatty acid-free BSA. Following the initiation of the reaction with DiFMUP, the plates were incubated for one hour at 23ºC followed by the addition of 25 μl of a 180 mM sodium L-(+)-tartrate solution (in water) to stop the reaction. The PAP, DiFMUP, and stop solutions were delivered to the plate using the MultidropTM liquid handler (Thermo). The plate was then read in the Victor V plate reader as before. Specific fluorescence due to DiFMUP hydrolysis was obtained by subtracting the background relative fluorescence units (RFU) from the RFUs measured in the final plate read. These adjusted values were used for all percent inhibition/activation calculations, except where comparison data is shown. Error bars for data points represent standard deviations. Z’-factor values were derived by the published formula with Z’-factors of 0.5 – 1.0 indicating that an assay is robust for screening [13].
High Throughput Screen
For the high throughput screening of the Asinex chemical library, 0.5 μl of 1 mM compound in 100% DMSO was added to dry 384-well plates using a Biomek NX (Beckman Coulter Inc., Fullerton, CA), resulting in a final compound concentration of 10 μM for the primary screen. This dry spotting of compounds into assay plates was performed as a routine HTS method of conserving compound stock solutions. This spotting method has been validated for transfer of 0.5 μl DMSO with a CV of 6.3% and relative inaccuracy of -2.0%. Final assay concentrations in the 50 μl enzyme reaction were 5.5 mU/ml PAP (activity as defined by Sigma), 59 μM DiFMUP, 10 µM compound, 1% DMSO (from compound), 0.6% DMF (from DiFMUP stock solution) and assay buffer. For the screening, each plate had 2x, max and min controls with DMSO spotted in the wells. Maximum (max) signal positive control wells contained only DMSO (no compound), while the minimum (min) signal control wells were obtained by adding assay buffer instead of PAP. L-(+)-tartrate would not dissolve in DMSO or water at a high enough concentration to generate the min controls. Since the RFUs obtained with high concentrations of L-(+)-tartrate were the same as wells without enzyme, we just added buffer without enzyme to create the min control wells. The 2x activation control wells received twice the concentration of PAP. The percent inhibition was calculated according to the following formula using background subtracted RFU data:
The absolute value of negative inhibition values denotes percent activation. The definition of a hit was a compound that displayed 50% inhibition in the primary screen or 50% activation (-50% inhibition) with the 2x control being 100% activation (-100% inhibition). IC50 value was defined as the concentration of inhibitor calculated to inhibit 50 % of the assay signal based on a serial dilution of compound. Values were calculated using either a four or three-parameter dose response (variable slope) equation in Graphpad Prism or ActivityBase (IDBS, Alameda, CA). For the IC50 determinations, serial dilutions of compounds were performed in 100% DMSO with a two-fold dilution scheme resulting in 10 concentrations of compound starting at a high concentration of 20 μM compound in the final assay. For the HTS assay, these compound dilutions were spotted onto plates and the assay performed at 1% DMSO final concentration as described for the primary screen.
RESULTS
PAP activity can readily be measured using the substrate DiFMUP (12 and EnzChekTM Acid Phosphatase Assay Kit, Invitrogen). This substrate has the advantage over the older 4-methylumbelliferone phosphate in that it provides sensitive detection of PAP activity at acidic as well as neutral pH [12]. We used this substrate to detect PAP activity in an end point assay which is amenable for high throughput screening. Enzyme assays were performed at pH 7.0 to more closely mimic extracellular pH where the active site of PAP is localized. The assay was developed with a final volume of 50 µl using the 384-well plate format to match the intended screening format. The general assay set-up included the addition of diluted PAP to the well followed by the addition of DiFMUP to initiate the reaction. The reaction was terminated with sodium L-(+)-tartrate and the fluorescence determined in a plate reader. PAP and DiFMUP were both diluted with assay buffer (50 mM HEPES pH 7.0, 1 mM EDTA, 100 ug/ml BSA). The Km for DiFMUP was experimentally determined to be 918 μM (data not shown). The final concentration of DiFMUP was 59 μM and therefore the assay should be sensitive to substrate competitive compounds.
The activity in the assay was directly proportional to the concentration of PAP, up to at least 22 mU/ml (Fig. 1). We chose to use 5.5 mU/ml as the final concentration in the assay to provide a robust assay window.
Fig. (1).

PAP enzyme titration. PAP was titrated into the assay under final assay conditions with an incubation time of one hour in the presence of 1% DMSO. Data points represent the average of two determinations per concentration and error bars represent standard deviations. Data are representative of three independent experiments.
The chosen concentration of enzyme resulted in a linear time course using this assay for at least 90 minutes under final assay conditions in the presence of 1% DMSO (Fig. 2). The enzyme titration and time course data suggested that the assay conditions should be sensitive to compounds that are either inhibitors and activators of PAP activity.
Fig. (2).

PAP assay time course. A time course study was performed under final assay conditions in the presence of 1% DMSO. Data points represent the average of two determinations per time point and error bars represent standard deviations. Data are representative of three independent experiments.
Since the compounds to be screened were dissolved in DMSO, the tolerance for DMSO was examined at various DMSO concentrations (Fig. 3). The assay was shown to be tolerant to DMSO concentrations up to at least 2.5%. In the final screening assay, the maximal concentration that the enzyme is exposed to is 2% DMSO before the addition of substrate.
Fig. (3).

DMSO tolerance of PAP assay. The indicated concentrations of DMSO were tested in the PAP assay. Data points represent the average of three determinations per concentration and error bars represent standard deviations. Data are representative of three independent experiments.
The variability of the assay was characterized in a 384-well plate format. The HTS version of the assay employed work station level automated liquid handling system using the Biomek NX for delivery of compound or DMSO (0.5 µl) to the plate followed by addition of PAP (25 μl), DiFMUP (25 μl) and L-(+)-tartrate stop solution (25 μl), in that order, using the MultidropTM (Thermo). IC50 values for sodium L-(+)-tartrate were determined using the HTS protocol, including use of the liquid handler (Fig. 4). The IC50 values obtained were 53 and 40 μM for two separate determinations. These values are in close agreement with the published IC50 value of 29 μM [14]. The Hill slopes were 0.96 and 0.89, very close to the expected value of 1.0 for inhibition of a single enzyme. Thus, reproducible IC50 values can be obtained using the automated version of the PAP assay.
Fig. (4).

L-(+)-tartrate IC50 value determination using the automated PAP assay. Data points represent the average of five determinations per concentration and error bars represent standard deviations. Data are representative of two independent experiments.
To assess single-point variability of the assay with full automation, all wells of a 384-well plate were pre-spotted with 0.5 μl of DMSO (Fig. 5). The pre-spotted DMSO plates simulated compound plates that were to be screened. The desired screen was one that could detect both activators and inhibitors of PAP. Therefore, two plates for each condition were used to determine the maximum (max) signal, minimum (min) signal and a 2x enzyme concentration to mimic 2x activation of enzymatic activity. The variability for inhibition was determined using the max and min plates while the activation window was determined based on the max and 2x plates. The %CV of the max and 2x plates were 5.4 and 4.4%, respectively, while the %CV for the min plates was 11.8%. The Z’-factor for the inhibition assay window was 0.83 and for the activation assay window it was 0.60. Thus, the assay was highly robust with good variability amenable for high throughput screening for both activators and inhibitors of PAP activity.
Fig. (5).

PAP assay variability assessment. All wells of a 384-well plate were pre-spotted with 0.5 µl of DMSO. Two plates each were used to determine the maximum signal (middle), minimum signal (bottom), and a 2x enzyme concentration (top). The Z’-factors for the inhibition assay window (max/min) and the activation assay window (max/2x) are shown.
As part of assay validation, a small collection of 1,120 compounds purchased from the Prestwick Chemical company was screened to assess the performance of the assay in the presence of diverse compounds using the HTS protocol. On initial testing of this library, several compounds appeared to be activators based on the controls, but their authenticity was suspect due to their high RFU values. The contribution of compound fluorescence to the final measured fluorescence at the end of the assay was determined by reading fluorescence before addition of DiFMUP and comparing the RFUs obtained at the end of the assay (data not shown and Fig. 6). This analysis suggested that compound fluorescence interference could be reduced by subtracting “pre-read” values from final fluorescence values. Therefore, we modified the assay protocol to include determining the fluorescence due to the compound by reading the fluorescence of the wells before addition of DiFMUP. This value was subtracted from the final read value before determining activity based on the controls (which were also background subtracted this way). The Prestwick collection of compounds was screened at 10 μM compound concentration and the data analyzed with and without the background subtraction adjustment to the percent inhibition data (Fig. 6). Negative percent inhibition values indicate activation e.g. a -100% value represents a 100% increase in RFU value or two-fold higher activity than max control. For this assay, the inhibitor and activator cut-offs were defined as 50% and -50% calculated inhibition values, respectively. Without background subtraction, there were 10 apparent activators with % inhibition values ranging from -50 to -428%.
Fig. (6).

Screen of the Prestwick collection with the PAP assay. Each point represents a compound. The percent inhibition values were calculated without (A) and with (B) background subtraction.
After background subtraction was applied to the data, there was only one activator identified. This compound generated the highest activation, 428% without background subtraction, and after subtraction was reduced to 63% activation. This compound had very high fluorescence and was deemed a false positive. This molecule was triamterene, a drug known to be highly fluorescent using the wavelengths employed for this assay [15]. This data demonstrated that the background subtraction method reduced the number of false positive activators by ten-fold, though compounds with very high fluorescence can still appear as an activator. It should be noted that there was a modest inhibitor (61%) whose % inhibition value was unchanged by the background subtraction. Therefore, we changed the HTS protocol to include this background read and subtraction method to reduce the number of false positive activators. The Z’-factors of the controls for each of the four plates were all ≥0.78 for both the inhibition and the activation assay windows.
A diverse collection of 28,800 small organic molecules purchased from Asinex Corporation were screened for PAP activation or inhibition (Fig. 7). In a retrospective study, the data was analyzed without and with background subtraction. Without background subtraction, there were 166 apparent activators compared to 36 using background subtraction. Hence, the background subtraction method resulted in a nearly 5-fold reduction in false positive activators. In addition to these initial activators, 18 inhibitors were identified during the screen. Thus, the active rates were 0.06% and 0.13% for inhibition and activation, respectively. The plate Z’-factors for the screen were all >0.70 for the inhibition window and >0.50 for the activation window.
Fig. (7).

High throughput screening of a chemical library. The same single point screening data is shown in scattergrams without background subtraction (A) and with background subtraction (B) showing percent inhibition for each compound tested. Activation values result in negative percent inhibition values.
The activators were triaged by manual inspection of the raw fluorescence data. After this manual inspection, 26 activators that had pre-read values of >1,000-fold above controls were eliminated and 10 activators were re-tested in IC50 format where none of them confirmed activity. Consistent with the lack of confirmation, all but two of these activators had pre-read fluorescence values above control wells.
In contrast to the activator hits, 7 of the 18 inhibitor hits confirmed activity in IC50 determinations, ranging from 2.0 to 19 µM (Table 1). The concentration response data used to calculate IC50 values for hit compounds 1 and 2 are provided as representative curves (Fig. 8). Examination of the structures of these inhibitors indicated that three of them (compounds 2, 3, and 5) have the same core scaffold consisting of 6-hydroxy-5-nitropyrimidin-4(3H)-one. Compounds 4 and 6 are both carboxylic acids. Compound 1, with a 2 μM IC50 value, was over 20-fold more potent than the L-(+)-tartrate control compound. Thus, this PAP assay was successful in finding inhibitors of PAP activity.
Table 1.
Activities of Confirmed Inhibitors from Chemical Library using PAP Assay
| Compound | Asinex Identifiera | Structure | IC50 (µM)b |
|---|---|---|---|
| 1 | BAS 07119722 | 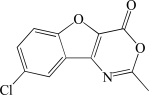 |
2.0 |
| 2 | BAS 08865249 |  |
6.7 |
| 3 | BAS 08863852 | 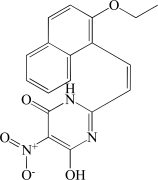 |
6.9 |
| 4 | BAS 03013122 | 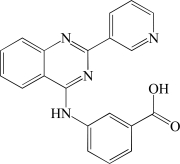 |
8.0 |
| 5 | BAS 08862870 | 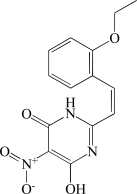 |
13.8 |
| 6 | BAS 02830262 | 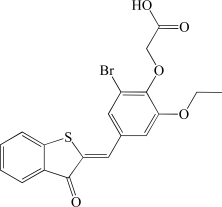 |
15.4 |
| 7 | BAS 00669251 | 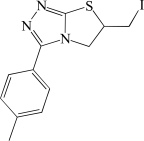 |
19.3 |
Chemical identifier number provided by Asinex Corporation.
For IC50 determinations, serial dilutions of compounds were tested starting at a high concentration of 20 µM.
Fig. (8).

IC50 value determination for compounds 1 and 2. Compounds were serially diluted in 100% DMSO then transferred to assay plates for the PAP activity assay. Concentration response curves are shown for compounds 1 (■) and 2 (▲).
DISCUSSION
PAP has been intensively studied for 70 years in the prostate cancer field. Recent work has found that PAP functions as an ectonucleotidase in nociceptive neurons [2]. Intraspinal injections of PAP produces antinociceptive, antihyperalgesic and antiallodynic effects that last longer than morphine in mouse models of chronic pain, including chronic inflammatory and neuropathic pain. These antinociceptive effects are due to dephosphorylation of extracellular AMP by PAP to produce adenosine which subsequently activates A1-adenosine receptors on nociceptive neurons and in the spinal cord. These data have led to the hypothesis that small molecules that enhance endogenous PAP activity may have potential therapeutic value in treating chronic pain conditions. In addition, potent and selective inhibitors could be useful research tools for in vivo and in vitro experiments.
In this report, we have validated a PAP high throughput assay to identify inhibitors and activators of PAP activity and used it to screen a diverse library of 28,800 small molecules. The assay signal was shown to increase in a linear fashion with enzyme concentration and time. The assay was also tolerant up to at least 2.5% DMSO. As part of the validation, the control inhibitor sodium L-(+)-tartrate was used to determine IC50 values using the final HTS assay with automation. The IC50 values obtained were consistent between experiments, with the individual values within 15% of the mean. Whole 384-well plate variability studies using pre-spotted DMSO plates and automation were done to assess the variability in detection of both inhibitors and activators with the same assay. The results generated Z’-factors of 0.60 for the activation assay window and 0.83 for the inhibition assay window, indicating a robust assay for detection of both types of hits.
As is typical for HTS validation, we screened a small set of compounds (the Prestwick collection) using high throughput methodology, to assess the performance of the assay in the presence of diverse compounds. These set of four plates resulted in Z’-factors of ≥0.78 for both the activation and inhibition window. In initial data analysis, it was apparent that a number of fluorescent compounds were affecting the signal and appearing as activators. Therefore, we tested the effect of subtracting compound fluorescence (background) for each compound. Compound fluorescence was estimated by reading the assay plate before the addition of substrate. There was a volume difference between reads where the compound was in 25 μl in the pre-read and 75 μl for the final read. Although the concentration of compound is three-fold higher in the pre-read, there is three-fold more volume of compound detected by the plate reader in the final read. Thus, it may be expected that the volume difference, by itself, may not preclude this type of background subtraction. In practice, the background fluorescence subtraction method usually reduced the net signal obtained from fluorescent compounds to similar values as the max controls (no activity). This is evident in large scale in the comparison of the Prestwick screening with and without background subtraction where the number of apparent activator hits was reduced from 10 to 1 using background subtraction. At even larger scale, the screening of 28,800 compounds, compound fluorescence subtraction led to the reduction of apparent activators from 166 to 36. The pre-read data also allowed manual triage of the 36 down to 10 by eliminating those that had extraordinarily high pre-read fluorescence.
It is also apparent from our data that this subtraction method is not 100% reliable. In both the Prestwick set screening and the full scale HTS, clearly fluorescent compounds still appeared as activators. For instance, in the Prestwick set, a known fluorescent diuretic drug, triamterene, was still not “subtracted-out” completely as an activator. The inner filter effect observed for many fluorophores at high concentration is a well known phenomenon. The inner filter effect occurs when a fluorophore self-absorbs some of the emitted light resulting in signal non-linearity with fluorophore concentration. This only occurs at a significant degree at high (micromolar) concentrations. We speculate that compounds like triamterene self-quench at high concentration, as occurs in the pre-read where the compound concentration is 20 µM. When the compound is diluted, as in the final read, total compound fluorescence will be higher due to reduced self-quenching. This explanation is also feasible for the lack of confirmation of apparent activator hits from the screen since almost all of them (8 out of 10) had significant pre-read fluorescence.
In sum, the background fluorescence subtraction method for the PAP assay significantly reduced the false positive activators, but did not eliminate them. The advantage of this method over just eliminating all fluorescent compounds is that genuine activators that happen to also be weakly fluorescent would not be lost. Also, the complete elimination of fluorescent compounds requires one to establish a cut-off for what is fluorescent and what is not considered fluorescent. Kinetic assays are another method for eliminating fluorescence interference by establishing a background in the first read and measuring the change in fluorescence. However, highly fluorescent compounds are still problematic for kinetic assays since velocity will be less reliable due to high background. In addition, kinetic assays are typically not as high throughput as end point assays, which is why we chose an end point format. Also, not all high throughput assays can be readily converted to kinetic assays due to slow kinetics or a requirement for a development step in order to generate signal.
In contrast to the activator results, seven novel inhibitors of PAP were identified. The most potent inhibitor had an IC50 of 2 µM. Thus, this compound is over 20-fold more potent than the classically used L-(+)-tartrate. Three of the actives had the same core scaffold. Five of the seven compounds had negatively-charged nitro or carboxylic acid groups. It is tempting to speculate that these groups may function as phosphate mimetics in inhibiting the active site of PAP. The specificity of these PAP inhibitors is under investigation.
CONCLUSIONS
We have validated a high throughput assay for the discovery of small molecule modulators of PAP activity. Whole plate and IC50 variability studies confirmed the robustness of this assay for high throughput screening. Subtraction of compound fluorescence from the total fluorescence of each reaction was a useful technique to reduce, but not eliminate, false positive activator hits due to compound fluorescence contribution to signal. A chemical library was screened resulting in no confirmed activators, but 7 confirmed inhibitors. The most potent inhibitor had an IC50 of 2 μM which is 20-fold more potent than the known inhibitor L-(+)-tartrate. These compounds may be useful as starting points in the development of a chemical probe for PAP. Taken together, the PAP assay described herein is amenable for the discovery of activators and inhibitors of PAP.
ACKNOWLEDGEMENTS
The authors would like to thank Mark A. Hughes, Ginger Smith and Jonathan Z. Sexton for their assistance in performing the high throughput screen and database mining. This work was supported in part by a grant from the Golden LEAF Foundation and funds from the State of North Carolina and grants to M.J.Z. from The Sloan Foundation, The Searle Scholars Program, The Klingenstein Foundation, The Whitehall Foundation, Rita Allen Foundation and NINDS (R01NS060725).
REFERENCES
- 1.Sowa NA, Vadakkan KI, Zylka MJ. Recombinant mouse PAP has pH-dependent ectonucleotidase activity and acts through A(1)-adenosine receptors to mediate antinociception. PLoS ONE. 2009;4:e42–8. doi: 10.1371/journal.pone.0004248. [DOI] [PMC free article] [PubMed] [Google Scholar]
- 2.Zylka MJ, Sowa NA, Taylor-Blake B, et al. Prostatic acid phosphatase is an ectonucleotidase and suppresses pain by gen-erating adenosine. Neuron. 2008;60:111–22. doi: 10.1016/j.neuron.2008.08.024. [DOI] [PMC free article] [PubMed] [Google Scholar]
- 3.Kaija H, Patrikainen LOT, Alatalo SL, Vaananen HK, Vihko PT. Acid Phosphatases. In: Seibel MJ, Robins SP, Bilezikian JP, editors. Dynamics of Bone and Cartilage Metabolism. London: Academic press; 2006. pp. 165–180. [Google Scholar]
- 4.Beers SA, Schwender CF, Loughney DA, Malloy E, Demarest K, Jordan J. Phosphatase inhibitors - III. Benzylaminophosphonic acids as potent inhibitors of human prostatic acid phosphatase. Bioorg Med Chem. 1996;4:1693–701. doi: 10.1016/0968-0896(96)00186-1. [DOI] [PubMed] [Google Scholar]
- 5.Schwender CF, Beers SA, Malloy E, et al. Benzylphosphonic acid inhibitors of human prostatic acid phosphatase. Bioorg Med Chem Lett. 1996;6:311–14. doi: 10.1016/0968-0896(96)00186-1. [DOI] [PubMed] [Google Scholar]
- 6.Poderoso C, Maciel FC, Gorostizaga A, Bey P, Paz C, Podesta EJ. The obligatory action of protein tyrosine phosphatases in ACTH-stimulated steroidogenesis is exerted at the level of StAR protein. Endocr Res. 2002;28:413–17. doi: 10.1081/erc-120016816. [DOI] [PubMed] [Google Scholar]
- 7.Ogata Y, Nakao S, Shimizu E, et al. Tyrosine phosphorylation is involved in Ca(2+)entry in human gingival fibroblasts. Cell Biol Int. 2003;27:689–93. doi: 10.1016/s1065-6995(03)00125-2. [DOI] [PubMed] [Google Scholar]
- 8.Parfenova H, Balabanova L, Leffler CW. Posttranslational regulation of cyclooxygenase by tyrosine phosphorylation in cerebral endothelial cells. Am J Physiol. 1998;274:C72–81. doi: 10.1152/ajpcell.1998.274.1.C72. [DOI] [PubMed] [Google Scholar]
- 9.Jakob CG, Lewinski K, Kuciel R, Ostrowski W, Lebioda L. Crystal structure of human prostatic acid phosphatase. Prostate. 2000;42:211–18. doi: 10.1002/(sici)1097-0045(20000215)42:3<211::aid-pros7>3.0.co;2-u. [DOI] [PubMed] [Google Scholar]
- 10.Ortlund E, LaCount MW, Lebioda L. Crystal structures of human prostatic acid phosphatase in complex with a phosphate ion and alpha-benzylaminobenzylphosphonic acid update the mechanistic picture and offer new insights into inhibitor design. Biochem. 2003;42:383–89. doi: 10.1021/bi0265067. [DOI] [PubMed] [Google Scholar]
- 11.Schneider G, Lindqvist Y, Vihko P. Three-dimensional structure of rat acid phosphatase. EMBO J. 1993;12:2609–15. doi: 10.1002/j.1460-2075.1993.tb05921.x. [DOI] [PMC free article] [PubMed] [Google Scholar]
- 12.Gee KR, Sun WC, Bhalgat MK, et al. Fluorogenic substrates based on fluorinated umbelliferones for continuous assays of phosphatases and β-galactosidases. Anal Biochem. 1999;273:41–8. doi: 10.1006/abio.1999.4202. [DOI] [PubMed] [Google Scholar]
- 13.Zhang J, Thomas D, Chung Y, Oldenburg KR. A simple statistical parameter for use in evaluation and validation of high throughput screening assays. J Biomol Screen. 1999;4:67–74. doi: 10.1177/108705719900400206. [DOI] [PubMed] [Google Scholar]
- 14.LaCount MW, Handy G, Lebioda L. Structural origins of L(+)-tartrate inhibition of human prostatic acid phosphatase. J Biol Chem. 1998;273:30406–409. doi: 10.1074/jbc.273.46.30406. [DOI] [PubMed] [Google Scholar]
- 15.Pulgarin JAM, Molina AA, Lopez PF. Simultaneous direct determination of amiloride and triamterene in urine using isopotential fluorometry. Anal Biochem. 2001;292:59–68. doi: 10.1006/abio.2001.5064. [DOI] [PubMed] [Google Scholar]