

Abstract
Serum fatty acids (FA) have wide effects on metabolism: Serum saturated fatty acids (SFA) increase triglyceride (TG) levels in plasma while polyunsaturated fatty acids (PUFA) reduce them. Traditionally, Eskimos have a high consumption of omega -3 fatty acids (ω–3 FA), but the westernization of their food habits have increased their dietary SFAs, partly reflected in their serum concentrations. We studied the joint effect of serum SFAs and PUFAs on circulating levels of TG in the presence of metabolic syndrome components.
We included 212 men and 240 women (age 47.9±15.7 y, BMI 26.9±5.3) from four villages located in Alaska for a cross sectional study. Generalized linear models were employed to build surface responses of TG as in functions of SFAs and PUFAs measured in blood samples adjusting by sex, BMI and village. The effects of individual FAs were assessed by multiple linear regression analysis and partial correlations (r) were calculated.
The most important predictors for TG levels were glucose tolerance (r = 0.116, p = 0.018) and BMI (r = 0.42, p<0.001). TG concentration showed negative associations with 20:3ω-6 (r =− 0.16, p = 0.001), 20:4ω-6 (r = −0.14, p=0.005), 20:5ω-3 (r = −0.17, p<0.001) and 22:5ω-3 (r = −0.26, p<0.001), and positive associations with palmitic acid (r = 0.16, p<0.001) and 18:3ω-3 (r = 0.15, p<0.001). The surface response analysis suggested that the effect of palmitic acid on TG is blunted in different degrees according to the PUFA chemical structure. The long chain ω-3, even in presence of high levels of SF, was associated with lower triglyceride levels.
Eicosapentanoic acid (20:5ω3) had the strongest effect against palmitic acid on TG. The total FA showed moderate association with levels of TG, while SFA was positively associated, and large chain PUFA negatively. The westernized dietary habits among Eskimos are likely to change their metabolic profile and increase comorbidities related to metabolic disease.
Introduction
The recent increase in cardiovascular disease (CVD) and type 2 diabetes mellitus (DM) among Alaska Natives may be partially related to increased lifespan, but it also appears related to the improving economy in the past 35 years. With Alaskan statehood came considerable wealth, including cash for store-bought foods, four-wheelers, snow machines, and televisions. This has resulted in the uninformed purchase of western foods in stores and for many, the development of a sedentary lifestyle. Where life was once a real struggle, with extensive energy expenditures, the life for many is now more relaxed for both genders, but women’s energy expenditure has been greatly reduced resulting in a high prevalence of obesity.1,2,3
Free serum fatty acids (FFA) have wide effects on metabolism and its excessive intake produces insulin resistance in animals and humans.4,5 Serum cholesterol levels increase when diet includes high concentration of saturated fat whereas they decrease in the presence of polyunsaturated fatty acids (PUFA).6 A meta-analysis conducted by Mensink et al,7 showed that replacement of carbohydrates by PUFA decreased the level of triglycerides (TG). Saturated fats (SFA), like stearic and palmitic acids, have a marked stimulatory effect on glucose-mediated insulin secretion in perfused pancreas, a finding that has been confirmed recently.8 Meanwhile, epidemiological studies show a positive relationship between monounsaturated fat acids (MUFA)and beta cell insulin secretion.9
The possibility that over-consumption of certain specific fats can facilitate the development of type 2 diabetes (DM) has emerged only recently. The suggestion comes from three studies: 1) our findings of elevated plasma levels of palmitic acid in participants with impaired glucose tolerance (IGT) and previously undiagnosed DM1; 2) our intervention study aimed at decreasing consumption of palmitic acid and 3) from experiments in which adult rat pancreatic islets were cultured on plates.10 These cultured plates showed a clear lipotoxic effect of palmitic acid by increased apoptosis rate coupled with reduced proliferation capacity of β-cells and consequently impaired insulin secretion. The deleterious effect of palmitate on β-cell turnover is mediated via formation of ceramide and activation of the apoptopic mitochondrial pathway.
Relatives of individuals with DM have increased FFAs availability that contribute to mitochondrial dysfunction, which can be the initial step to develop other abnormalities such as accumulation of intramyocellular lipids, impaired lipid oxidation and insulin resistance.11 Guidelines for the American Heart Association for weight management emphasizes and limiting consumption of saturated fat to less than 10% total energy intake and considering the beneficial effects of ω-3 fatty acids supplements.12 There are limited studies related to the association of total and relative concentration of specific FAs in relation to the total pool of triglycerides and how this is affected by glucose, HDL-C, blood pressure and waist circumference.
To address if the ω-3 concentration affects the metabolic syndrome (MetS) components, we can approach the problem analyzing each MetS component. This approach is incomplete as it does not consider the MetS as a whole cluster where each component is conditioned by the presence of others, the clusters are due to the common base of insulin resistance.13 Each MetS component is not independent from the others. Even more, their dependence is not equal for each combination of MetS components. Some combinations have higher likehood to be dependent than others, so, we considered that the best approach was to include the whole cluster.14
The canonical regression was used as a multivariate approach that considered all MetS components at the same time with respect to their relation with total FAs. We described how the absolute plasma concentration (mg/mL) and relative concentration (% in the red cell membrane) of specific FAs correlate with serum triglycerides in the presence of MetS components.
MATERIALS AND METHODS
Study population
We invited 212 men and 240 women between 25 and 91 years of age from four villages (One Inupiat, one Central Yupik and two Siberian Yupik villages) in the Norton Sound Region of Alaska to participate in the study. The overall response from the potential sample population were 50% males and 67% females. All subjects were screened during a four week period in 1994.
Study screening
This project followed the Strong Heart Study Protocol15 which consisted of a personal interview (including medical history), physical examination (including blood pressure measurements and ECG), blood sampling and nutritional interviews using 24-h recall and food frequency instruments.1,16 The latter were conducted the day before the blood sampling. Blood chemistries were carried out at the Medstar Research Institute that also does the analysis for the Strong Heart Study. The methods used have been described elsewhere.15 Insulin was measured using a radioimmunoassay developed as a modification of the method of Morgan and Lazarow.15 Anthropometric measurements included hip, height, weight and waist (at umbilicus) circumferences. 16,17 After the participant had rested for 5 minutes in the sitting position, three consecutive blood pressure measurements were made on the right arm with a standard stethoscope, an appropriate-sized cuff, and a Baum mercury sphygmomanometer (W.A. Baum Company, Copiaque, New York), using the first and fifth phase Korotkoff sounds. The mean of the last two measurements was used to estimate the blood pressure.
Plasma FA analysis
Plasma FAs were analyzed at the University of Alaska Anchorage1 in 1994 and has been described elsewhere.10,16 The concentration of each FA was determined for each sample using regression analysis. The ratio of the area of each fatty acid peak to the internal standard peak was plotted against the weight ratio of the fatty acid and the internal standard. The regression equation was used to calculate the concentration of each fatty acid in each sample. Typical correlations were 0.99 or better.
Finally, we studied the Δ6 desaturation index, a known measurement associated with cardiovascular disease:18
Statistics
General descriptions of variables were shown as mean ± standard deviation.. Canonical correlation was conducted with 397 subjects (204 men and 193 women) that complete the matrix of all MetS components. Gender is related to important metabolic differences; therefore, each gender was analyzed separately. We used the first canonical variate to calculate the correlation between every two sets of variables.19 The canonical structure matrix was calculated using the canonical variate scores with the original data. The p value was calculated according to the method described by Bartlett.20
Waist circumference is a MetS component, but it explains partially the presence of other MetS components. This inconsistency led us to run models with waist circumference at the explanatory side of the canonical equation and to run another model with waist circumference at the explained side. These sides (explanatory or explained) are simple conventions according to the subjacent biological background of the hypothesis.
The models included BMI and waist circumference, but they were analyzed separately because of their high correlation (colinearity r=0.9, p<0.01).
Multiple linear regression was used to adjust for variables that explain serum triglyceride variation. Sex, age, village, waist circumference or BMI were used as adjustment variables. We worked with first order interaction models to maintain a simple way to understand basic relationships.
We tested the hypothesis that increasing weight and serum glucose should be positively associated with higher desaturation index and the Stepwise backward method was used to define the model. We considering a p value less than 0.10 as an important contributor of the triglyceride variation. Each model was assessed by residual analysis of Cook, Mahalanobis and Leverage distances. Surface response graphics were built to show the interaction results obtained from the multiple linear model.
RESULTS
We analyzed 212 men and 240 women (age 47.9±15.7 y, BMI 26.9±5.3) from four villages located in Alaska.
The analysis showed important sex differences for anthropometric measurements and insulin resistance markers but not for serum FA levels (table 1). It is remarkable that this population has, on the average, high fasting glucose levels but low HOMA-IR index, low serum triglycerides and high HDL-C.
Table 1.
Comparison between sexes for anthropometric, blood pressure, lipid profile and insulin resistance. Serum fatty acids are not shown as they had no significant differences between sexes. Comparisons were made by Student t test adjusted for variance.
| Variable | Women | Men | p value |
|---|---|---|---|
| Age (years old) | 48.3±16 | 46.1±15 | 0.165 |
| Waist circumference (cm) | 93.0±15 | 89.7±12 | 0.013 |
| BMI | 27.3±5.5 | 25.9±4.2 | 0.003 |
| Systolic blood pressure (mmHg) | 117±19 | 118±14 | 0.902 |
| Diastolic blood pressure (mmHg) | 72.5±12 | 75.6±11 | 0.009 |
| Cholesterol (mg/dL) | 227.3±40 | 225.4±47 | 0.676 |
| Triglycerides (mg/dL) | 75.3±54 | 74.5±53 | 0.879 |
| HDL-C (mg/dL) | 60.6±16.7 | 54.1±15.9 | <0.001 |
| Fasting glucose (mg/dL) | 100.1±12 | 101±11 | 0.332 |
| HOMA-IR | 1.8±1.2 | 1.5±1.0 | 0.002 |
| Insulin (uU/L) | 7.3±4.4 | 5.8±3.7 | <0.001 |
Data are expressed as mean ± SD.
Clusters of metabolic syndrome
The canonical correlations variates showed the relation between the metabolic syndrome components and the studied serum lipids.
Serum FAs (described in table 2) were related mainly to triglycerides and diastolic blood pressure in women (Rc=0.71, p<0.0001) and men (Rc=0.67, p<0.0001). The association was significant for systolic blood pressure, waist circumference and glucose only in men. The structural coefficient shows that the contribution of triglycerides to the canonical variates was the highest of all metabolic components for both genders (r= 0.904 for women and r=0.905 for men). The results can be seen in table 2.
Table 2.
Canonical loadings and matrix structure. The matrix structure was calculated with the correlation of the canonical variates against the original variables. The first canonical correlation root for women was 0.77 (p<0.001) and for men was 0.78 (p<0.001).
| Women N=204 |
Men N=193 |
|||||
|---|---|---|---|---|---|---|
| MetS component | Loading | p-value | Structure coefficients | Loading | p-value | Structure coefficients |
| Explained variables | ||||||
| Systolic bp | 1.247 | 0.009 | 0.133 | −0.995 | 0.125 | 0.157 |
| Diastolic bp | −0.267 | 0.507 | 0.495 | 2.009 | <0.001 | 0.433 |
| HDL-C | −0.390 | 0.096 | −0.577 | −0.523 | 0.015 | −0.607 |
| Triglycerides | 1.696 | <0.001 | 0.904 | 1.509 | <0.001 | 0.915 |
| Glucose | 0.407 | 0.770 | 0.021 | −0.155 | 0.750 | 0.003 |
| Total Cholesterol | −1.168 | 0.001 | −0.016 | −1.481 | <0.001 | −0.083 |
| Explicative variables | ||||||
| 16:0 | 0.537 | 0.183 | 0.218 | 0.119 | 0.738 | 0.333 |
| 18:0 | 0.782 | 0.177 | 0.019 | −0.837 | 0.057 | 0.107 |
| 18:1ω9 | 2.207 | <0.001 | 0.291 | 1.652 | <0.001 | 0.375 |
| 18:2ω6 | −1.863 | <0.001 | 0.124 | −0.533 | 0.002 | 0.187 |
| 18:3ω3 | 2.143 | <0.001 | 0.122 | 1.009 | 0.047 | 0.213 |
| 18:3ω6 | 2.094 | 0.006 | 0.194 | 3.319 | <0.001 | 0.297 |
| 20:3ω6 | −1.574 | 0.004 | 0.179 | −1.683 | 0.003 | 0.176 |
| 20:4ω6 | −0.896 | 0.011 | −0.008 | −0.362 | 0.259 | −0.053 |
| 20:5ω3 | −1.106 | <0.001 | −0.304 | −0.749 | <0.001 | −0.249 |
| 22:6ω3 | 0.197 | 0.629 | −0.119 | −0.014 | 0.948 | −0.135 |
| Age (Years) | −0.033 | 0.885 | −0.239 | −0.966 | <0.001 | −0.291 |
| Waist | 2.626 | <0.001 | 0.707 | 4.417 | <0.001 | 0.542 |
The most important FA association with the cardiovascular risk variables in women and men were, 18:1ω–9 (r=0.291, r=0.375), 18:2ω-6 (r=0.124, r=0.187), 18:3ω3 (r=0.122, r=0.213), 18:3ω-6 (r=0.194, r=0.297), 20:3ω-6 (r=0.179, r=0.176), and 20:5ω-3 (r=−0.304, r=−0.245; all with p<0.05, respectively (Table 2). Interestingly, women showed a slight additional effect of 20:4ω6 (r=−0.01, p=0.011) and men for 18:0 (r=0.107, p=0.057). The waist circumference was a very important variable that correlated with the canonical variate r=0.71 for women and r=0.54 for men (p<0.001 for both).
In a previous exploratory model we tested the waist circumference at the dependent side of the equation (See statistic methodology section). The contribution of TG to the canonical variate remained important.
Levels of serum triglycerides associated with FA concentration
Based on our canonical model, we decided to analyze the effect of FAs on triglyceride variation using multiple linear regression models. The initial model included serum FA and its interactions, adjusted by age, sex, waist circumference, BMI and HOMA index. Two models were tested: 1) Absolute serum levels of FA and relative proportion (percentage) of serum FA. 2) The model with absolute concentration of FA showed multiplicative interaction between 20:5ω3 and 16:0; 18:1ω9 and 18:2ω6; 18:1ω9 and 18:3ω6; 18:2ω6 and 20:3ω6; 18:3ω3 and 20:3ω6.
The adjusted serum triglycerides and the interaction between fatty acids as percentage can be seen in figure 1 and as absolute serum levels in figure 2. The described associations remained despite adjustment using HOMA-IR as covariate.
Figure 1.
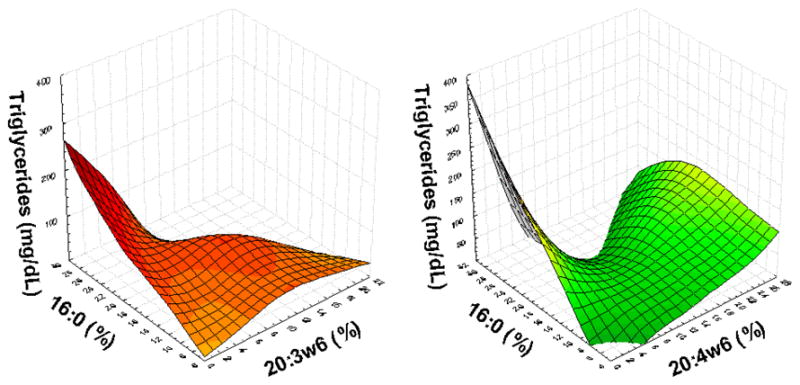
Serum triglycerides concentration is affected by the interaction of relative concentrations of fatty acids. Figures show positive association of serum triglycerides with palmitic acid only in presence of low relative concentration of 20:3ω6 and 20:4ω6. This association is blunted in presence of higher concentration of this ω6.
Figure 2.

Serum triglycerides are positively associated with the interaction of absolute concentration of 18:1ω9, 18:2ω6, and 20:3ω6. The absolute concentration of fatty acids depends is close related with the triglyceride concentration.
The delta-6-desaturation index did not explain the variation of triglycerides, most of its variation was associated with serum insulin levels (r=0.32, p<0.001), BMI (r=0.19, p<0.0001) and waist circumference (r=0.25, p<0.001) (The last two were analyzed in separated models).
DISCUSSION
This study demonstrates that the interaction between different types of FAs is associated mainly with serum triglycerides compared to other studied variables related to insulin resistance. This relationship was independent of the HOMA-IR measurement and differs according to whether the FAs are considered as absolute serum concentration or relative (percentage) component. The absolute variation of polyunsaturated FA showed an important inverse correlation with triglycerides and other components of metabolic syndrome. Cholesterol concentration was not affected by such variation.
The current criteria for MetS include the waist circumference but this is a causal factor for the other four components yielding to controversial aspects about its clinical utility.21 We considered that the best way to understand our model with biological basis was to include the waist circumference in the explanatory side of the canonical correlation. The effect of ω-3 FA upon triglycerides remained significant despite the waist circumference at the explained side of the equation which supports the independent association of ω-3 FA with triglyceride concentration. We included in the explained side of the canonical equation the total cholesterol, as another metabolic component associated with coronary disease, but it is clear that triglyceride concentration remained associated with the specific ω-3 FA concentration.
It is clear that each FA has its own particular effect on metabolism. Intervention studies have shown that fatty acid composition of structured triacylglycerols affects its digestion and absorption; moreover, the inclusion of some monounsaturated fat can prevent fat accumulation in healthy individuals.22
The studied population showed high average serum glucose levels, but accompanied by low HOMA-IR index and, most remarkable, the presence of low levels of triglycerides and high HDL-cholesterol. This unique metabolic profile may be related to environmental or genetic differences, which influence specific phenotypes i.e. It is known that adipose tissue depot in muscle (metabolic effect) is influenced by ethnicity (environment and genetic effects).23 The study of whether the recently introduced non-traditional foods are harmful to these populations has only recently begun.16 The plasma content of C20 and C22 ω-3 FAs are derived from fish and marine mammals, principal components of traditional Eskimo diet.10 Lack of information about healthy food has resulted in many Eskimos turning from healthy traditional foods, rich in ω-3 fatty acids and low in saturated fats, to store bought foods high in saturated and trans fatty acids. Young Eskimos currently consume large amounts of nontraditional fat.1 Thus ethnic specific craving for such items as Eskimo Ice Cream (now made from Crisco shortening and berries) has led to a distinct change in fat consumption. The frequently purchased items high in 16:0 and trans 18:1-9 FAs are butter, shortening, margarine, and bacon. Our screening of 454 Alaskan Eskimos revealed that many exceeded the fat and saturated fat restrictions consistent with the Step 1 NCEP recommendations: 42% of individuals had diets that were ≥10% saturated fat, 61.1% had diets that were ≥ 300 mg cholesterol, and 81% had diets that were ≥ 30% total fat. Considering that DM and CVD were rare in this population only 40 years ago on a traditional diet, it is easy to imagine that change in fat consumption in this population contributes to disease. It is also likely, but not yet proven, that other Native Americans have changed their fat consumption. For example, the Pima Indians now also use Crisco shortening in considerable quantities in tortillas and fried bread.
A challenge in clinical trials for testing diets is the low adherence to the diet, however, the data consistently show that fish diet and fish oil reduce the overall risk of coronary death.24 The levels of FAs are not only related to diet consumption, but also to the expression of enzyme activity that can contribute to the phenotypes of metabolic syndrome. The activity of the 11-b-hydroxysteroid dehydrogenase type 1 in adipose tissue has been associated with fasting glucose, insulin levels and insulin resistance.25,26 But the clinical significance is still controversial, because the enzyme can be a marker and not a determinant of obesity and insulin resistance.27
Study limitations
This cross sectional design does not reveal the possible mechanisms that explain the causality of the model. Temporality can not be tested. However, the intervariable correlational analysis conducted here can help to understand relationship between variables.
Study strengths
Direct serum measurement of different types of FAs can help to understand how their serum concentration is related to variables related to cardiovascular disease. The analysis of complex traits is difficult because many variables act together at the same time. Analyses by multivariate methods become a key to understand the complex association between variables.
We considered the interaction between FAs. This first order interaction helps to understand the relation ship between percentages compared to absolute values. These two analyses showed different relationship between FAs and triglycerides, suggesting different metabolic pathways for plasma FAs and FA percentage within red cell membranes. In other words, these measurements of FAs concentration are not equivalent and are phenotypes of complex subjacent metabolism and not the simple fat ingestion.
Conclusions
The amounts of absolute plasma concentration or relative concentration of specific FAs are related to TG concentration. The FAs can play a causal role for subsequent complications of MetS and the metabolic effect is related with the biochemical configuration associated with different metabolic pathways for each FA. The controversy remains, however, the waist circumference looks better as explanatory variable, independent of the ω-3 concentration, of the triglyceride concentrations and the other four MetS.
Table 3.
Multiple lineal regression for serum triglycerides concentration. The first 3 columns are for FA in absolute serum concentration values (mg/mL); and the other 3 columns are for FA measured as relative concentrations (percentage).
| Variable | Stand. β | Partial r | p-value | Stand. β | Partial r | p-value |
|---|---|---|---|---|---|---|
| Age (years) | −0.062 | −0.082 | 0.096 | −0.075 | −0.097 | 0.049 |
| Waist (cm) | 0.170 | 0.208 | <0.001 | 0.225 | 0.257 | <0.001 |
| HOMA index | 0.218 | 0.270 | <0.001 | 0.229 | 0.267 | <0.001 |
| 16:0 | −1.055 | −0.164 | 0.001 | 0.526 | 0.291 | <0.001 |
| 18:1ω9 | 0.611 | 0.457 | <0.001 | |||
| 18:2ω6 | −3.738 | −0.325 | <0.001 | |||
| 18:3ω3 | 0.563 | 0.335 | <0.001 | |||
| 18:3ω6 | 1.086 | 0.254 | <0.001 | 0.386 | 0.193 | <0.001 |
| 20:3ω6 | −2.251 | −0.265 | <0.001 | |||
| 20:4ω6 | −0.170 | −0.120 | 0.015 | 0.329 | 0.100 | 0.041 |
| 20:5ω3 | −2.851 | −0.224 | <0.001 | −0.109 | −0.107 | 0.030 |
| 22:5ω3 | −0.138 | −0.103 | 0.035 | |||
| 22:6ω3 | 0.089 | 0.104 | 0.035 | |||
| 20:3ω6 * 16:0 | −0.244 | −0.154 | 0.002 | |||
| 20:4ω6 * 16:0 | −0.382 | −0.136 | 0.006 | |||
| 20:5ω3 * 16:0 | 3.078 | 0.199 | <0.001 | |||
| 18:1ω9 * 18:2ω6 | 3.110 | 0.271 | <0.001 | |||
| 18:1ω9 * 18:3ω6 | −0.971 | −0.155 | 0.002 | |||
| 18:2ω6 * 20:3ω6 | 1.800 | 0.178 | <0.001 | |||
| 18:3ω3 * 20:3ω6 | 0.75 | 0.221 | <0.001 | |||
Stand= Standardized coefficients. Blank spaces denote non-significant effect.
Acknowledgments
The authors are grateful to the Norton Sound Health Corporation (NSHC) and the participants of villages participating in this study. The authors are also grateful to Dr. Cynthia Schraer, Dr. Amanda Adler and Anne Marie Mayer for their enormous contributions in the screenings. This study was approved by the NSHC, the Institutional Review Boards of the University of Alaska Fairbanks and the Alaska Native Health Center. This research was supported by grant RO1-47099 from the National Institute for Diabetes, Digestive and Kidney Diseases. This investigation was conducted in facilities constructed with support from Research Facilities Improvement Program Grant Number C06 RR017515 from the National Center for research Resources, National Institutes of Health.
Footnotes
Publisher's Disclaimer: This is a PDF file of an unedited manuscript that has been accepted for publication. As a service to our customers we are providing this early version of the manuscript. The manuscript will undergo copyediting, typesetting, and review of the resulting proof before it is published in its final citable form. Please note that during the production process errors may be discovered which could affect the content, and all legal disclaimers that apply to the journal pertain.
References
- 1.Ebbesson SOE, Kennish J, Ebbesson LOE, Go O, Yeh J. Diabetes is related to fatty acid imbalance in Eskimos. Int J Circumpol Health. 1999;58:108–119. [PubMed] [Google Scholar]
- 2.Risica PM, Schraer C, Ebbesson SO, Nobmann ED, Caballero B. Overweight and Obesity Among Alaskan Eskimos of the Bering Straits Region: the Alaska Siberia Project. Int J Obes Relat Metab Disord. 2000;24:939–44. doi: 10.1038/sj.ijo.0801259. [DOI] [PubMed] [Google Scholar]
- 3.Ebbesson SOE, Schraer CD, Risica PM, et al. Diabetes mellitus and impaired glucose tolerance in three Alaskan Eskimo populations: The Alaska-Siberia Project. Diabetes Care. 1998;21:563–569. doi: 10.2337/diacare.21.4.563. [DOI] [PubMed] [Google Scholar]
- 4.Pascoe WS, Storlien H. Inducement by fat feeding of basal hyperglycemia in rats with abnormal beta-cell function: model for study of etiology and pathogenesis of NIDDM. Diabetes. 1990;39:226–233. doi: 10.2337/diab.39.2.226. [DOI] [PubMed] [Google Scholar]
- 5.Boden G, Carnell LH. Nutritional effects of fat on carbohydrate metabolism. Best Pract Res Clin Endocrinol Metab. 2003;17:399–410. doi: 10.1016/s1521-690x(03)00032-0. [DOI] [PubMed] [Google Scholar]
- 6.Keys A, Anderson JT, Grande F. Serum cholesterol response to changes in the diet: IV. Particular saturated fatty acids in the diet. Metabolism. 1965;14:776–786. doi: 10.1016/0026-0495(65)90004-1. [DOI] [PubMed] [Google Scholar]
- 7.Mensink RP, Katan M. Effect of dietary fatty acids on serum lipids and lipoproteins. A meta-analysis of 27 trials. Arterioscler Thromb. 1992;12:911–19. doi: 10.1161/01.atv.12.8.911. [DOI] [PubMed] [Google Scholar]
- 8.Stein DT, Stevenson BE, Chester ME. The insulinotropic potency of fatty acids is influenced profoundly by their chain length and degree of saturation. J Clin Invest. 1997;100:398–403. doi: 10.1172/JCI119546. [DOI] [PMC free article] [PubMed] [Google Scholar]
- 9.Rojo-Martínez G, Esteva I, Ruiz de Adana MS, et al. Dietary fatty acids and insulin secretion: a population-based study. Eur J Clin Nutr. 2006;60:1195–1200. doi: 10.1038/sj.ejcn.1602437. [DOI] [PubMed] [Google Scholar]
- 10.Ebbesson SOE, Kennish J, Ebbesson LOE, Go O, Yeh J. Diabetes is related to fatty acid imbalance in Eskimos. Int J Circumpol Health. 1999;58:108–119. [PubMed] [Google Scholar]
- 11.Roden M. Muscle triglycerides and mitochondrial function: Possible mechanisms for the development of type 2 diabetes. Int J Obes. 2005;29:S111–S115. doi: 10.1038/sj.ijo.0803102. [DOI] [PubMed] [Google Scholar]
- 12.Krauss RM, Eckel R, Howard B, et al. AHA Dietary guidelines. Revision 2000: A statement for healthcare professionals from the nutrition committee of the American Hearth Association. Circulation. 2000;102:2284–99. doi: 10.1161/01.cir.102.18.2284. [DOI] [PubMed] [Google Scholar]
- 13.Zimmet P, Boyko EJ, Collier GR, De Courten M. Etiology of the metabolic syndrome: potential role of insulin resistance, Leptin resistance, and other players. Ann N Y Acad Sci. 1999;892:25–44. doi: 10.1111/j.1749-6632.1999.tb07783.x. [DOI] [PubMed] [Google Scholar]
- 14.Lopez-Alvarenga JC, Solís-Herrera C, Kent JW, et al. Prevalence and heritability of clusters for diagnostic components of metabolic syndrome: The Oman Family Study. Metab Syndr Relat Disord. 2008;6:129–35. doi: 10.1089/met.2007.0039. [DOI] [PubMed] [Google Scholar]
- 15.Lee ET, Welty TK, Fabitz R, et al. The Strong Heart Study--a study of cardiovascular disease in American Indians: design and methods. Amer J Epidem. 1990;132:1141–55. doi: 10.1093/oxfordjournals.aje.a115757. [DOI] [PubMed] [Google Scholar]
- 16.Risica PM, Nobmann ED, Caulfield LE, Schraer C, Ebbesson SOE. Springtime macronutrient intake of Alaska Natives of the Bering Straits region: the Alaska Siberia Project. Int J Circumpolar Health. 2005;64:222–233. doi: 10.3402/ijch.v64i3.17986. [DOI] [PubMed] [Google Scholar]
- 17.Risica PM, Ebbesson SO, Schraer CD, Nobmann ED, Caballero BH. Body Fat Distribution in Alaskan Eskimos of the Bering Straits Region: the Alaskan Siberia Project. Int J Obes Relat Metab Disord. 2000;24:171–9. doi: 10.1038/sj.ijo.0801103. [DOI] [PubMed] [Google Scholar]
- 18.Leskinen MH, Solakivi T, Kunnas T, Alho H, Nikkari ST. Serum fatty acids in postinfarction middle-aged men. Scand J Clin Lab Invest. 2005;65:485–490. doi: 10.1080/00365510510025836. [DOI] [PubMed] [Google Scholar]
- 19.Cooley WW, Lohnes PP. Multivariate data analysis. New York: Wiley; 1971. [Google Scholar]
- 20.Bartlett MS. The statistical significance of canonical correlations. Biometrika. 1941;32:29–38. [Google Scholar]
- 21.Kahn R. Metabolic Syndrome: Is It a Syndrome? Does It Matter? Circulation. 2007;115:1806–1811. doi: 10.1161/CIRCULATIONAHA.106.658336. [DOI] [PubMed] [Google Scholar]
- 22.Mu H, Porsgaard T. The metabolism of structured triacylglycerols. Prog Lipid Res. 2005;44:430–448. doi: 10.1016/j.plipres.2005.09.002. [DOI] [PubMed] [Google Scholar]
- 23.Gallagher D, Kuznia P, Heshka S, et al. Adipose tissue in muscle: a novel depot similar in size to visceral adipose tissue. Am J Clin Nutr. 2005;81:903–10. doi: 10.1093/ajcn/81.4.903. [DOI] [PMC free article] [PubMed] [Google Scholar]
- 24.Sacks F, Katan M. Randomized clinical trials on the effects of dietary fat and carbohydrate on plasma lipoproteins and cardiovascular disease. Am J Med. 2002;113:13S–24S. doi: 10.1016/s0002-9343(01)00987-1. [DOI] [PubMed] [Google Scholar]
- 25.Linsay RS, Wake DJ, Nair S, et al. Subcutaneous adipose 11- beta-hydroxysteroid dehydrogenase type 1 activity and messenger ribonucleic acid levels are associated with adiposity and hyperinsulinemia in Pima Indians and Caucasians. J Clin Endocrinol Metab. 2003;88:2738–44. doi: 10.1210/jc.2002-030017. [DOI] [PubMed] [Google Scholar]
- 26.Nair S, Lee YH, Lindsay RS, et al. 11-beta-hydroxysteroid dehydrogenase type 1: genetic polymorphism are associated with type 2 diabetes in Pima Indians independently of obesity and expression in adipocyte and muscle. Diabetologia. 2004;47:1088–95. doi: 10.1007/s00125-004-1407-6. [DOI] [PubMed] [Google Scholar]
- 27.Koska J, de Courten B, Wake DJ, et al. 11b-hydroxisteroid dehydrogenase type 1 in adipose tissue and prospective changes in body weight and insulin resistance. Obesity. 2006;14:1515–22. doi: 10.1038/oby.2006.175. [DOI] [PubMed] [Google Scholar]