Abstract
Congenital urinary tract obstruction induces changes to the renal collecting duct epithelium, including alteration and depletion of intercalated cells. To study the effects of obstruction on the ontogeny of intercalated cell development, we examined normal and obstructed human fetal and postnatal kidneys. In the normal human fetal kidney, intercalated cells originated in the medullary collecting duct at 8 weeks gestation and remained most abundant in the inner medulla throughout gestation. In the cortex, intercalated cells were rare at 18 and 26 weeks gestation and observed at low abundance at 36 weeks gestation. Although early intercalated cells exhibit an immature phenotype, Type A intercalated cells predominated in the inner and outer medullae at 26 and 36 weeks gestation with other intercalated cell subtypes observed rarely. Postnatally, the collecting duct epithelium underwent a remodeling whereby intercalated cells become abundant in the cortex yet absent from the inner medulla. In 18-week obstructed kidneys with mild to moderate injury, the intercalated cells became more abundant and differentiated than the equivalent age-matched normal kidney. In contrast, more severely injured ducts of the late obstructed kidney exhibited a significant reduction in intercalated cells. These studies characterize the normal ontogeny of human intercalated cell development and suggest that obstruction induces premature remodeling and differentiation of the fetal collecting duct epithelium.
Congenital urinary tract obstruction is an important cause of morbidity and mortality in affected fetuses.1,2,3,4,5 Children born with less severe obstruction are at risk of developing chronic kidney disease and its inherent complications, including progression to end-stage renal disease and the need for dialysis and transplantation.6 In utero kidney obstruction results in altered glomerular development, cortical glomerular cystogenesis, tubular atrophy, apoptosis of tubular cells, and expansion and fibrosis of the renal interstitium.7,8,9 In the fetal monkey kidney, obstruction causes significant alteration to the collecting duct (CD) epithelium, including mesenchymal transition and loss of ICs.10
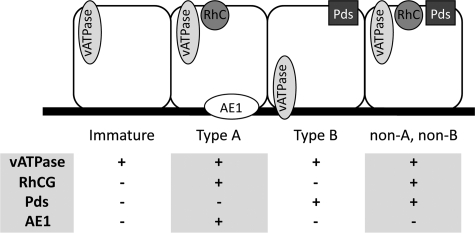
Unlike other nephron segments, the CD is derived exclusively from the ureteric bud. During fetal kidney development, this ureteric bud branches with the earliest differentiation of the CD epithelium occurring in the initial branches of the ureteric bud of the medulla.11 The mature and differentiated CD epithelium comprises two unique cells types with principal cells responsible for vasopressin-regulated water reabsorption via aquaporin-2, and intercalated cells (ICs) regulating acid-base homeostasis.12 ICs can further be subdivided into type A, type B, and non-A non-B cells, which are identifiable by their expression of transporter proteins (Figure 1) including vacuolar H+-ATPase (vATPase; apical in type A and non-A non-B and basolateral in type B ICs), the bicarbonate transporters pendrin (in type B and non-A non-B cells) and anion exchanger 1 (basolateral in type A), and the ammonium transporter Rhesus blood group C glycoprotein (RhCG; in type A and non-A non-B ICs).13,14,15,16,17 In addition to pH regulation, ICs exhibit phenotypic plasticity in vitro allowing them to differentiate into other IC subtypes and into principal cells.18,19 This putative pluripotency raises the possibility that these subtypes may be responsible for CD epithelial renewal or the adaptive response to injury.
Figure 1.
Classification of ICs. ICs and their functionally specific subtypes are identifiable by their expression of transport proteins, including the hydrogen ion transporter vATPase, ammonium transporter RhCG, and the chloride/bicarbonate exchangers pendrin and anion exchanger 1 (AE1).
Little is known about the normal development and ontogeny of ICs in the human fetal kidney. In mice, ICs are first observed in the developing medullary CD and connecting tubule, yet are not seen in the cortical CD throughout prenatal development.20,21 In the immediate postnatal period, the IC distribution shifts from the inner medullary CD to the cortical CD, similar to the adult distribution across several species.14,22,23,24,25
The full extent of the effects of obstruction on CD epithelial remodeling and on postnatal CD physiology is unknown. The purpose of the current study was to define the normal ontogeny of human IC development, and to characterize the changes in IC abundance and distribution after fetal urinary tract obstruction.
Materials and Methods
Sample Collection
Normal (n = 9) and obstructed kidneys (n = 4) were collected from fetuses at 8 to 36 weeks of gestation and from infants up to 16 months postnatal (n = 3). All samples were collected in accordance within the ethical guidelines of the University of British Columbia and the Vall D’hebron University Hospital. Normal kidneys were collected at 8 to 10 weeks (n = 2), 18 weeks (n = 3), 26 to 29 weeks (n = 3), and 36 weeks (n = 1) gestation, and postnatally (n = 2) at 12 months of age. All normal kidneys were obtained from fetuses with no documented abnormalities. Obstructed kidneys were collected at 18 weeks (n = 2) and 36 weeks (n = 2) gestation, and postnatally (n = 1) at 16 months of age. All obstructed kidneys were the result of bladder outlet obstruction with no other noted anomalies. All obstructed kidneys exhibited hallmarks of renal dysplasia including glomerular and tubular cysts, associated interstitial expansion, peritubular collar formation, and medullary hypoplasia and would be considered severe according to our previously described scoring system.10,26
Sample Processing
After collection, kidneys were immediately fixed in 4% paraformaldehyde overnight, dehydrated through graded ethanols before transfer to toluene. Wax perfusion was achieved via a 1:1 mix of toluene wax. The tissue was then oriented in cassettes and embedded in wax overnight. Sections of each paraffin embedded tissue were sectioned with a microtome (5 to 10 μm), mounted on Superfrost slides (VWR, West Chester, PA), and baked overnight at 55°C. Sections were then cooled to room temperature and stored with dessicant.
Immunofluorescent Histochemistry
Tissue sections were deparaffinized in xylene and rehydrated by passage through graded ethanols. Slides were then subjected to 40 minutes of heat-induced epitope retrieval in 10 mmol/L citrate buffer (pH 6) pre-heated in a domestic vegetable steamer. Sections were subsequently cooled to room temperature and blocked for 1 hour with 2% goat or donkey serum. After blocking, excess buffer was removed and replaced with diluted primary antibodies in staining buffer for incubation overnight at 4°C. Sections were then incubated for one hour with fluorescently conjugated secondary antibodies at room temperature. Nuclei were stained for five minutes with DAPI dilactate (1:36, Invitrogen, Carlsbad, CA) before mounting with Prolong Gold mounting media with antifade (Invitrogen). Analysis of tissue staining was performed on a Leica epifluorescence microscope (Wetzlar, Germany) using images captured with a Retiga 1300i camera (QImaging, Surrey Canada) and processed with OpenLab imaging software (Improvision, Waltham, MA).
Antibodies
Primary antibodies used and their dilutions are as follows: vATPase (1:100, Santa Cruz, Santa Cruz, CA), RhCG (1:100, Abnova, Teipei, Taiwan), pendrin (1:100, MBL, Woburn, MA), aquaporin 2 (1:100, Santa Cruz), and anion exchanger 1 (1:100, International Blood Group Reference Laboratory, Britol, UK). For some experiments, Alexa488 was conjugated to the mouse-derived RhCG primary antibody to allow colocalization with the mouse-derived pendrin antibody using a monoclonal antibody labeling kit (Invitrogen). Fluorescent labeling was achieved using goat anti-mouse and goat anti-rabbit secondary antibodies conjugated to either Alexa488 or Alexa568 (1:100, Invitrogen).
Cell Counts
In control kidneys, CDs from representative microscope fields were counted. In obstructed kidneys, where the severity of injury varies widely throughout the kidney, all medullary CDs were counted and compared with the pooled results from the normal inner and outer medullae. In each analysis, the total number of epithelial cells per CD was determined by counting the number of DAPI-stained nuclei per duct. The abundance of ICs and IC subtypes was determined by counting the number of cells expressing the relevant markers (Figure 1) per duct. The abundance of all ICs an region (total ICs) are expressed as the percentage of CD cells per duct, whereas the abundance of individual IC subtypes is expressed as the percentage of ICs per duct.
Statistical Analysis
Standard deviations are listed for values of ICs and IC subtypes as a percentage of CD. Error bars represent SEM.
Results
IC Characterization
In the adult kidney, IC subtypes can be readily identified by their expression of various transporter proteins including vATPase, RhCG, Anion Exchanger 1, and pendrin. However, the human fetal kidneys studied expressed these proteins at differing stages of development. vATPase was present in all ICs and was observed as early as 8 weeks gestation (not shown). Diffuse RhCG expression was first observed in isolated CD cells of the 18-week gestation kidney, but displayed high background immunoreactivity in kidneys of 18 weeks gestation or less. Similarly, neither pendrin nor anion exchanger 1 expression was observed before 26 weeks gestation. The disparate expression of these functional IC proteins at early gestational ages impedes the ability to identify and classify ICs into their classical subtypes (namely type A, type B, and non-A non-B) and suggests that many of the ICs observed in the early gestation kidney have an undifferentiated or immature phenotype. For the purpose of this study, ICs are classified into specific subtypes based strictly on the expression of the obligate transporters described above (Figure 1). Anion exchanger 1 was found to localize with RhCG expression in type A ICs and not in non-A non-B cells, and was therefore not included in subsequent characterization of these cells.
The Early Gestation Fetal Kidney
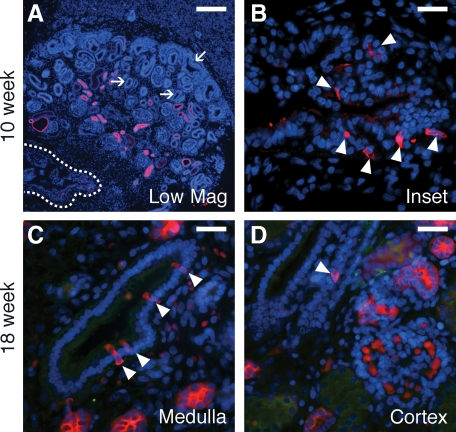
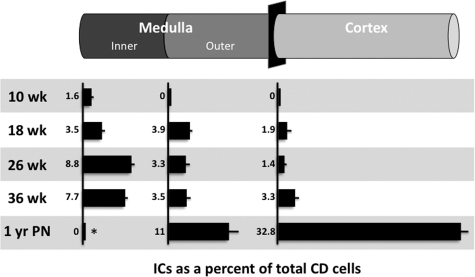
Based on their expression of vATPase, ICs were first observed in the early medullary branches of the ureteric duct of kidneys studied at 8 weeks gestation (not shown), and constituted 1.6% of CD cells in this segment by 10 weeks gestation (Figure 2, A–D, and Figure 3). In 18-week gestation kidneys, ICs were present in the inner medullary CD and outer medullary CD at approximately equal abundance (3.5% and 3.9% of CD cells, respectively). Based on the lack of pendrin expression, the majority of ICs are classified as immature ICs with a small fraction of type A ICs present (15.4% and 3.7% for the inner and outer medullae respectively; Table 1). In the medullary rays of the inner cortex only immature ICs (1.9% of CD cells) were observed, whereas no ICs were observed in the outer cortex or nephrogenic zone.
Figure 2.
ICs in the early human fetal kidney. ICs (arrowheads) in the 10-week gestation fetal kidney are restricted to the medullary ureteric bud (outline in A, magnified in B) and are not seen in the cortical ureteric ducts or in the ureteric tips of the nephrogenic zone (arrows). In the 18-week gestation fetal kidney, ICs are present in the medullary CD (C) and are seen rarely in the cortical CD (D). Stains: red, vATPase; green, RhCG; blue, DAPI. Scale Bars: A, 200 μm, B–D, 25 μm.
Figure 3.
ICs abundance in the normal fetal and postnatal kidney. For each segment of the CD and for each gestational age, the abundance of ICs is expressed relative to the total number of CD cells. *The IC abundance of the inner medullary CD of the 1-year postnatal kidney was evaluated qualitatively.
Table 1.
Abundance of IC Subtypes
| % of CD cells Total ICs | % of ICs (% of CD cells ± standard deviation)
|
||||
|---|---|---|---|---|---|
| Type A | Type B | Non-A non-B | Immature | ||
| 18 weeks | |||||
| IMCD | 3.5 ± 1.4 | 15.4 (0.5 ± 0.5) | 0 | 0 | 84.6 (2.9) |
| OMCD | 3.9 ± 1.5 | 3.7 (0.2 ± 0.4) | 0 | 0 | 96.3 (3.8) |
| CCD | 1.9 ± 1.6 | 1.3 (0.03 ± 1.8) | 0 | 0 | 62.6 (1.2) |
| 26 weeks | |||||
| IMCD | 8.8 ± 1.6 | 96.2 (8.5 ± 1.5) | 0 | 0 | 3.8 (0.3) |
| OMCD | 3.3 ± 2.1 | 54.4 (1.8 ± 1.6) | 0 | 0 | 45.6 (1.5) |
| CCD | 1.4 ± 2.2 | 43.9 (0.6 ± 0.1) | 10.6 (0.2 ± 0.3) | 34.2 (0.5 ± 1.1) | 11.3 (0.2) |
| 36 weeks | |||||
| IMCD | 7.7 ± 1.2 | 97.1 (7.5 ± 1.1) | 0.2 (2.9) | ||
| OMCD | 3.5 ± 1.9 | 78.4 (2.7 ± 1.7) | * | * | 21.6 (0.8) |
| CCD | 3.3 ± 1.8 | 41.0 (1.4 ± 0.8) | 59.0 (2.0) | ||
| Postnatal 1 year | |||||
| IMCD | 0 | — | — | — | — |
| OMCD | 11.0 ± 6.2 | 70.0 (7.7 ± 4.9) | 0 | 0 | 30.0 (3.3) |
| CCD | 32.8 ± 6.2 | 6.9 (2.3 ± 2.9) | 29.4 (9.7 ± 4.1) | 8.9 (2.9 ± 2.9) | 54.8 (17.8) |
ICs fractions expressed as percentage of CD cells ± standard deviation. Numbers in bold express IC subtypes as a percentage of total ICs. Immature cells are calculated as percent of total cells minus Type A, B and non-A non-B subtypes and therefore have no standard deviations.
Pendrin-positive cells not observed in 36-week gestation kidney.
The Mid and Late Gestation Fetal Kidney
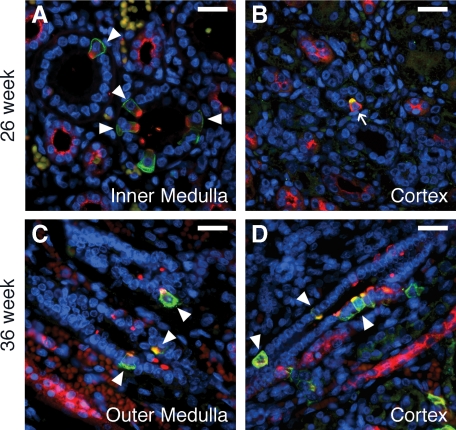
As in the early gestation kidney, the ICs of the mid gestation 26-week kidney were distributed from the inner medulla to inner cortex (Figures 3 and 4, A–D). However, in the inner medullary CD, the relative number of ICs increased compared with earlier gestation kidneys (8.8% of CD cells) with type A cells predominating (96.2% of ICs; Table 1). In the outer medullary CD, ICs constituted 3.3% of the CD epithelium with type A ICs representing 54.4% of ICs. In the cortical CD, ICs are less abundant (1.4% of CD cells) with type A ICs continue to predominate (43.9% of ICs), and non-A non-B, type B, and immature ICs comprising 34.2, 10.6, and 11.3% of ICs, respectively. As in earlier gestation kidneys, ICs were absent from the nephrogenic zone of the cortex. In the 36 week-gestation fetal kidney, the abundance of ICs and their subtypes in the inner and outer medullae was found to be similar to that of the mid gestation kidney (Figures 3 and 4). Although the proportion of Type A ICs in the inner medullary CD remained similar to the mid gestation kidney (97.1% of ICs), the abundance of type A ICs in the outer medullary CD increased to 78.4% of ICs. In the cortical CD, which is more developed than previous gestations but has not yet fully differentiated, the fraction of type A ICs remained unchanged; however, the total number of ICs doubled to 3.3% of CD cells. Unfortunately, type B or non-A non-B ICs could not be observed in the normal 36-week CD. This was because of a lack of pendrin staining, and likely results from issues with tissue processing of the limited samples available rather than an absence of the ICs or a lack of sensitivity of the pendrin antibody.
Figure 4.
ICs in the mid to late gestation human fetal kidney. In the 26-week kidney (A and B), type A ICs (arrowheads) predominate. Type B ICs (arrows) are first observed in the cortical CD at this age (B). In the 36-week gestation fetal kidney (C and D), a mix of type A (arrowheads), type B, and immature ICs is observed in both the outer medullary (C) and cortical (D) CD. Stains: red, vATPase; green, RhCG (A, C, and D) or pendrin (B); blue, DAPI. Scale Bars: A–D, 25 μm.
The Postnatal Kidney
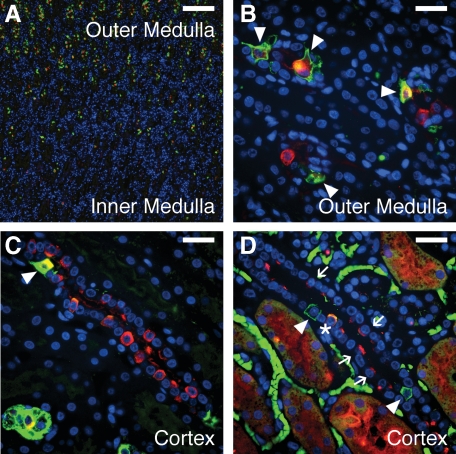
In the postnatal kidney, the distribution of ICs changed dramatically compared with the fetal kidney, and has differentiated to resemble that of adult CD. As in the adult kidneys of most species, ICs were rare in the inner portions of the inner medulla (Figures 3 and 5, A–D). Throughout the outer medulla, and compared with the 36 week gestation kidneys, the IC population nearly tripled to 11.0% of CD cells with type A ICs comprising 70% of ICs (Table 1). Surprisingly, type B or non-A non-B ICs were not observed. As expected, the most significant change in IC abundance in the postnatal kidney occurred in the cortical CD. In this segment, the total number of ICs increased almost 10-fold to 32.8% of CD cells. It is at this time point that the pendrin-positive type B and non-A non-Bs ICs become the most abundant differentiated ICs (29.4 and 8.9% of ICs respectively) while the proportion of differentiated type A ICs decreased (6.9% of ICs). Surprisingly, a large proportion of ICs retained an immature phenotype (54.8% of ICs), indicating that the postnatal remodeling of the CD epithelium was still in progress one year after birth.
Figure 5.
ICs in the postnatal human kidney. At 1 year postnatally, ICs were lost in the inner medullary CD (A) but persisted in the outer medullary CD with type A predominating (arrowheads in B). In the postnatal cortex (C and D), the abundance of ICs increased dramatically with type A (arrowheads), type B (arrows), and non-A non-B ICs (asterisk) present. Stains: red, vATPase (A–C) or pendrin (D); green, RhCG; blue, DAPI. Scale bars: A, 200 μm, B–D, 25 μm.
The Connecting Tubule
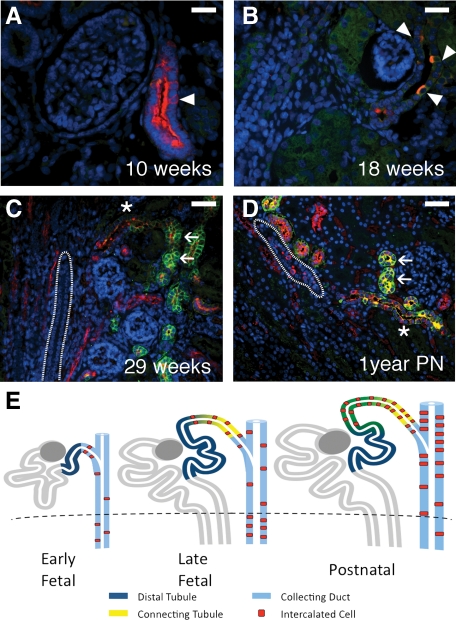
The connecting tubule is a unique segment of the nephron intermediary to the metanephric mesenchyme–derived distal convoluted tubule and the ureteric bud–derived cortical CD. In the 10-week gestation kidney, the tubules of the distal nephron express uniform apical vATPase with rare juxtamedullary segments displaying interspersed cells containing more abundant and cytoplasmic vATPase expression (Figure 6, A–E). These strongly vATPase-positive cells resemble the immature ICs of the collecting duct, described in the early gestation kidney, and suggest that these tubular segments represent the nascent connecting tubule. In kidneys of 18 weeks gestation and older, the connecting tubule could be distinguished from the distal convoluted tubule (expressing apical vATPase and strong membranous RhCG) by the appearance of defined and abundant ICs. As the connecting tubule nears its point of intersection with the cortical CD, ICs persist, whereas the expression of vATPase and RhCG in non-ICs fades, similar to that observed in the CD.
Figure 6.
The connecting tubule. At 10 weeks gestation, rare nephron segments can be observed resembling the distal tubule, which expresses uniform apical vATPase expression, but which contained isolated cells with stronger vATPase expression characteristic of ICs (arrowheads in A). These ducts may represent the earliest formations of the distal nephron and specifically, of the connecting tubule. By 18 weeks, ICs (arrowheads in B) became more distinct. By 29 weeks (C), and through 1 year postnatal development (D), the connecting tubule (asterisk) can be clearly identified as a transition segment between the distal tubule (arrows) and the CD (outline). The connecting tubule appears to represent a progressive overlapping of the mesenchymally-derived distal tubule and ureteric bud-derived CD with ICs derived from the latter, as depicted in (E). Stains: red, vATPase; green, RhCG; blue, DAPI. Scale bars: A–B, 25 μm; C–D, 50 μm.
The Obstructed Human Fetal Kidneys
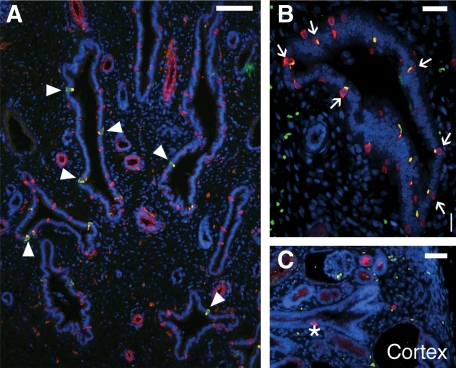
Observed collecting ducts from obstructed 18-week gestation kidneys exhibited an increase in IC fraction per duct to 6.0% of CD cells from 3.9% in age-matched control (Table 2). In early kidneys and in medullary CDs with mild to moderate dilatation, these ducts also exhibited an increased proportion of differentiated ICs (Figure 7, A–C) expressing RhCG and pendrin immunoreactivity, in contrast to age-matched controls. In addition to an increase in type A cells (33.1% of ICs from 8.4% in age-matched control), these results demonstrate the novel presence of medullary type B (23% of ICs) and non-A non-B ICs (7.0%) that were not observed in the normal fetal medullary CDs at any fetal age. These results suggest an accelerated differentiation of the medullary CD in response to urinary tract obstruction.
Table 2.
Abundance of IC Subtypes during Obstruction
| % of CD cells Total ICs | % of ICs (% of CD cells ± standard deviation)
|
||||
|---|---|---|---|---|---|
| Type A | Type B | Non-A non-B | Immature | ||
| 18 weeks | |||||
| Control | 3.9 ± 1.4 | 8.4 (0.3 ± 0.5) | 0 | 0 | 91.6 (3.5) |
| Obstructed | 6.0 ± 2.8 | 33.1 (2.0 ± 1.8) | 23 (1.4 ± 1.2) | 7.0 (0.4 ± 0.7) | 36.9 (2.2) |
| 36 weeks | |||||
| Control | 5.7 ± 2.7 | 92.9 (5.3 ± 2.8) | * | * | 7.1 (0.4) |
| Obstructed | 10.8 ± 6.2 | 68.8 (7.4 ± 6.0) | 5.1 (0.5 ± 0.9) | 7.1 (0.8 ± 1.0) | 19.0 (2.1) |
| 1 year postnatal | |||||
| Control | 10.7 ± 6.2 | 70.2 (7.5 ± 4.8) | 0 | 0 | 29.8 (3.2) |
| Obstructed | 3.8 ± 4.8 | 70.8 (2.7 ± 4.2) | 1.0 (0.04 ± 0.2) | 0 | 28.2 (1.1) |
ICs fractions expressed as percentage of CD cells ± standard deviation. Numbers in bold express IC subtypes as a percentage of total ICs. Immature cells are calculated as percent of total cells minus Type A, B and non-A non-B subtypes and therefore have no standard deviations.
Pendrin-positive cells not observed in 36-week gestation kidney.
Figure 7.
ICs in the early obstructed human fetal kidney. At 18 weeks gestation, an increase in IC fraction can be observed (A and B). Furthermore, unlike the normal 18-week gestation kidneys, where immature ICs predominate, differentiated type A (arrowheads) and type B (arrows) ICs can be observed in medullary CDs of the obstructed kidney. ICs are also observed in the cortical CD (asterisk) near the nephrogenic zone highlighting premature differentiation of ICs in the region (C). Stains: red, vATPase (A and C) or pendrin (B); green, RhCG; blue, DAPI. Scale bar: A, 100 μm; B, 25 μm; C, 50 μm.
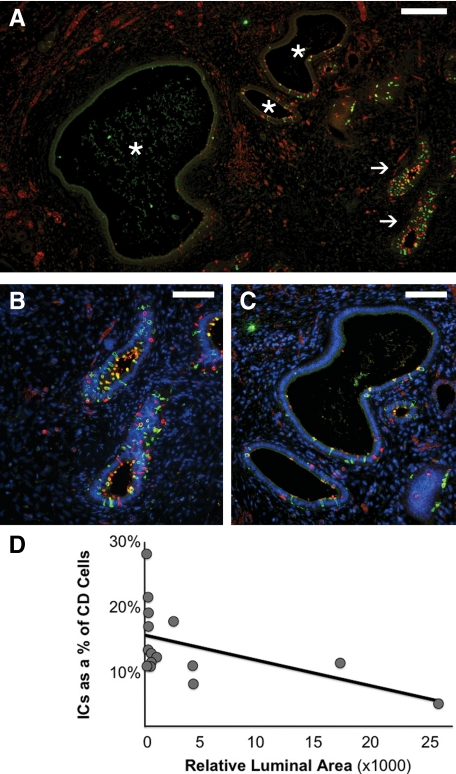
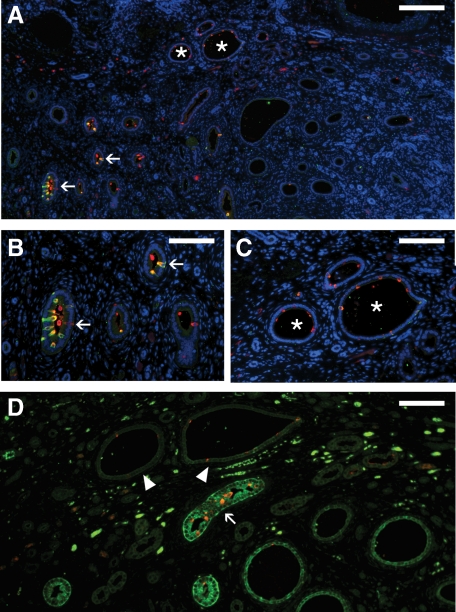
Overall, obstructed kidneys studied at 36 weeks gestation also showed an increased fraction of total ICs when compared with controls, similar to that seen in the early gestation kidneys (10.8% of CD cells versus 5.7% in age-matched control; Table 2, Figure 8, A–D). Although the majority of medullary ICs remained type A ICs (68.8% of ICs), this increase in total ICs was also accompanied by the unexpected presence of differentiated type B (5.1% of ICs) and non-A non-B cells (7.1% of ICs) in the medullary CD. However, late gestation kidneys displayed heterogeneous histopathology ranging from mild to severe injury; severe injury included increased tubular dilatation and interstitial expansion, with altered cellular morphology and peritubular collar formation, as previously described.10 In this study, IC fraction varied inversely with the degree of duct dilatation, a quantifiable surrogate measure of injury (Figure 8).
Figure 8.
ICs in the late gestation obstructed fetal kidney. As with the early gestation obstructed kidney, mildly affected CDs of the 36-week gestation obstructed fetal kidney (arrows in A, magnified in B) exhibit an increase in IC fraction. However, more severely dilated CDs displayed decreased IC abundance (asterisks in A, magnified in C). In the late gestation fetal kidney, injury and progressive dilation of the obstructed CD (measured as relative luminal surface area in pixels), correlated with a progressive decline in the relative number of intercalated cells in the CD (D; R2 = 0.255). Stains: red, vATPase; green, RhCG; blue, DAPI. Scale bars: A, 200 μm; B–C, 100 μm.
In the congenitally obstructed kidneys studied postnatally, ICs were less abundant in the outer medullary CD than in age-matched controls (3.8% of CD cells versus 10.7% in age-matched control; Table 2). As in obstructed kidneys studied during fetal gestation, some mildly affected CDs exhibited increased IC abundance whereas dilated CDs exhibited a depletion of ICs (Figure 9, A–D). As with the normal postnatal kidney, differentiated type A ICs were predominant in the medullary CD (70.8% of ICs versus 70.2% in age-matched control), whereas rare type B ICs (1.0% of ICs) were observed in the medullary CD despite being absent from the normal postnatal kidney. Furthermore, the expression of aquaporin 2 was also disrupted in more severely injured, dilated CDs indicating that in addition to IC depletion, these ducts also demonstrate a loss of principal cell function.
Figure 9.
ICs in the postnatal obstructed fetal kidney. As with the 36-week kidney, some mildly affected CDs in the obstructed postnatal kidney displayed abundant ICs (arrows in A, magnified in B), whereas more severely affected, dilated CDs exhibited a depletion of ICs (asterisks in A, magnified in C). Correspondingly, dilated CDs exhibiting IC depletion (arrowheads) also demonstrated a significant decrease in aquaporin-2 expression compared with mildly affected CDs (arrow). Stains: red, vATPase; green, RhCG; blue, DAPI. Scale bars: A, 200 μm; B–D, 100 μm.
Discussion
Congenital urinary tract obstruction affects normal kidney development and is associated with tubular injury.8 In both humans and in our previously described non-human primate model,10 urinary tract obstruction results in significant CD dilatation, the formation of peritubular collars, fibrosis of the adjacent interstitium, and phenotypic changes to the epithelium.10,26 In addition, obstruction in both models results in a reduction of ICs from 18% to 8% of CD cells in the term nonhuman primate, and 10.7 to 3.8% in the postnatal human, indicating a change in the cell composition and therefore in the function of these tubular segments.
Although fetal urinary tract obstruction has been studied in a number of experimental models,26,27,28,29,30,31,32,33,34 little is known about its effects on the development and differentiation of the CD and its differentiated cell types in human fetuses. In fact, little is know about the ontogeny of these functional cell types, particularly ICs, in the human fetal kidney. The current study defines the origins, distribution, and maturation of ICs in the CDs of the normal human fetal kidney and identifies how congenital obstruction alters this development.
Most of our knowledge of fetal kidney IC development derives from studies in rodents.20,35,36 Unlike human nephrogenesis, which is completed in utero, renal development in the rodent continues into the early postnatal period. In the mouse and rat, immature ICs first appear in the medullary CD and connecting tubule early in kidney development (E10.5 to 11.0 days) with type A cells being the first differentiated subtype to appear, and type B and non-A non-B cells emerging near the end of fetal gestation (E21 days). Of note, ICs are not observed in the rodent cortical CD at any fetal age, and it has been suggested that the ICs of the ureteric bud–derived medullary CD and metanephric mesenchyme–derived connecting tubule may arise independently.20 In the final stages of rodent nephrogenesis, which occurs postnatally, ICs are observed in the cortical CD and subsequently are lost from the papillary inner medullary CD.
In the current study of normal human nephrogenesis, spatial and temporal changes can be observed both in the distribution of ICs, and in their differentiation into mature subtypes. ICs first appear in the inner medulla at 8 weeks gestation and progressively differentiate in the outer medulla and inner cortex in later gestation. However, unlike the postnatal and adult kidney, ICs in the fetal kidney remain most abundant in the inner medulla, with low abundance in the outer medulla and most differentiated regions of the inner cortex. ICs are not observed in the nephrogenic zone or the differentiating region of the outer cortex. Initially, ICs are identified solely by their vATPase expression but lack the expression of other important functional transporters. These ICs likely represent an immature or undifferentiated IC. Type A ICs are the first differentiated subtype observed, as early as 14 weeks gestation, and remain the predominant IC of the inner medulla throughout fetal development. Type B and non-A non-B ICs are not observed until 26 or 36 weeks, respectively, and are restricted to the cortex. Postnatally, the distribution of ICs changes dramatically. Similar to other species, the ICs of the inner medulla are lost while the abundance of ICs in the cortex increases dramatically.14,22,23,24,25 Surprisingly, a large proportion of these newly acquired cortical ICs appear exhibit an undifferentiated or immature phenotype, suggesting that even at one year after birth the renal CD system continues to undergo significant remodeling.
Our description of human fetal kidney IC development parallels that described previously in the mouse and rat, with a few notable exceptions. First, type B and non-A non-B ICs were not observed in the normal human medullary CD at any gestational age, or in the early postnatal period. Second, although ICs do not appear in the rodent cortical CD until late in development, rare ICs can be observed in the human cortical CD at 18 weeks, highlighting the ability of the less differentiated cortical CD to develop ICs. Third, in the human fetal kidney the appearance of a distinct connecting tubule segment in the juxtamedullary region of the inner cortex with ICs occurs at approximately the same time as, and adjacent to, the appearance of ICs in the cortical CD. The lack of a clear delineation between each segment of the distal nephron supports previous descriptions of a gradual transition and mixing of tubular segments in the distal nephron of rat, mouse and human (Figure 6E).37,38,39,40 The connecting tubule therefore represents a hybrid segment composed of elements from the adjacent metanephric mesenchyme–derived distal tubule and ureteric bud–derived CD, with the latter nephron segment the mostly likely source of ICs.
Extensive phenotypic changes occur in the CD epithelium of the obstructed fetal kidney. In addition to previously described changes, the fraction of ICs increased in early gestation CDs with mild obstruction. However, as our previous nonhuman primate studies have demonstrated a decrease in CD mass after obstruction,30 this increased IC density is unlikely attributable to an overall increase in IC number throughout the whole kidney. Furthermore, after mild obstruction ICs extend further into the developing cortex. The increased fraction of ICs and IC subtypes may signify a compensatory mechanism to maintain acid-base homeostasis despite a decrease in CD mass and therefore overall IC number. Alternately, the increased IC fraction may be the result of a selective loss of adjacent CD principal cells. In the late gestation and more severely affected kidneys, overall ICs are more abundant but are depleted in the most severely dilated CDs. Together, these results appear to suggest that the CD epithelium undergoes premature remodeling response to congenital obstruction.
The impact of this early CD remodeling on further fetal kidney development, and in particular on ureteric bud branching, is unknown. However, premature epithelial maturation and remodeling may occur at the expense of branching morphogenesis and subsequent nephrogenesis. With ductal dilatation and when epithelial integrity is threatened, differentiated functions of the tubule, including IC function, may be lost in favor the formation of peritubular muscular collars and phenotypic changes of the epithelium as described previously in nonhuman primates.10
Footnotes
Address reprint requests to Douglas G. Matsell, M.D.C.M., Division of Nephrology, BC Children’s Hospital, 4480 Oak Street, Room K4-150, Vancouver, British Columbia, Canada V6H 3V4. E-mail: dmatsell@cw.bc.ca.
Supported by grants from the Kidney Foundation of Canada (to D.G.M.), the Canadian Institutes of Health Research (to D.G.M.), and NIH grants #HL085036 (to A.F.T.) and base operating grant #RR00169 (to A.F.T.).
This work has been presented in part at the 41st Annual Meeting of the American Society of Nephrology, November 2008.
References
- Anumba DO, Scott JE, Plant ND, Robson SC. Diagnosis and outcome of fetal lower urinary tract obstruction in the northern region of England. Prenat Diagn. 2005;25:7–13. doi: 10.1002/pd.1074. [DOI] [PubMed] [Google Scholar]
- Hayden SA, Russ PD, Pretorius DH, Manco-Johnson ML, Clewell WH. Posterior urethral obstruction. Prenatal sonographic findings and clinical outcome in fourteen cases, J Ultrasound Med. 1988;7:371–375. doi: 10.7863/jum.1988.7.7.371. [DOI] [PubMed] [Google Scholar]
- Nakayama DK, Harrison MR, de Lorimier AA. Prognosis of posterior urethral valves presenting at birth. J Pediatr Surg. 1986;21:43–45. doi: 10.1016/s0022-3468(86)80651-0. [DOI] [PubMed] [Google Scholar]
- Thomas DF, Irving HC, Arthur RJ. Pre-natal diagnosis: how useful is it? Br J Urol. 1985;57:784–787. doi: 10.1111/j.1464-410x.1985.tb07054.x. [DOI] [PubMed] [Google Scholar]
- Mahony BS, Callen PW, Filly RA. Fetal urethral obstruction: uS evaluation. Radiology. 1985;157:221–224. doi: 10.1148/radiology.157.1.3898218. [DOI] [PubMed] [Google Scholar]
- Parkhouse HF, Barratt TM, Dillon MJ, Duffy PG, Fay J, Ransley PG, Woodhouse CR, Williams DI. Long-term outcome of boys with posterior urethral valves. Br J Urol. 1988;62:59–62. doi: 10.1111/j.1464-410x.1988.tb04267.x. [DOI] [PubMed] [Google Scholar]
- Chevalier RL. Molecular and cellular pathophysiology of obstructive nephropathy. Pediatr Nephrol. 1999;13:612–619. doi: 10.1007/s004670050756. [DOI] [PubMed] [Google Scholar]
- Chevalier RL, Goyal S, Kim A, Chang AY, Landau D, LeRoith D. Renal tubulointerstitial injury from ureteral obstruction in the neonatal rat is attenuated by IGF-1. Kidney Int. 2000;57:882–890. doi: 10.1046/j.1523-1755.2000.057003882.x. [DOI] [PubMed] [Google Scholar]
- Chevalier RL, Thornhill BA, Wolstenholme JT, Kim A. Unilateral ureteral obstruction in early development alters renal growth: dependence on the duration of obstruction. J Urol. 1999;161:309–313. [PubMed] [Google Scholar]
- Butt MJ, Tarantal AF, Jimenez DF, Matsell DG. Collecting duct epithelial-mesenchymal transition in fetal urinary tract obstruction. Kidney Int. 2007;72:936–944. doi: 10.1038/sj.ki.5002457. [DOI] [PubMed] [Google Scholar]
- Saxen L. Cambridge: Cambridge University Press,; Organogenesis of the Kidney. 1987 [Google Scholar]
- Madsen KM, Tisher CC. Structural-functional relationship along the distal nephron. Am J Physiol. 1986;250:F1–F15. doi: 10.1152/ajprenal.1986.250.1.F1. [DOI] [PubMed] [Google Scholar]
- Alper SL, Natale J, Gluck S, Lodish HF, Brown D. Subtypes of intercalated cells in rat kidney collecting duct defined by antibodies against erythroid band 3 and renal vacuolar H+-ATPase. Proc Natl Acad Sci USA. 1989;86:5429–5433. doi: 10.1073/pnas.86.14.5429. [DOI] [PMC free article] [PubMed] [Google Scholar]
- Teng-umnuay P, Verlander JW, Yuan W, Tisher CC, Madsen KM. Identification of distinct subpopulations of intercalated cells in the mouse collecting duct. J Am Soc Nephrol. 1996;7:260–274. doi: 10.1681/ASN.V72260. [DOI] [PubMed] [Google Scholar]
- Wall SM, Hassell KA, Royaux IE, Green ED, Chang JY, Shipley GL, Verlander JW. Localization of pendrin in mouse kidney. Am J Physiol Renal Physiol. 2003;284:F229–F241. doi: 10.1152/ajprenal.00147.2002. [DOI] [PubMed] [Google Scholar]
- Weiner ID, Hamm LL. Regulation of intracellular pH in the rabbit cortical collecting tubule. J Clin Invest. 1990;85:274–281. doi: 10.1172/JCI114423. [DOI] [PMC free article] [PubMed] [Google Scholar]
- Verlander JW, Miller RT, Frank AE, Royaux IE, Kim YH, Weiner ID. Localization of the ammonium transporter proteins RhBG and RhCG in mouse kidney. Am J Physiol Renal Physiol. 2003;284:F323–F337. doi: 10.1152/ajprenal.00050.2002. [DOI] [PubMed] [Google Scholar]
- Fejes-Toth G, Naray-Fejes-Toth A. Differentiation of renal beta-intercalated cells to alpha-intercalated and principal cells in culture, Proc Natl Acad Sci USA. 1992;89:5487–5491. doi: 10.1073/pnas.89.12.5487. [DOI] [PMC free article] [PubMed] [Google Scholar]
- Fejes-Toth G, Naray-Fejes-Toth A. Differentiation of intercalated cells in culture. Pediatr Nephrol. 1993;7:780–784. doi: 10.1007/BF01213359. [DOI] [PubMed] [Google Scholar]
- Song HK, Kim WY, Lee HW, Park EY, Han KH, Nielsen S, Madsen KM, Kim J. Origin and fate of pendrin-positive intercalated cells in developing mouse kidney. J Am Soc Nephrol. 2007;18:2672–2682. doi: 10.1681/ASN.2006101076. [DOI] [PubMed] [Google Scholar]
- Holthofer H. Ontogeny of cell type-specific enzyme reactivities in kidney collecting ducts. Pediatr Res. 1987;22:504–508. doi: 10.1203/00006450-198711000-00005. [DOI] [PubMed] [Google Scholar]
- Hansen GP, Tisher CC, Robinson RR. Response of the collecting duct to disturbances of acid-base and potassium balance. Kidney Int. 1980;17:326–337. doi: 10.1038/ki.1980.38. [DOI] [PubMed] [Google Scholar]
- Kaissling B, Kriz W. Structural analysis of the rabbit kidney. Adv Anat Embryol Cell Biol. 1979;56:1–123. doi: 10.1007/978-3-642-67147-0. [DOI] [PubMed] [Google Scholar]
- LeFurgey A, Tisher CC. Morphology of rabbit collecting duct. Am J Anat. 1979;155:111–124. doi: 10.1002/aja.1001550108. [DOI] [PubMed] [Google Scholar]
- Clapp WL, Madsen KM, Verlander JW, Tisher CC. Intercalated cells of the rat inner medullary collecting duct. Kidney Int. 1987;31:1080–1087. doi: 10.1038/ki.1987.111. [DOI] [PubMed] [Google Scholar]
- Tarantal AF, Han VK, Cochrum KC, Mok A, daSilva M, Matsell DG. Fetal rhesus monkey model of obstructive renal dysplasia. Kidney Int. 2001;59:446–456. doi: 10.1046/j.1523-1755.2001.059002446.x. [DOI] [PubMed] [Google Scholar]
- Josephson S, Robertson B, Claesson G, Wikstad I. Experimental obstructive hydronephrosis in newborn rats. I Surgical technique and long-term morphologic effects. Invest Urol. 1980;17:478–483. [PubMed] [Google Scholar]
- Beck AD. The effect of intra-uterine urinary obstruction upon the development of the fetal kidney. J Urol. 1971;105:784–789. doi: 10.1016/s0022-5347(17)61629-x. [DOI] [PubMed] [Google Scholar]
- Steinhardt GF, Vogler G, Salinas-Madrigal L, LaRegina M. Induced renal dysplasia in the young pouch opossum. J Pediatr Surg. 1988;23:1127–1130. doi: 10.1016/s0022-3468(88)80327-0. [DOI] [PubMed] [Google Scholar]
- Matsell DG, Mok A, Tarantal AF. Altered primate glomerular development due to in utero urinary tract obstruction. Kidney Int. 2002;61:1263–1269. doi: 10.1046/j.1523-1755.2002.00274.x. [DOI] [PubMed] [Google Scholar]
- McVary KT, Maizels M. Urinary obstruction reduces glomerulogenesis in the developing kidney: a model in the rabbit. J Urol. 1989;142:646–651. doi: 10.1016/s0022-5347(17)38843-2. discussion 667–648. [DOI] [PubMed] [Google Scholar]
- Javadpour N, Graziano MF, Terrill R. Experimental induction of patent allantoic duct by intrauterine bladder outlet obstruction. J Surg Res. 1974;17:341–345. doi: 10.1016/0022-4804(74)90141-3. [DOI] [PubMed] [Google Scholar]
- Dissing TH, Eskild-Jensen A, Pagh C, Frokiaer J, Rehling M, Jorgensen HS, Jorgensen TM, Djurhuus JC. Partial unilateral ureteropelvic junction obstruction induced in 2-week-old piglets. J Urol. 2001;166:2354–2358. [PubMed] [Google Scholar]
- Berman DJ, Maizels M. The role of urinary obstruction in the genesis of renal dysplasia. A model in the chick embryo. J Urol. 1982;128:1091–1096. doi: 10.1016/s0022-5347(17)53351-0. [DOI] [PubMed] [Google Scholar]
- Kim J, Kim YH, Cha JH, Tisher CC, Madsen KM. Intercalated cell subtypes in connecting tubule and cortical collecting duct of rat and mouse. J Am Soc Nephrol. 1999;10:1–12. doi: 10.1681/ASN.V1011. [DOI] [PubMed] [Google Scholar]
- Kim J, Tisher CC, Madsen KM. Differentiation of intercalated cells in developing rat kidney: an immunohistochemical study. Am J Physiol. 1994;266:F977–F990. doi: 10.1152/ajprenal.1994.266.6.F977. [DOI] [PubMed] [Google Scholar]
- Crayen ML, Thoenes W. Architecture and cell structures in the distal nephron of the rat kidney. Cytobiologie. 1978;17:197–211. [PubMed] [Google Scholar]
- Kaissling B. Structural aspects of adaptive changes in renal electrolyte excretion. Am J Physiol. 1982;243:F211–F226. doi: 10.1152/ajprenal.1982.243.3.F211. [DOI] [PubMed] [Google Scholar]
- Myers CE, Bulger RE, Tisher CC, Trump BF. Human ultrastructure. IV Collecting duct of healthy individuals, Lab Invest. 1966;15:1921–1950. [PubMed] [Google Scholar]
- Woodhall PB, Tisher CC. Response of the distal tubule and cortical collecting duct to vasopressin in the rat. J Clin Invest. 1973;52:3095–3108. doi: 10.1172/JCI107509. [DOI] [PMC free article] [PubMed] [Google Scholar]


