

Abstract
To investigate how cardiomyocytes change their length, echocardiographic and morphological studies were performed on rabbit hearts that were subjected to volume overload, overload removal, and repeated cycles of overload and overload removal. These conditions were created by arterio-venous fistula between the carotid artery and jugular vein, closure of the fistula, and cycles of repeatedly forming and closing fistula, respectively. After overload, hearts dilated and myocytes elongated. Intercalated disks repeatedly broadened and narrowed with a 2-day cycle, which continued for 8 weeks in many animals. The cycle consisted of shifts between five modes characterized by two interdigitation elongation-and-shortenings as follows: (I) flat with short (∼1/4 to ∼1/3 sarcomere long) interdigitations; (II) flat with long (one sarcomere long) interdigitations; (III) grooved with short interdigitations; (IV) grooved with long interdigitations; (V) flat with short interdigitations intermingled by sporadic long interdigitations; and return to (I). After overload removal, hearts contracted and myocytes shortened with similar 2-day broadening and narrowing cycle of intercalated disks, in which the five modes were reversed. Repeated overload and overload removal resulted in the repetition of myocyte elongation and shortening. We hypothesize that a single elongation-and-shortening event creates or disposes one sarcomere layer, and the two consecutive elongation-and-shortenings occur complementarily to each other so that the disks return to their original state after each cycle. Our hypothesis predicts that intercalated disks weave and unravel one sarcomere per myocyte per day.
The heart is known to dilate and contract depending on its volume load.1,2,3 Various experimental means of volume overload, such as aorto-caval fistula,2,4,5,6,7,8,9 arterio-venous fistula (AVF) between carotid artery and jugular vein,10 aortic insufficiency,11 and mitral regurgitation,12,13 have been shown to induce distinct eccentric hypertrophy. These reports suggested that the left ventricle enlarged 4% to 28% and dilated ∼14% at 1 week after volume overload. At the cellular level, cardiac dilatation and constriction are consistent with the elongation and shortening of individual myocytes, respectively. Because myocytes consist of an integral number of sarcomeres, the length of which is same at all ages and in a wide variety of animals (∼2 μm),1 myocyte elongation is attained by the assembly of sarcomeres in series, and its shortening is attained by their disposal. It is assumed that myocytes, which is known ∼60-sarcomere-long in adult human hearts,14 gain a considerable number of sarcomeres within 1 week after overload.
It is known that the rate of myosin heavy chain synthesis increased measurably after 6 hours of severe pressure overload, but did not increase after 6 hours of severe volume overload.15 Volume overload was not suspected to trigger substantial increases in the rate of myosin heavy chain synthesis, but primarily to stimulate a decrease in the rate of the protein degradation to induce a later modest increase in left ventricular mass.12 Decreased expression of stimulatory guanine nucleotide regulatory proteins and decreased or unchanged expression of inhibitory guanine nucleotide regulatory proteins were shown in volume-overloaded rat hearts.7 Volume overload after atrio-ventricular block caused a transient compromise of cytoskeletal integrity on transcriptional down-regulation.16 It seems that stimulation of protein synthesis after volume overload is not sufficient to explain the rather distinct enlargement and dilatation of volume-overloaded hearts. Recently both chaperon and ubiquitin proteasome systems appear to be necessary to balance the dynamics of protein synthesis and degradation in the heart, but it is unclear how these systems work during volume load change.17
The intercalated disk (ICD) in the mammalian heart is a complicated steplike intercellular junction between two adjacent myocytes with alternating transversely and longitudinally oriented portions.18,19,20 The cell surfaces in transverse portions are deeply interdigitated; however, the nature of the interdigitation is still uncertain. It is well known that ICDs have three kinds of junctions: desmosomes, fasciae adherens, and gap junctions. Long before the invention of the electron microscope, when the nature of ICD was still obscure, Heidenhain21 proposed that the ICD contributed to the growth of new sarcomeres (1901). He hypothesized that, because hearts grew very proportionally, the smallest unit element, which was myocardial fiber, grew very proportionally and harmoniously. If new sarcomere formation were allowed to occur randomly in any place in the myocardial fiber, the myocardial fiber would be irregular and not be like the myocardial fiber he observed. He concluded that the terminal of the myocardial fiber, which was consistent with the ICD, should contribute to new sarcomere formation. He considered that when ICDs, consisting of a line of rod-shaped bacilli-like structure (following his original description) of usually less than 2 μm thick (less than one-sarcomere long), eventually widened more than one sarcomere long, new sarcomeres appeared. Considering that his rod-shaped bacilli-like structure corresponds to “interdigitation,” his proposal is interpreted as the elongation of the interdigitation contributing to new sarcomere formation.
Until now, only a few ultrastructural studies have been conducted regarding the nature of interdigitation of ICDs,19,22,23,24 whereas many studies have focused on their junctions. Widened ICDs, which would be due to elongation of the interdigitation, and multiple ICDs, in which two, three, or four ICDs lie along the same myofibrils within 10 sarcomeres, have been known to appear with cardiac hypertrophy,22,24,25,26 normal growth,23 and mutant mice.27 Many of these studies suggested a probable relationship between ICD structure and new sarcomere formation. Recently, two impressive reports regarding ICDs and sarcomerogenesis in vitro and in vivo have been published. First, Yu and Russell28 found focal abnormal weakly stained or intensely stained disruptions of sarcomeres after unilateral static strain in vitro after 4 hours. They found that, after mechanical strain, myocytes were coupled by thicker adherent junctions that had many zigzags, sharp turns, and a high degree of convolution, whereas the contact between cells was relatively straight in the unstretched myocytes. They suggested that myocytes from neonatal rat hearts remodel by insertion of new sarcomeres throughout the cell length and also suggested that the zigzag pattern of the ICDs might correlate with new sarcomere appearance and yield progressive lengthening at the end of the cell. Secondly, Bennet et al29 proposed a new functional subcellular domain at the ICD, “transitional junction,” providing a means for sarcomeres to be added to the ends of the cells during growth.
Considering distinct myocyte elongation after volume overload, presumed preservation of basic molecular synthesis after volume overload, and the probable contribution of ICDs to the new sarcomere formation together, we speculate that volume overload-induced new sarcomere assembly occurs progressively, is not basically related to the major part of myocytes, and is closely related to ICDs. If ICDs may contribute to the elaboration of sarcomere assembly, they would change their configuration corresponding to their contribution. After several rounds of sarcomere assembly, which might usually occur after volume overload, ICDs would progressively accumulate changes in their configuration. However, many ICDs are mostly simple18,19,20 and their divergence is occasional widening22,23 and very occasional multiplication.22,25,26 Therefore, it is suggested that ICDs have some mechanism to neutralize supposed accumulated changes in configuration during repeating sarcomere assembly.
Here, we report periodic broadening and narrowing of ICDs of 2-day cycle during volume overload and overload removal of overloaded hearts in rabbits. Volume overload and overload removal were performed by creating an AVF between common carotid artery and jugular vein and by the closure of the AVF, respectively. Ultrastructural observations revealed that this 2-day cycle consists of two-time elongation and shortening of the interdigitations. Molecular investigations of some chaperons and ubiquitin ligase, which are known to contribute to the dynamic sarcomere preservation,17 reveals that they were constantly expressed in the same level during the 2-day cycle. We hypothesize that, while all sarcomeres in the body of myocytes are kept constant in dynamic equilibrium, the elongation and shortening of the interdigitations creates or disposes one sarcomere layer, and two consecutive elongation and shortenings occur complementarily to each other so that ICDs return to their original state after each cycle. We consider ICDs to be the weaving machinery for sarcomere assembly and disposal, using retractile interdigitations to adapt volume load changes.
Materials and Methods
Animals and Operation
Four hundred and twenty adult male Japanese white rabbits (3 to 5 kg) were used in this study. AVF creation between left common carotid artery and jugular vein was used as an experimental model, with which volume overload was allowed as AVF,30,31,32,33 and overload removal was allowed as AVF closure.34,35,36,37 Animal care followed the Japanese Community Standard on the Care and Use of Laboratory Animals. The Animal Research Committee at the Akita University School of Medicine approved the protocols for animal experimentation. All subsequent animal experiments adhered to the Guidelines for Animal Experimentation of the University.
Volume Overload
Animals (n = 233) were subjected to a series different periods of AVF opening from 1 hour to over 30 weeks (Figure 1A). Each group included more than three animals. Twenty-one animals were used as nonoperated control.
Figure 1.

Experimental schedule.
Overload Removal
Animals (n = 137) were subjected to a certain period of AVF opening (2-day, 3-day, 4-day, 4-week) followed by a certain period of AVF closure (Figure 1B). Each group included more than three animals.
Repetitions of Volume Overload and Overload Removal
Animals (n = 26) underwent a cycle of left ventricle volume overload and overload removal, by 4 weeks of AVF opening followed by 6 weeks of AVF closure. The cycle was repeated three times. The hearts of these animals were harvested in each time point of load change as 0.5, 1.0, 1.5, 2.0, 2.5, and 3.0-cycle (Figure 1C). Each group included more than four animals. The sham-operated control group was treated three times by sham AVF operation (immediate AVF closure after AVF creation) every 10 weeks (n = 3).
Measurement of Carotid Artery Flow
Blood flow rate of the left common carotid artery proximal to the AVF was measured at the time of AVF, 10 minutes after AVF, before AVF-closure, 10 minutes after AVF-closure, and before sacrifice with electromagnetic flowmeter (MFB 2100, Nihon Kohden Co, Tokyo, Japan) as described before30,31,32,33,34,35,36,37 or transit-time flowmeter (TS420 Perivascular flow module, Transonic System Inc, Ithaca, NY).
Echocardiographic Studies
Using echocardiography (SDU-800, Shimazu Co, Kyoto, Japan), M-mode, B-mode, and Doppler echocardiography were performed with 3.75 MHz probe (S011-375) before AVF, after AVF, and several points after AVF in overloaded animals and several points after AVF-closure in overload-removed animals. Left ventricular end-diastolic diameter (Dd-mm) and end-systolic diameter (Ds-mm) were obtained by M-mode and B-mode. There are two formulas for deducing ventricle volume from lumen dimension in human heart.38,39 Because adult rabbit heart is smaller than that of human, we obtained new formula, which could deduce left ventricular volume from the left ventricular short diameter. We measured left ventricular volume (mV-ml) and short (D1-mm) and long diameter (D2-mm) of the largest left ventricular cross section (usually ellipse in shape) using consecutive 24 autopsy hearts from the start of our experiments. Luminal area of the largest cross section is πD1D2-mm2, which is compatible with assumed round lumen of √D1D2-mm diameter. When left ventricle lumen shape is assumed a prolate ellipse, left ventricular volume (V) is obtained by the volume formula of (π/6) D2 L, where L is the major diameter (long axis) and D is the minor diameter (short axis assuming round) of the left ventricle. The ratio of the actual left ventricular volume to the calculated spherical volume [(π/6) D2 L to (π/6) D3] will give the long axis to short axis diameter ratio (L/D). The relation of long axis-to-short axis lumen diameter ratio (L/√D1D2) and short axis lumen diameter (√D1D2) was plotted in Figure 2. The regression curve of short axis lumen diameter from 10 mm to 25 mm fit a two-dimensional polynomial equation of L/√D1D2 = 0.0062D1D2− 0.3111√D1D2+ 5.1662, where R2 was 0.4284. Small ventricle (√D1D2; ∼10 mm) has long and narrow chamber and large ventricle (√D1D2; ∼30 mm) has more spherical chamber. When √D1D2 is 14 mm, L/√D1D2 is ∼2 in rabbit heart, while D is 40- to 50-mm in human heart at L/D = 2.39 Therefore the rabbit heart is 1/3- to 1/4-fold miniature of human heart. The relation of left ventricular volume (V) and short axis lumen diameter (√D1D2) was plotted in Figure 3. Regression curve of short axis lumen diameter from 10 mm to 25 mm fit a two-dimensional polynomial equation of V = 0.0159D1D2+ 0.0164 √D1D2, where R2 was 0.8348 (Figure 3). Using this equation, we calculated end diastolic volume (EDV; 0.0159Dd2+ 0.0164Dd) and end systolic volume (ESV; 0.0159Ds2+0.0164Ds). Stroke volume was calculated as EDV minus ESV. Ejection fraction (EF) was calculated by SV/EDV ×100 (%). Cardiac output (CO) was obtained by SV by heart rate (HR). CO was also obtained by Doppler echocardiography (CO-Doppler).
Figure 2.
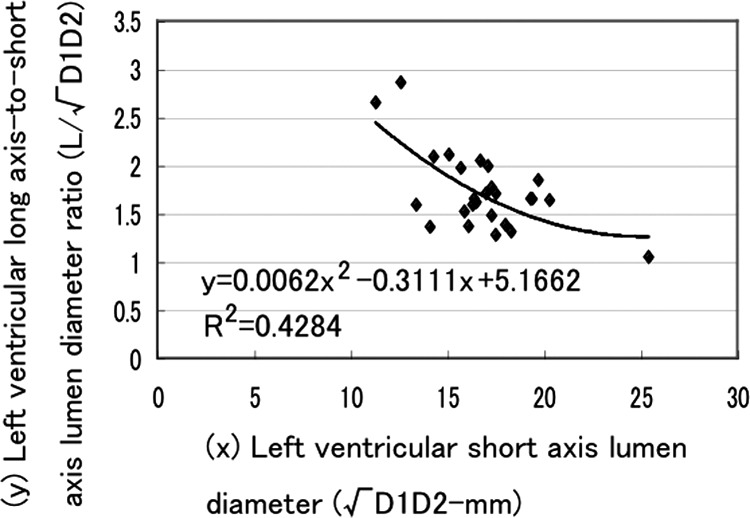
Relation between left ventricular long axis-to-short axis ratio and short axis lumen diameter.
Figure 3.
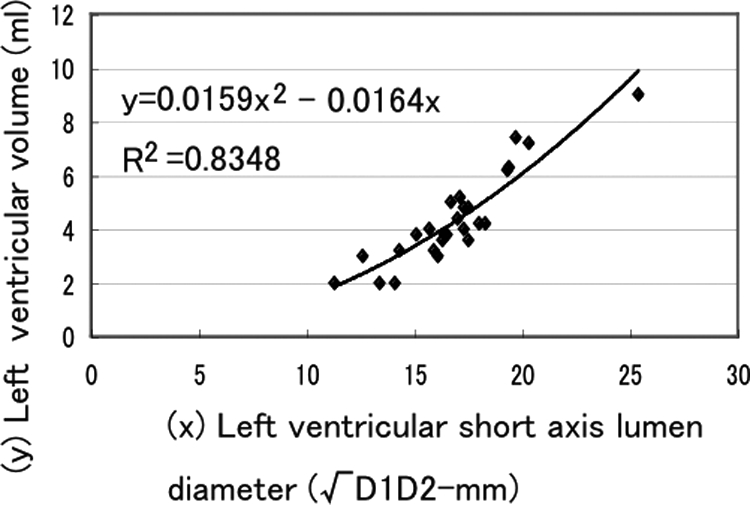
Relation between left ventricular volume and short axis lumen diameter.
Terminal Procedure
Animals were sedated and anesthetized as above during operation. After all of the examination procedures were done, animals were euthanized by overdose of pentobarbital injection (100 mg/kg) into the catheter introduced in the abdominal aorta. Animals were perfused with 2.5% glutaraldehyde solution in phosphate buffer or 4% paraformaldehyde solution in distilled water via the catheter with perfusion pressure of 100 mm Hg for 30 minutes. Hearts were then moved out and heart weight and left ventricle weight was measured. Left ventricles were post-fixed in the 2.5% glutaraldehyde solution or in the 4% paraformaldehyde solution for 24 hours.
Animals for Western blotting were not perfused fixed. Immediately after euthanasia, hearts were removed and left ventricles were sliced in cross sections (each 3 mm thick) and then the middle portions of the left ventricle were cut into pieces (∼2 mm cube), which were frozen into liquid nitrogen and stored in the deep freezer. One cross section of left ventricle in each animal was immersion fixed with 4% paraformaldehyde solution for immunofluorescent and immunohistochemical observation.
Light Microscopy, Transmission Electron Microscopy, and Immunohistochemistry
Cross sections of the left ventricle of all animals were used for ordinary light microscopic observation. One-micron thick paraffin-embedded sections were made. H&E and Azan-Mallory (Azan) stains were performed. Left ventricles of hearts, which were perfusion-fixed with 2.5% glutaraldehyde solution, were cut in pieces of cubic tissue (1 mm × 1 mm × 1 mm). They were postfixed with 2.5% glutaraldehyde solution. Ultra-thin sections stained with lead citrate and uranyl acetate were observed with transmission electron microscopy (TEM, H-7650, Hitachi Co, Tokyo, Japan).
For immunohistochemical observation, hearts perfused fixed with the 4% paraformaldehyde solution, or with 2.5% glutaraldehyde solution for 30 minutes and then quickly immersed with the 4% paraformaldehyde solution, or hearts immersed fixed with 4% paraformaldehyde solution were used. Immunohistochemical staining was performed using the high polymer method (Histofine simple stain, Nichirei Bioscience Inc, Tokyo, Japan). All procedures were implemented according to their manufacturer’s instructions. Paraffin sections were deparaffinized in xylene and rehydrated in a graded alcohol series. Antigen unmasking was performed by immersion of sections in proteinase K (Dako, Tokyo, Japan) for 20 minutes at room temperature. Endogenous peroxidase activity was quenched with hydrogen peroxide 0.3% in methanol for 30 minutes at room temperature. Sections were incubated with goat anti-N-cadherin (N-19: sc-1502; 1:500, Santa Cruz Biotechnology Inc, Santa Cruz, CA), mouse anti-myosin (M8421: skeletal, slow; 1:500, Sigma-Aldrich Co, St. Louis, MO), mouse anti-HHF35 (M0635: actin, muscle, 1:50, Dako, Tokyo, Japan), mouse anti-desmin (N-1526: ready-to-use; Dako, Tokyo, Japan), mouse anti-titin (G-H5: sc-100959; 1:50, Santa Cruz Biotechnology Inc, Santa Cruz, CA); and goat anti-nebulin (N-19: sc-8083; 1:50, Santa Cruz Biotechnology Inc, Santa Cruz, CA) antibodies for 40 minutes at room temperature, followed by incubation for 30 minutes with peroxidase-conjugated polymer reagent (Histofine simple stain; Nichirei Bioscience Inc, Tokyo, Japan). The staining was visualized with diaminobenzidine (Dako, Tokyo, Japan).
Double-label immunohistochemical staining for N-cadherin and actin (HHF35) or myosin was performed using the high polymer method and the ABC method (ABC Elite Kit; Vector Laboratories Inc, Burlingame, CA). All procedures were implemented according to their manufacturer’s instructions. Paraffin sections were deparaffinized in xylene and rehydrated in a graded alcohol series. Antigen unmasking was performed by immersion of sections in Proteinase K for 20 minutes at room temperature. Endogenous peroxidase activity was quenched with hydrogen peroxide 0.3% in methanol for 30 minutes at room temperature. Sections were incubated anti-N-Cadherin antibody for 40 minutes at room temperature, followed by incubation for 30 minutes with peroxidase-conjugated polymer reagent. The staining was visualized with diaminobenzidine. Subsequently, sections were rinsed in PBS, incubated with 10% bovine serum albumin for 20 minutes at room temperature, and then 40 minutes at room temperature with mouse anti-myosin or mouse anti-HHF35. This was followed by incubation for 30 minutes with biotinylated anti-mouse IgG (H+L) reagent (Vectastain ABC Elite Kit, Vector Laboratories Inc, Burlingame, CA), followed by incubation for 30 minutes with ABC-AP reagent (Vectastain ABC Elite Kit, Vector Laboratories Inc, Burlingame, CA) at room temperature. Finally, sections were visualized with 5-bromo-4-chloro-3-indoxyl phosphate and nitro blue tetrazolium chloride substrate system (Dako, Tokyo, Japan), rinsed in distilled water, counterstained with hematoxylin and examined microscopically.
Measurement of Myocyte Length
Myocyte length is influenced by the contractile state of heart. Even when hearts were pressure perfused at euthanasia, their contractile state varied. Because myofibrils attach ICDs forming “transitional junctions,”29 which are equivalent to the Z-band of sarcomeres, there are integral numbers of sarcomeres between ICDs. Here, we used sarcomere number between the farthest ICDs for myocyte length to avoid contraction influence, because sarcomeres are fundamental contractile units, the length of which is normally 1.81 to 2.07 μm.40 Using N-cadherin-stained sections and/or Azan-stained sections, sarcomere numbers between the farthest ICDs were calculated with differential microscopy at the magnification of objective lens of ×20 or ×40 in the longitudinal myocytes showing their nuclei. The average sarcomere number from 20 to 80 cells was obtained in each heart.
Measurement of ICD Dimensions
With TEM photographs at ×3000 magnification, which showed longitudinal cut surface of myocardium, we measured length of interdigitations, width of ICDs, and the length of sarcomeres of controls, and at 6 hours, 12 hours, 1 day, 1.5 days, and 2 days after AVF (Figure 4). To avoid the influence of the angle deviation of the cut surface to the real longitudinal plane, we used interdigitation length to sarcomere length ratio and ICD width to sarcomere length ratio, besides actual length and width. Ten interdigitations or ICDs, which demonstrated typical principal shape at each stage of overload, were measured. Average (n = 10) of interdigitation length and ICD width was shown in Figure 4.
Figure 4.

Schematic illustration of intercalated disk configuration and measurements of interdigitation length and intercalated disk width during 2 days after volume overload.
Western Blotting and Immunofluorescent Study
To observe protein expression of chaperones and ubiquitin ligases, which are known to be necessary to balance the dynamics of protein synthesis and degradation in the heart,17 we performed Western blot by using specific antibodies for Tcp1-α, a chaperon for the folding and assembling of actin, (rat anti-Tcp1-α, 91A: sc-53454; 1:400, Santa Cruz Biotechnology Inc, Santa Cruz, CA), Hsp90, a chaperon for the assembly of myosin, (goat anti-Hsp90, N-17: sc-1055; 1:300, Santa Cruz Biotechnology Inc, Santa Cruz, CA), UNC45B, a chaperon for the assembly of myosin, (H00146862-B01P: 1:500, Abnova Corporation, Taipei, Taiwan), and MuRF1, a ubiquitin ligase for recognizing and degrading troponin I, (goat anti-MuRF1, C-20: sc-27642; 1:300, Santa Cruz Biotechnology Inc, Santa Cruz, CA). Twenty-seven rabbits were used for the overload-experiments (control, 12-hour, 1-day, 1.5-day, 2-day, 2.5-day, 3-day, 3.5-day and 4-day post-AVF animals, n = 3 in each group) and 24 rabbits were used for the overload-removal experiments of 4-day-overloaded animals (12-hour-AVFclosure, 1-day-AVFclosure, 1.5-day-AVFclosure, 2-day-AVF closure, 2.5-day-AVFclosure, 3-day-AVFcolsure, 3.5-day-AVF-closure and 4-day-AVF closure, n = 3 in each group).
For Western blotting, frozen tissue samples were homogenized in lysis buffer using Ultrasonic Processor (Sonics & Materials, Inc., Newtown, CT). Equal amounts of total protein (40 μg) were loaded into 10% SDS-polyacrylamide gels, followed by electrotransfer to polyvinylidene difluoride membranes (GE Healthcare, Little Chalfont, UK). The transferred proteins were incubated with primary antibodies for 2 hours at room temperature. After incubation with horseradish peroxidase-conjugated secondary antibodies for 1 hour at room temperature, bands were visualized by enhanced chemiluminescence Western blotting detection reagents (GE Healthcare, Little Chalfont, UK). To quantify each protein, the blots were analyzed by densitometry with a one-dimensional scan software (Science Lab Image Gauge, Fujifilm Co, Tokyo, Japan), and loading differences were controlled by reprobing the blot with an antibody against glyceraldehyde-3-phosphate dehydrogenase (Santa Cruz Biotechnology Inc, Santa Cruz, CA).
For immunofluorescent study, fresh frozen tissues and 4% paraformaldehyde-fixed paraffin-embedded tissues were used, which were collected at the same time for Western blotting tissue collection. The primary antibodies of rat anti-Tcp1-α (1:50), goat anti-Hsp90 (1:50), mouse anti-UNC45B (1:50), and goat anti-MuRF1 (1:50) were used to detect the correlated protein expression in myocytes. Mouse anti-titin (1:50) and anti-myosin (1:500) primary antibodies were used to observe the titin and myosin in myocytes. Also, fluorescent-labeled phalloidin (F-432; 1:40, Molecular Probes Inc, Eugene, OR) was used for actin filaments. Fluorescein conjugated goat anti-rat IgG, donkey anti-goat IgG, and goat anti-mouse IgG secondary antibodies were used. Antigen unmasking was performed by immersion of sections in Target Retrieval Solution (Dako, Tokyo, Japan) in a pressure cooker and boiled for 15 minutes in a 600-W microwave oven. Sections were incubated with 10% bovine serum albumin (Santa Cruz Biotechnology Inc, Santa Cruz, CA) for 30 minutes at room temperature, and 40 minutes with primary antibodies followed by 30 minutes incubation with secondary antibodies. Finally, sections were incubated with propidium iodide (1:1000, Molecular Probes Inc, Eugene, OR) for 20 minutes, and observed with laser scanning confocal microscopy (LSM-500, Carl Zeiss, Co., Ltd., Jena, Germany).
Statistics
All data are presented as mean ± SEM. Statistical analysis was performed by one-way analysis of variance followed by Scheffé’s test for multiple comparisons to compare the results for each group and time interval. Differences were determined to be significant when the probability value was <0.05.
Results
Survival Rate
Ninety-two percent of the animals survived until 4 weeks after AVF. Seventy-nine percent survived over 8 weeks after AVF. Eighty-six percent survived in overload removal of 4-week overloaded animals. Seventy-eight percent survived in 1.5-cycle, 2.0-cycle, and 3.0-cycle animals.
Echocardiographic Observation
Rabbit hearts dilated significantly at 4-week AVF (Dd; 34% larger than control) with a significant increase of EDV (81% larger than control), SV (2.1-fold larger than controls), and CO (CO of SV × HR and CO of Doppler were both 2.2-fold larger than controls) (Figure 5A−B, Table 1). The heart kept dilating at 8 weeks (Dd; 46% lager than control) with a significant increase of EDV and SV (2.2-fold and 2.2-fold larger than control, respectively) and at 10 to 19 weeks (Dd; 46% lager than control) with a significant increase of EDV and SV (2.3-fold and 2.5-fold larger than control, respectively). Dilatation stopped thereafter. CO was almost 2- to 2.5-fold larger than that of control after 8 weeks. EF significantly increased 4 weeks after AVF (55%) as compared with controls (47%). It was ∼50% after 8 weeks, 10 to 19 weeks, and after 30 weeks.
Figure 5.

Echocardiographic images after volume overload and overload removal. Left ventricle dilates from A to B by 4-week AVF. Four-week overloaded heart contracts from C to D by 6-week AVF closure. Left ventricle cross-sectional planes at end-diastolic phase (B-mode echocardiography).
Table 1.
Echocardiographic Data after Volume-Overload and during Repeating Volume-Overload and Overload-Removal
| Animals | No | Dd (mm) | EDV (ml) | SV (ml) | EF (%) | HR (/min) | CO (SV × HR) (ml/min) | CO (Doppler) (L/min) |
|---|---|---|---|---|---|---|---|---|
| Volume overload | ||||||||
| Control | 58 | 14.8 ± 0.2 | 3.27 ± 0.08 | 1.51 ± 0.05 | 47 ± 1 | 198 ± 4 | 298 ± 11 | 0.28 ± 0.01 |
| 4-week | 20 | 19.8 ± 0.3* | 5.92 ± 0.19* | 3.23 ± 0.13* | 55 ± 2† | 213 ± 4 | 667 ± 23* | 0.61 ± 0.04* |
| 8-week | 7 | 21.6 ± 0.9* | 7.13 ± 0.66*‡ | 3.49 ± 0.43* | 49 ± 3 | 211 ± 12 | 729 ± 82* | 0.64 ± 0.05* |
| 10 to 19-week | 18 | 22.0 ± 0.4*§ | 7.39 ± 0.26*§ | 3.74 ± 0.25* | 50 ± 3 | 196 ± 7 | 711 ± 35* | 0.58 ± 0.03* |
| 20-week | 10 | 22.1 ± 0.4*§ | 7.39 ± 0.26*§ | 3.74 ± 0.15* | 51 ± 2 | 179 ± 5 | 670 ± 36* | 0.61 ± 0.03* |
| Repeating volume-overload and overload-removal | ||||||||
| 1.0-cycle | 8 | 16.1 ± 0.2 | 3.85 ± 0.16 | 1.92 ± 0.14 | 50 ± 3 | 190 ± 9 | 367 ± 36 | 0.30 ± 0.03 |
| 1.5-cycle | 8 | 19.1 ± 0.4¶ | 5.52 ± 0.24¶ | 2.87 ± 0.12¶ | 52 ± 2 | 207 ± 6 | 589 ± 17¶ | 0.65 ± 0.04¶ |
| 2.0-cycle | 12 | 15.4 ± 0.3 | 3.54 ± 0.12 | 1.23 ± 0.08 | 37 ± 3∥ | 182 ± 8 | 232 ± 16 | 0.31 ± 0.02 |
| 2.5-cycle | 8 | 20.5 ± 0.7¶ | 6.41 ± 0.48¶ | 3.58 ± 0.41¶ | 45 ± 3 | 206 ± 13 | 587 ± 65¶ | 0.73 ± 0.05¶ |
| 3.0-cycle | 7 | 14.9 ± 0.3 | 3.27 ± 0.12 | 1.21 ± 0.10 | 38 ± 4 | 193 ± 7 | 232 ± 17 | 0.33 ± 0.02 |
| 1-c-sham | 5 | 14.8 ± 0.4 | 3.25 ± 0.17 | 1.39 ± 0.13 | 43 ± 3 | 165 ± 7 | 230 ± 21 | 0.26 ± 0.02 |
| 3-c-sham | 3 | 14.0 ± 0.0 | 2.89 ± 0.00 | 1.25 ± 0.10 | 44 ± 4 | 183 ± 21 | 234 ± 48 | 0.20 ± 0.00 |
Data for controls are from those animals on which echocardiography was performed before AVF operation.
Significantly larger than controls (P < 0.0001).
Significantly larger than control (P < 0.002).
Significantly larger than 4-week (P < 0.002).
Significantly larger than 4-week (P < 0.0001).
Significantly larger than control, 1.0-cycle, 2.0-cycle, 3.0-cycle, 1-c-sham, and 3-c-sham (P < 0.0001).
Significantly smaller than 1.5-cycle (P < 0.001).
No, number of echocardiographic study; Dd, end-diastolic left ventricle diameter; EDV, end-diastolic left ventricular volume; SV, stroke volume; EF, ejection fraction; HR, heart rate; CO (SV × HR), cardiac output calculated by SV × HR; CO (Doppler), cardiac output obtained by Doppler echocardiography; 1-c-sham, ∼10-week after sham-operation; 3-c-sham, three cycle of sham-operation.
At 6 weeks after the overload removal, the 4-week-overloaded hearts (1.0-cycle) contracted significantly (Dd; 23% smaller than 4-week) with significant decrease of EDV, SV, CO of SV × HR and CO of Doppler (54%, 1.7-fold, 1.8-fold, and 2.0-fold smaller than 4-week, respectively) (Figure 5C–D, Table 1). The second round of 4-week overload (1.5-cycle) again induced significant cardiac dilatation (Dd; 19% larger than 1.0-cycle) with significantly increased EDV, SV, CO of SV × HR and CO of Doppler (43%, 1.6-fold, 1.6-fold, and 2.2-fold larger than 1.0-cycle, respectively). Similarly, the second round of 6-week overload-removal (2.0-cycle) resulted in a significant heart contraction with normalization of EDV, SV, and CO. The third round of 4-week overload (2.5-cycle) induced a very similar cardiac dilatation, while the third round of overload-removal (3.0-cycle) normalized cardiac size and function as observed in the first and the second overload and overload-removal cycle (Table 1). EF was 52% at 1.5-cycle and 45% at 2.5-cycle. It was 50% after first flow decrease (1.0-cycle), but slightly low 37% (2.0-cycle) and 38% (3.0-cycle) after second and third decrease, respectively.
Gross Appearance of Hearts
After creation of carotid-jugular AVF, blood flow rates of the left carotid artery increased in all groups with AVF (Table 2). The heart enlarged at 4 weeks (LVW/BW ratio; 15% larger than control, not significant) (Figure 6). It was significantly enlarged at 8 weeks (LVW/BW ratio; 34% larger than control, P < 0.001), 16 to 18 weeks (LVW/BW ratio; 35% larger than control, P < 0.001), and over 26 weeks (LVW/BW ratio; 48% larger than control, P < 0.001) (Figure 6, Table 2). The speed of enlargement slowed after 8 weeks. After repeating overload by AVF opening and overload removal by AVF closure, the carotid artery significantly repeatedly increased and decreased blood flow (Table 2). Hearts were as small as controls after 6-week overload-removal (1.0-cycle). They enlarged again by the second 4-week overload (1.5-cycle). These hearts showed a similar pattern of enlargement and contraction induced by the second and third rounds of overload and overload-removal cycle.
Table 2.
Heart Weight and Carotid Flow
| Experiments | (Number) | BW (kg) | HW (g) | LVW (g) | LVW/BW (g/kg) | BF (final) (ml/min) |
|---|---|---|---|---|---|---|
| Volume-overload experiments | ||||||
| Control | (21) | 3.8 ± 0.3 | 11.2 ± 0.4 | 6.4 ± 0.4 | 1.70 ± 0.04 | 17 ± 4 |
| 1-week | (8) | 4.2 ± 0.1 | 10.6 ± 0.4 | 6.7 ± 0.5 | 1.64 ± 0.12 | 98 ± 29 |
| 2-week | (4) | 4.5 ± 0.2 | 14.0 ± 0.8 | 8.7 ± 0.2 | 1.90 ± 0.15 | 160 ± 28* |
| 4-week | (11) | 4.0 ± 0.2 | 13.8 ± 0.4 | 7.4 ± 0.3 | 1.96 ± 0.10 | 188 ± 48* |
| 8-week | (7) | 4.0 ± 0.1 | 15.3 ± 0.8†‡ | 8.9 ± 0.5†‡ | 2.27 ± 0.08† | 202 ± 26* |
| 16 to 18-w | (7) | 4.3 ± 0.2 | 17.8 ± 2.0†‡§ | 9.9 ± 1.1†‡ | 2.30 ± 0.34†‡ | 246 ± 49* |
| Over 26-w | (13) | 4.3 ± 0.1 | 17.4 ± 0.6†‡§ | 10.4 ± 0.6†‡§ | 2.51 ± 0.10†‡ | 289 ± 34* |
| Repeating volume-overload and overload-removal experiments | ||||||
| 1.0-cycle | (4) | 3.4 ± 0.3 | 9.8 ± 0.3 | 6.4 ± 0.1 | 1.85 ± 0.24 | 19 ± 3 |
| 1.5-cycle | (4) | 3.6 ± 0.1 | 11.7 ± 0.6 | 7.0 ± 0.3 | 1.95 ± 0.05 | 372 ± 69∥ |
| 2.0-cycle | (6) | 3.6 ± 0.1 | 11.7 ± 0.7 | 7.3 ± 0.4 | 1.97 ± 0.07 | 15 ± 3 |
| 2.5-cycle | (5) | 3.8 ± 0.2 | 14.3 ± 1.0¶ | 7.7 ± 0.4 | 2.02 ± 0.07 | 469 ± 39∥ |
| 3.0-cycle | (6) | 3.8 ± 0.2 | 12.6 ± 0.8 | 7.6 ± 0.4 | 2.01 ± 0.07 | 29 ± 9 |
| 3-cycle sham | (3) | 4.1 ± 0.1 | 11.1 ± 0.8 | 6.8 ± 0.5 | 1.64 ± 0.07 | 13 ± 2 |
Abbreviations: (Number); Number of animals, BW; Body weight, HW; Heart weight, LVW; Left ventricle weight, LVW/BW: Left ventricle weight-to-body weight ratio, BF (final); Blood flow rate of the left common carotid artery at final measurement before sacrifice.
Significantly greater than control (2-week, P < 0.001; 4-week, 8-week, 16–18-week, over 26-week, P < 0.0001).
Significantly greater than controls (HW: 8-week, P < 0.0003; 16–18-week, P < 0.0001; over 26-week, P < 0.0001. LVW: 8-week, P < 0.0003; 16–18-week, P < 0.0001; over 26-week, P < 0.0001. LVW/BW: 8-week, P < 0.002; 16–18-week, P < 0.0008; over 26-week, P < 0.0001).
Significantly greater than 1-week (HW: 8-week, P < 0.0004; 16–18-week, P < 0.0001; over 26-week, P < 0.0001. LVW: 8-week, P < 0.002; 16–18-week, P < 0.0001; over 26-week, P < 0.0001. LVW/BW: 16–18-week, P < 0.002; over 26-week, P < 0.0001).
Significantly greater than 4-week (HW: 16–18-week, P < 0.0008; over 26-week, P < 0.0004. LVW: over 26-week, P < 0.0002).
Significantly greater than 1.0-cycle (P < 0.0007).
Significantly greater than 1.0-cycle, 2.0-cycle, 3.0-cycle, and 3-cycle-sham (P < 0.0001).
Figure 6.

Gross appearance of volume-overloaded hearts. Hearts show dilatory hypertrophy after volume overload. Left: Control, Middle: 4-week after AVF, Right: 30-week after AVF.
Myocyte Length
Myocyte length calculated as the number of sarcomeres was 61.9 ± 0.4 in controls (Figure 7). Volume overload induced a myocyte elongation, which is indicated by the increase in sarcomere number of ∼6 after 1 week, ∼11 after 2 weeks, and ∼23 after 4 weeks. The rate of increase in the sarcomere number is rather constant (approximately one sarcomere per day) until 4 weeks. The histogram showed similar distribution in control, 1-week, 2-week, and 4-week animals, which slid parallel to right (Figure 7). At 8 weeks, 16- to 18-week, and over 26-week overload, average sarcomere number of myocytes were ∼30, ∼36 and ∼33-sarcomeres longer than controls, respectively, but the histogram showed wide divergence of myocyte length with occasional very long myocytes of ∼140 sarcomeres in 8 weeks and ∼180 sarcomeres in 16 to 18 weeks.
Figure 7.

Histogram of myocyte length. The left column is histograms of volume overload experiments. Histograms shift to the right gradually until 4 weeks. The myocyte length (ML) at 4 weeks is significant longer than that of 2 weeks (P < 0.0001), which is significantly longer than that of control (P < 0.0001). At 8 weeks, ML is significantly longer than that of 4 weeks and some long myocytes reach 140 sarcomeres. At 16 to 18 weeks and over 26 weeks, the ML is significantly longer than that of 8 weeks (P < 0.0001) and very long myocytes reach 180 sarcomeres. The middle column is histograms of overload-removal experiments of 4-week overloaded animals. Histograms shift to the left gradually until 4-week overload removal. The ML of 4-week overload removal is significantly shorter than that of 3-week overload removal (P < 0.0001), which is significantly shorter than that of 1-week overload removal (P < 0.0001). ML of 1-week overload removal is significantly shorter than that of 1- to 2-hour overload removal (P < 0.0001) or that of 4-week overloaded animals (P < 0.0001). The right column is histograms of repeating overload and overload-removal. Histograms of 1.0-cycle, 2.0-cycle and 3.0-cycle are similar to histogram of control, while those of 1.5-cycle and 2.5-cycle are similar to histogram of 4-week overload (0.5-cycle). ML of 1.5-cycle and 2.5-cycle are significantly longer than those of 1.0-cycle, 2.0-cycle, 3.0-cycle and 3-cycle sham, respectively (P < 0.0001). ML is expressed mean ± SEM in each histogram. (n) is number of measured myocytes. X bar indicates sarcomere number in 10-sarcomere steps and Y bar indicates % of myocytes.
Overload removal resulted in a shortening of the elongated myocytes previously induced by 4-week volume-overload (Figure 7). The number of sarcomeres decreased by ∼8 after 1-week, ∼18 after 3-week, ∼26 after 4-week, and ∼26 after 6-week overload removal. The histogram showed similar distribution after 1 weeks, 3 weeks, and 4 weeks, which slid parallel to the left (Figure 7). Therefore, the rate of myocyte shortening is constant (approximately one sarcomere per day). Myocyte elongation and shortening occurred during the second and third cycle of overload and overload removal as well, which repeated similar changes as observed during the first cycle (Figure 7).
Morphological Change of ICDs
ICDs showed uniquely similar pattern of divergence in wideness, irregularity level, and interdigitation length in each heart of all experimental animals. It was difficult to show statistically their similarity, because we could not check all ICDs. However, so long as we observed in the middle layer of the left ventricle, where many myocytes were parallel to the sliced plane, they showed a uniquely similar pattern. Even in the layers, where many myocytes were angled or perpendicular to the sliced plane, patterns of ICDs seemed similar. According to the theory of Streeter,41 which states that all myocytes would be arranged so as to work similarly, it was probable that ICDs changed their patterns synchronously within each heart.
When we observed ICDs assuming probable synchronization of their patterns during volume overload, we found a unique tendency after overload: Periodical repeats of broadening and narrowing of ICDs by a 2-day cycle (Figure 8, A−I). With ultrastructural and N-cadherin immunohistochemical observations, each cycle of ICD changes was divided into five modes (Figure 4, Figure 9, A−F, Figure 10, A−F, Table 3). In the first cycle of ICD changes from normal to 2 days of volume overload (Figures 4, 9, and 10), ICDs, which were flat and narrow with short interdigitations (interdigitation length is 1/3-sarcomere and ICD width is 1/3-sarcomere) in normal volume load (controls), which we named “I-mode,” became flat but thick with ∼one-sarcomere-long interdigitations at 6 hours of overload (ICD width is ∼one sarcomere), which we named “II-mode.” At 12 hours of overload, the ICD was filled with one-sarcomere-deep grooves and contra-grooves (when observed from the other side), whose bottoms were composed of short interdigitations (∼1/2-sarcomere), which we named “III-mode.” The grooves were 2 to 3 interdigitations wide. At 1 day of overload, the ICD was filled with one-sarcomere-deep grooves and contra-grooves whose bottoms were composed of one-sarcomere-long interdigitations, which we named “IV-mode.” ICDs broadened nearly ∼2 sarcomeres by one-sarcomere-deep grooves plus one-sarcomere-long interdigitations. At 1.5 days of overload, the ICD was mostly flat and thin with short ∼1/3-sarcomere interdigitations, but there were sporadic rows of bilaterally spiked one-sarcomere-long interdigitations, which we named “V-mode.” The grooves disappeared, but one-sarcomere-long spaces, surrounded by several elongated spiked interdigitations, appeared. At 2 days of overload, the ICD was again flat and thin with short interdigitations, back to I-mode. During this cycle, I-mode was consistent with narrow ICDs and IV-mode was consistent with broad ICDs. In the second cycle of ICDs, with changes from 2- to 4-day overload, the five modes shifted similarly to those during the first 2 days of overload. At 5, 6, 7 and 8 days of overload, ICDs showed principally IV, I, IV, and I-modes, respectively (Table 3). Considering that, if the 2-day cycle continued, “odd” and “even” numbered days would show IV-mode and I-mode, respectively, we observed 2-week (“even” number day) and 2-week ± 1-day (“odd” number day), 4-week (“even” number day) and 4-week ± 1-day (“odd” number day), 8-week (“even” number day), and 8-week ± 1-day (“odd” number day) and 16-week (“even” number day) and 16 weeks ± 1 day (“odd” number day) of overload. We found that I-mode predominated at 2 weeks, while IV-mode predominated at 2 weeks ± 1 day (Table-3). I-mode predominated at 4 and 8 weeks, while IV-mode predominated 4 and 8 weeks ± 1 day (Table 3). IV-mode predominated in only one animal with 16 weeks + 1 day (113-day), but all of the other animals of 16-week and 16-week ± 1-day showed I-mode. After 18 weeks of overload, all animals showed I-mode.
Figure 8.

Broadening and narrowing of intercalated disks after volume overload. In controls, ICDs are narrow and simple (A). After 1 (B), 3 (D), 5 (F) and 7-day (H) volume overload, ICDs are broad, while ICDs are narrow after 2 (C), 4 (E), 6 (G), and 8-day (I) volume overload. ICDs are stained by N-cadherin. Images are obtained with differential microscopy to define sarcomeres.
Figure 9.

Microscopic appearances of the shift of five modes of intercalated disk after overload and after overload removal. Left column (volume overload): In the control, ICD is narrow and straight in longitudinal-section (long) and flat and simple in cross section (cross) (A[C]; Control; I-mode). After 6-hour (B [6 hours]), ICD is almost one-sarcomere-wide with elongated interdigitations in longitudinal section and flat and simple in cross section (II-mode). After 12-hour (C [12 hours]) ICD separates into two lines with a distance of one-sarcomere-stretch between them. Each line is narrow with short interdigitations. Cross section reveals irregular worm-eaten pattern indicating that disks are filled with one-sarcomere-deep grooves and contra-grooves (III-mode). After 1 day (D [1 day]), ICDs broaden. Disks are filled with one-sarcomere-deep grooves plus contra-grooves, the bottoms of which consist of elongated interdigitations resulting in ∼two-sarcomeres-wide ICD (IV-mode). After 1.5 days (E [1.5 days]), the ICD is flat and thin, but sporadic one-sarcomere-long interdigitations appear as spikes (V-mode). After 2 days (F [2 days]), ICDs are narrow and simple like those of control (I-mode). Right column (overload removal of 2-day overloaded hearts): After 12-hour (G [2 days−12 hours]), the ICD is flat and thin, but sporadic one-sarcomere-long interdigitations appear as spikes (r-V-mode). After 1 day (H [2 days − 1 day]), the ICD broadens. It is filled with one-sarcomere-deep grooves plus contra grooves, the bottoms of which consist of elongated interdigitations, resulting in two-sarcomeres-wide ICD (r-IV-mode). After 1.5 days (I [2 days −1.5 days]), the ICD separates into two lines with a distance of one-sarcomere stretch between them. Each line is narrow with short interdigitations. A cross section reveals irregular worm-eaten pattern showing that disks are filled with one-sarcomere-deep grooves and contra-grooves (r-III-mode). After 1.75 days (J [2 days −1.75 days]), the ICD is almost one-sarcomere-wide with elongated interdigitations so that cross section reveals a simple flat disk. These represent flat thick disks (r-II-mode). After 2 days (K [2 days − 2 days]), the ICD is narrow and simple like those of the control (r-I-mode). Modes appeared in overload removal are similar and indistinguishable from those that appeared after overload. The ICDs are stained with N-cadherin. The arrow in the left lane (upper to lower) indicates time course direction of overload and the arrow in the right lane (lower to upper) indicates time course of overload removal.
Figure 10.

Ultrastructural changes of the intercalated disk after volume overload. The control shows thin and flat disks with short interdigitations (1/4- to 1/3-sarcomere long) (A [Control]) (I-mode). At 6 hours of volume-overload, the ICD becomes thick with one-sarcomere-long interdigitations (B [6 hours]) (II-mode). At 12 hours, the ICD is folded to form ∼one-sarcomere-deep grooves (G) and contra-grooves (G) with short interdigitations (C [12 hours]) (III-mode). At 1 day, interdigitations elongate up to one sarcomere long in the folded ICD (D [1 day]) (IV-mode) so that the ICD broadens to ∼two sarcomeres wide. Grooves (G) and contra-grooves (G) appear in this mode. At 1.5 days, the ICD is thin with mostly short interdigitations, but one-sarcomere-long interdigitations sporadically appear as spikes (E [1.5 days]) (V-mode). There appear “spaces” (S) surrounded by several spikes. At 2 days, the ICD is thin and flat with short interdigitations similar to those of controls, finishing one cycle of ICD changes during volume overload (F [2 days]) (I-mode). Longitudinal section to myocytes.
Table 3.
Shift of Five Modes after Volume-Overload
| Duration | Modes
|
||||
|---|---|---|---|---|---|
| (I) | (II) | (III) | (IV) | (V) | |
| 0.00-day (Control) | 100 | 0 | 0 | 0 | 0 |
| 0.25-day | 20 | 60 | 20 | 0 | 0 |
| 0.50-day | 0 | 20 | 60 | 20 | 0 |
| 1.00-day | 0 | 0 | 20 | 60 | 20 |
| 1.50-day | 20 | 0 | 0 | 20 | 60 |
| 2.00-day | 60 | 20 | 0 | 0 | 20 |
| 2.25-day | 20 | 60 | 20 | 0 | 0 |
| 2.50-day | 0 | 20 | 60 | 20 | 0 |
| 3.00-day | 0 | 0 | 20 | 60 | 20 |
| 3.50-day | 20 | 0 | 0 | 20 | 60 |
| 4-day | 60 | 20 | 0 | 0 | 20 |
| 5-day | 0 | 0 | 20 | 60 | 20 |
| 6-day | 60 | 20 | 0 | 0 | 20 |
| 7-day | 0 | 0 | 20 | 60 | 20 |
| 8-day | 60 | 20 | 0 | 0 | 20 |
| 13-day | 0 | 0 | 20 | 60 | 20 |
| 14-day (2-week) | 60 | 20 | 0 | 0 | 20 |
| 15-day | 0 | 0 | 20 | 60 | 20 |
| 27-day | 0 | 0 | 20 | 60 | 20 |
| 28-day (4-week) | 60 | 20 | 0 | 0 | 20 |
| 29-day | 0 | 0 | 20 | 60 | 20 |
| 55-day | 0 | 0 | 20 | 60 | 20 |
| 56-day (8-week) | 60 | 20 | 0 | 0 | 20 |
| 57-day | 0 | 0 | 20 | 60 | 20 |
Approximate incidence of ICD modes: 0, ∼0%; 20, ∼20%; 60, ∼60%; 100, ∼100%.
After overload removal, we also found a 2-day cycle of broadening and narrowing of ICD changes (Figure 9F–K, Figure 11, A−F, Table 4). With ultrastructural and immunohistochemical (N-cadherin) observations, the cycle of ICD changes was divided into five modes. In the case of 2-day volume overload followed by overload removal, ICDs, which were flat and thin (I-mode) on the day, were mostly flat and thin, but there were sporadic rows of bilaterally spiked one-sarcomere-long interdigitations at 6 to 12 hours of overload removal. Because this mode was almost similar to the V-mode after overload, we named it as reverse-V-mode (r-V-mode). On the first day of overload removal, ICDs were filled with one-sarcomere-deep grooves and contra-grooves whose bottoms were composed of one-sarcomere-long interdigitations. The grooves were 2 to 3 interdigitations wide. ICDs broadened nearly ∼2 sarcomeres by one-sarcomere-deep grooves plus one-sarcomere-long interdigitations. Because this mode was almost similar to the IV-mode after overload, we named it as reverse-IV-mode (r-IV-mode). At 1.5 days of overload removal, many ICDs were filled with one-sarcomere-deep grooves and contra-grooves (when observed from the other side), whose bottoms were composed of short interdigitations. Because this mode was almost similar to the III-mode, we named it as reverse-III-mode (r-III-mode). At 1.75 days of overload removal, many ICDs were flat but thick with one-sarcomere-long interdigitations. Because this mode was almost similar to the II-mode, we named it reverse-II-mode (r-II-mode). At 2 days of overload removal, ICDs were flat and thin, similar to those of normal flow-load (control) or 2-day overload (I-mode), and therefore named reverse-I-mode (r-I-mode). In the case of 3-day overload followed by overload removal, the ICDs shifted from IV-mode to r-III-mode at 6 to 12 hours of overload removal (Table 4). At 1-, 1.5-, 2-, and 3-day overload-removal, ICDs showed principally r-I, r-V, r-IV, and r-I-mode, respectively (Table 4). In the case of 4-day overload followed by overload removal, modes shifted from I-mode to r-V, r-IV, r-III, r-I, r-V, r-IV, r-III, and r-I-mode at 12-hour, 1, 1.5, 2, 2.5, 3, 3.5, and 4-day of overload-removal, respectively (Table 4). In 4-week overloaded, followed by overload removal (Table 4), r-I-mode predominated at “even” number day of overload removal (2 and 4 days, and 4 weeks) and r-IV-mode predominated in “odd” number day of overload-removal (1 and 3 days, and 1 and 3 weeks). We assumed that five modes shift reversely from the mode that appears at the end of overload, and was kept until overload removal was compensated.
Figure 11.

Ultrastructural changes of the intercalated disk of 2-day overloaded hearts followed by overload removal. A 2-day overloaded heart shows thin and flat disks as observed in Figure 10 (A [2 days]) (I-mode). At 12 hours of overload removal, the ICD is thin with mostly short interdigitations, but there appear sporadic one-sarcomere-long interdigitations (B [2 days + 12 hours]) (r-V-mode). There appear “spaces” (S) surrounded by several spikes. At 1 day of overload removal, interdigitations elongate up to one sarcomere long bilaterally so that the ICD is folded to form one-sarcomere-deep grooves (G) and contra-grooves (G). Elongated interdigitation plus grooves results in ∼two-sarcomere-wide broad ICDs (C [2 days + 1 day]) (r-IV-mode). At 1.5 days of overload removal, the ICD is folded with short interdigitations keeping one-sarcomere-deep grooves and contra-grooves (G) (D [2 days + 1.5 days]) (r-III-mode). At 1.75 days of overload removal, the ICD is flat with one-sarcomere-long interdigitations (E [2 days + 1.75 days]) (r-II-mode). At 2 days of overload-removal, the ICD is thin and flat with short interdigitations, finishing one cycle of ICD changes during overload removal (F [2 days + 2 days]) (r-I-mode). Modes appeared in overload removal are similar and indistinguishable from those after overload. Longitudinal section to myocytes.
Table 4.
Shift of Reversal Five Modes after Overload-Removal
| Duration | Modes
|
||||
|---|---|---|---|---|---|
| (r-I) | (r-II) | (r-III) | (r-IV) | (r-V) | |
| 2-day overload followed by overload-removal | |||||
| 0.50-day | 20 | 0 | 0 | 20 | 60 |
| 1.00-day | 0 | 0 | 20 | 60 | 20 |
| 1.50-day | 0 | 20 | 60 | 20 | 0 |
| 1.75-day | 20 | 60 | 20 | 0 | 0 |
| 2-day | 60 | 20 | 0 | 0 | 20 |
| 3-day overload followed by overload-removal | |||||
| 0.50-day | 0 | 20 | 60 | 20 | 0 |
| 1.00-day | 60 | 20 | 0 | 0 | 20 |
| 1.50-day | 20 | 0 | 0 | 20 | 60 |
| 2-day | 0 | 0 | 20 | 60 | 20 |
| 3-day | 60 | 20 | 0 | 0 | 20 |
| 4-day overload followed by overload-removal | |||||
| 0.5-day | 20 | 0 | 0 | 20 | 60 |
| 1-day | 0 | 0 | 20 | 60 | 20 |
| 1.5-day | 0 | 20 | 60 | 20 | 0 |
| 2-day | 60 | 20 | 0 | 0 | 20 |
| 2.5-day | 20 | 0 | 0 | 20 | 60 |
| 3-day | 0 | 0 | 20 | 60 | 20 |
| 3.5-day | 0 | 20 | 60 | 20 | 0 |
| 4-day | 60 | 20 | 0 | 0 | 20 |
| 4-week overload followed by overload-removal | |||||
| 1-day | 0 | 0 | 20 | 60 | 20 |
| 2-day | 60 | 20 | 0 | 0 | 20 |
| 3-day | 0 | 0 | 20 | 60 | 20 |
| 4-day | 60 | 20 | 0 | 0 | 20 |
| 7-day (1-week) | 0 | 0 | 20 | 60 | 20 |
| 21-day (3-week) | 0 | 0 | 20 | 60 | 20 |
| 28-day (4-week) | 60 | 20 | 0 | 0 | 20 |
Approximate incidence of ICD modes: 0, ∼0%; 20, ∼20%; 60, ∼60%.
Transition from II to III and IV to V-Mode after Overload
At 6 to 12 hours after overload, interdigitations were occasionally obscure within the one-sarcomere-wide ICDs (Figure 12, A and B). Only tips of the interdigitations were identifiable with electron dense portions. In Figure 12A, myofibrils, which were almost 3/4 sarcomeres long with no defined Z-band, appeared within the broad ICDs. In Figure 12B, one-sarcomere-long myofibrils, with a Z-band like portion appeared within the broad ICDs. These ICDs represent assumed transition stage from II-mode to III-mode. On 1 day after overload, interdigitations occasionally appeared obscurely in the broadened ICDs (Figure 12, C and D). Only the tips of the interdigitations were identifiable with electron dense portions. In Figure 12C, myofibrils, which were almost 3/4 sarcomeres long with no defined Z-band, appeared within the broad ICDs. In Figure 12D, one-sarcomere-long myofibrils with Z-band appeared within the broad ICDs. These ICDs represent assumed transition stage from IV-mode to V-mode.
Figure 12.

Intercalated disks of assumed transitional II-mode to III-mode and IV-mode to V-mode after overload. Assumed transitional II to III-mode (A, B): In (A) (6-hour overload), the ICD is one sarcomere wide. Profiles of interdigitations are obscure in some portions. Filaments appear to form bundle in the areas of widened ICD, but they show no Z-band. In (B) (6-hour overload), there are filament bundles with plausible Z-band in the areas of widened ICD. Assumed transitional IV to V-mode (C, D): In (C) (1-day overload), ICD is nearly two sarcomeres wide. Interdigitations are complicated. Filaments within ICDs are going to form bundle formation, but they show no distinct Z-band. In (D) (1-day overload), ICD is two sarcomeres wide. Interdigitations are mostly in the middle line, but some elongate one-sarcomere-long bilaterally like V-mode. Filaments between interdigitation form bundles with Z-band. They would be immature stage of newly formed sarcomeres. Longitudinal section to myocytes.
Transition from r-V to r-IV and r-III to r-II Mode after Overload Removal
At 12 hours of overload removal of 2-day overloaded animals, interdigitations were occasionally obscure in the broadened ICDs (Figure 13, A and B), in the vicinity of which foci of scanty fibrils appeared. These ICDs represent an assumed transition stage from r-V to r-IV-mode. At 1.75 days’ overload removal of 2-day-overloaded animals, interdigitations were occasionally obscure in the broadened ICDs (Figure 13, C and D), in the vicinity of which foci of scanty fibrils appeared. These ICDs represent assumed transition stage from r-III mode to r-II mode. We did not find any evidence of autophagy, any debris of disposed sarcomeres, or any macrophages.
Figure 13.

Intercalated disks of assumed transitional r-V-mode to r-IV-mode and r-III-mode to r-II-mode after overload removal. Assumed transitional r-V-mode to r-IV-mode (A, B): In (A) (2-day overload and 12-hour overload removal), there appear foci with no filament in the spaces surrounded by elongated interdigitations. In (B) (2-day overload and 12-hour overload removal), some foci of no filament appeared, where irregularly elongated interdigitations were found. Assumed transitional r-III-mode to r-II-mode (C, D): In (C) (2-day overload and 1.5-day overload removal), there appear foci with no filament within the widened ICD. In (D) (2-day overload and 1.5-day overload removal), irregular and monotonously electron dense portions appeared within widened ICDs, where intercellular junctions become obscure. Appearance of no filament zones would be ongoing stage of sarcomere disposal. Longitudinal section to myocytes.
Immunohistochemical and Immunofluorescent Observation of Filaments
In paraffin sections, actin, myosin, and desmin were regularly arranged in the myocytes in all modes. Titin was only slightly stained in the myocytes and it showed no specific change around ICDs. Nebulin was not stained in all hearts. As shown in Figures 14 and 15, myosin, actin, and desmin showed characteristic pattern according to the ICD modes. In I-mode (control, 2-day AVF, 4-day AVF and 4-day AVF plus 4-day AVF closure in Figure 14 and control in Figure 15), ICDs were narrowly interposed between two myosin-stained sarcomeres. Actin also margined narrow ICDs, but not clearly demarcated. Desmin sandwiched narrow ICDs, which demonstrated parallel two desmin-stained lines around ICD. In IV-mode (1-day AVF, 3-day AVF and 4-day AVF plus 1-day AVF closure in Figure 14, and 1-day AVF in Figure 15), wide zone appeared between myosin-stained sarcomeres. Actin was irregular and less distinct in the zone. In the zone, broadened ICDs, which were stained by N-cadherin, appeared (Figure 15). Desmin was irregularly arranged and irregularly stained in the zone. However, we could not observe dynamic changes of individual filament within broadened ICDs by the magnification of immunohistochemical study.
Figure 14.

Myosin, actin, and desmin around intercalated disk in I-mode and IV-mode. Myosin, actin (HHF35), and desmin are individually immunohistochemically stained with paraffin section (nonperfused fixed hearts). They are regularly stained in the myocyte body; however, around ICDs, which we suppose to exist in the zones indicated by arrows, myosin, actin, and desmin show characteristic features as follows. In I-mode [control, 2-day after AVF (2-day), 4-day after AVF (4-day) and 4-day after overload removal of 4-day overloaded animal (4-day + 4-day)], the zones are narrow and simple. They are interposed by two myosin stained lines and two desmin stained lines. They are vaguely stained by actin. In IV-mode [1-day after AVF (1-day), 3-day after AVF (3-day), 1-day after overload-removal of 4-day overloaded animal (4-day + 1-day)], the zones are wide and irregular. Nearly two sarcomere-wide zones appear between myosin stained lines. Actin is irregular and vague and desmin is irregular in these zones.
Figure 15.

Double immunohistochemical observation of intercalated disk at I and IV-mode. N-cadherin and myosin (N-cadherin+myosin) and N-cadherin and actin (N-cadherin+HHF35) are double immunohistochemically stained in control (I-mode) and 1 day after AVF (IV-mode). N-cadherin stained ICD is narrow and simple interposed between two myosin lines and actin lines in I-mode. N-cadherin stained ICD is wide and irregular in IV-mode. The zone margined by myosin or actin is filled with irregular and widened ICDs. Some actin positive portions appear within ICDs.
With the immunofluorescent study by using the frozen section, actin (phalloidin), myosin, and titin were regular and well preserved in the body of myocytes (Figure 16). They showed similar changes as those of immunohistochemical observations.
Figure 16.

Immunofluorescent images of major filaments (actin, myosin, and titin), chaperons (TCP-1α, HSP90 and UNC45B) and ubiquitin ligase (MuRF1). Upper panel: Actin (phalloidin), myosin, and titin are observed (frozen section, 1-day after AVF of 4-day overloaded-heart; IV-mode). These filaments are regularly arranged in the body of myocytes, while ICDs could not be well identified so long as we observed. Lower panel: Chaperon and ubiquitin ligase (TCP-1α, HSP90, UNC45B, MuRF1) are observed (paraffin section, 1.5-day after AVF; V-mode). Their activity could not be identified. Frozen section also expresses no identifiable activity of these proteins. Laser confocal microscopy.
Western Blotting
Representative Western blots for UNC45B, HSP90, MuRF1, and TCP-1α proteins are presented in Figure 17, A−B. There was no significant difference of these proteins in overload experiments group and overload removal experiments group, respectively. There was no significant difference of these proteins between overload experiments group and overload removal experiments group. We could not detect characteristic immunofluorescent activities of these proteins in myocytes or ICDs (Figure 16).
Figure 17.

Western blot of chaperons (TCP-1α, HSP90 and UNC45B) and ubiquitin ligase (MuRF1) in volume-overloaded hearts and overload-removed hearts. Left panel shows overload experiments; Lane 1: Control (0-day), Lane 2: 0.5-day AVF, Lane 3: 1-day AVF, Lane 4: 1.5-day AVF, Lane 5: 2-day AVF, Lane 6: 2.5-day AVF, Lane 7: 3-day AVF, Lane 8: 3.5-day AVF, Lane 9: 4-day AVF. Right panel shows overload-removal experiments of 4-day overloaded rabbits; Lane 10: 4-day AVF, Lane 11: 4-day AVF plus 0.5-day AVF closure, Lane 12: 4-day AVF plus 1-day AVF closure, Lane 13: 4-day AVF plus 1.5-day AVF closure, Lane 14: 4-day AVF plus 2-day AVF closure, Lane 15: 4-day AVF plus 2.5-day AVF closure, Lane 16: 4-day AVF plus 3-day AVF closure, Lane 17: 4-day AVF plus 3.5-day AVF closure, Lane 18: 4-day AVF plus 4-day AVF closure. Upper panel (A) shows one representative Western blot of three chaperons (UNC45B, HSP90, and TCP1-α) and one ubiquitin ligase (MuRF1). Lower panel (B) shows graphs of ratio to control of these proteins. Error bar indicates mean ± SEM. Three chaperons and ubiquitin ligase shows no significant difference among overload experiments. They show no significant difference among overload removal experiments. They show no significant difference between the group of overload experiments and that of overload removal experiments.
Discussion
Although our experiments only showed a cyclic shift of ICD mode rather than dynamic movement of interdigitations, we assume that interdigitations are repeatedly elongated and shortened two times per 2-day cycle after overload. The first elongation and shortening appeared to synchronize with the appearance of “grooves” and the second with the disappearance of the “grooves.” We hypothesize that two-time elongation-and-shortenings occur in one broadening and narrowing cycle as follows (Figures 4 and 18). [First-time elongation-and-shortening] All interdigitations elongate (I-mode to II-mode). Then, elongated interdigitations retract alternately in one direction or the contralateral direction to create grooves and contra-grooves (II-mode to III-mode). Two continual interdigitations retract together. These two continual interdigitations eventually form three continual interdigitations observed from the other side of the ICDs. This interdigitation shortening couples with the creation of one-sarcomere-long myofibril bundles so that the heart keeps dilating (red-colored myofibril bundles in Figure 18). [Second-time elongation-and-shortening] All interdigitations elongate keeping grooves and contra-grooves (III-mode to IV-mode). Interdigitation elongation plus grooves results in the two-sarcomere-wide broadened ICDs. Then, elongated interdigitations retract on the first grooves in two steps. First, interdigitations located in the middle (one middle interdigitation among three continual interdigitations) retract with the support of the laterally located interdigitations, which remain elongated (IV-mode to V-mode). This retraction creates counter-grooves on the primary grooves so that grooves eventually disappear. This interdigitation shortening couples with the creation of one-sarcomere-long myofibril bundles (yellow-colored myofibril bundles in Figure 18) so that the heart keeps dilating. Secondly, the spiked interdigitations retract when new sarcomeres are completed (V-mode to I-mode). Consequently, two layers of sarcomeres are created per one broadening and narrowing cycle of 2 days. Immunohistochemical studies revealed characteristic widening of the ICDs at IV-mode with widely separated myosin, actin, and desmin. Therefore, this ICD mode shift runs parallel to a dynamic change of these filaments; however, we could not analyze any changes of individual filaments within ICDs by this magnification of immunohistochemistry. In the TEM images assumed from II- to III-mode or IV- to V-mode, we found immature myofibrils with or without Z-band. We consider that sarcomere assembly occurs coupled with sliding shortening of interdigitations within a hollow (or space) circumscribed by grooved wall (or spiked-interdigitations) so that the supposed mechanical weakness appearing at the moment of sarcomere assembly is minimized. Although myofibrillogenesis has been studied extensively,42,43,44 little is known how sarcomeres assemble in adult animals. Because all myofibrils that run through myocardial cells terminate into ICDs, ICDs have been discussed to have a potential to create new sarcomeres.21,22,23,24,25,26,27 It is very interesting that Heidenhain21 already described the contribution of ICD to sarcomere assembly in detail, before TEM was discovered (1901). However, since his reports, we have found no reports describing the time course of sarcomere assembly in relation to ICDs in vivo. Recently, Yu and Russell28 showed focal abnormal sarcomeric disruptions in the stretched myocytes in vitro during 4 hours. They suggested that myocytes from neonatal rat hearts remodel by insertion of new sarcomeres throughout the cell length. At the same time, they suggested that zigzag pattern of the ICDs might correlate with new sarcomere appearance and yield progressive lengthening at the ends of the cell. It is interesting that the “focal heavily stained sarcomeric abnormalities, showing thick longitudinal strands generally extended out from the Z-disk, spanned one or more sarcomeres, and ending on the Z-disk at the other side of the disrupted region” resemble the IV-mode of ICDs that we have shown in our present experiments.28 Because it is very difficult to confirm whether the disrupted portions were actually within individual myocytes or on the cell borders, it is possible that these strange sarcomeric disruptions might be related to ICDs and be consistent with ongoing sarcomere assembly, although it could not be denied that it might occur within myocyte. Recently, Bennett et al29 proposed a Z-disk-like functional subcellular domain named “the transitional junction” at the bilateral sides of the ICDs. They postulated that it provided a means for sarcomeres to be added to the end of the cells during growth. Our prediction that new sarcomere assembles within the ICDs, which are interposed between two “transitional junctions,” support their proposal.
Figure 18.

Hypothetical shift of five modes of intercalated disks after overload and overload removal. Volume overload: During volume overload, modes shift from I to V and then returned to I, finishing one cycle of ICD changes (black arrows). From I-mode to II-mode interdigitations elongate one sarcomere. From II-mode to III-mode, two adjacent interdigitations alternately retract to form folds, which are grooves and contra-grooves three-dimensionally. Within folds, new one-sarcomere-long myofibril bundles (red) appear. Observing from the other side, top of the grooves consists of three adjacent interdigitations. From III-mode to IV-mode, interdigitations again elongate. From IV-mode to V-mode, one center interdigitation among three continual interdigitations retracts. Laterally located interdigitations remain elongated, which resemble spikes. Within spaces, surrounded laterally by spiked interdigitations and bottomed with retracted interdigitation, new one-sarcomere-long myofibril bundles (yellow) appear. Because the second retraction is complementary to the first, new myofibril bundles in the second retraction are alternately placed between those in the first retraction. From V-mode to I-mode, spiked-interdigitations retract. After one cycle, two layers of sarcomere are created at each side of the ICDs. Overload-removal: After overload-removal of 2-day (or “even” number day) overloaded hearts, modes shift from I-mode after cycle, r-V, r-IV, r-III, r-II to r-I-mode (I-mode after reverse cycle) (red arrows). First, interdigitations elongate one-sarcomere-long sporadically and bilaterally at first (I to r-V-mode). Then, short interdigitations between sporadically elongated interdigitations elongate bilaterally to dispose one-sarcomere-long myofibril bundles (yellow) (r-V to r-IV-mode). Elongated interdigitations shorten from r-IV to r-III-mode. Two interdigitations in the bottoms again elongate into the grooves to dispose one-sarcomere-long myofibril bundles (red) (r-III to r-II-mode). Because this elongation is exactly complementary to the first elongation, interdigitations line straight. Elongated interdigitations shorten from r-II to r-I-mode. This five mode shifts are exactly reverse manner to those after overload so that two layers of sarcomere are disposed at each side of the ICDs.
Because ICDs of 2-, 4-, 6-, 8-, 14-, and 28-day overloaded hearts showed I-mode (narrow ICD) predominantly and those of 1-, 3-, 5-, 7-, 13-, 15-, 27-, and 29-day overloaded hearts showed IV-mode (broad ICD) predominantly, we assume that ICDs keep the 2-day cycle until 4 weeks. When one cycle may create 2 sarcomeres as discussed above, myocytes would elongate 28 sarcomeres during this 4 weeks. Because this rate of elongation is well consistent with approximate one sarcomere per day increase rate of sarcomeres until 4 weeks, obtained by histometric study, myocytes would elongate keeping time with 2 day ICD cycle. Because this rhythm cycle is 2 days, we predict that, if ICDs of “odd” number day-overloaded hearts show IV-mode (broad ICD), the cycle would continue. If ICDs of “odd” number day-overloaded hearts show I-mode (narrow ICD), the cycle would stop. Because ICDs showed IV-mode in “odd” number day-overload and I-mode in “even” number day-overload around 8-week, we assume that the cycle continue around 8 weeks. However, average myocyte length was 30 to 35 sarcomeres longer than that of controls, which were not consistent with the assumed myocyte length (56 sarcomeres longer than that of controls, if new sarcomere formation, 2 sarcomeres per 2-day ICD cycle, might continue). We consider that this discrepancy is due to the limitation of the histological measurement (very long myocardial cells over 100 sarcomeres overhang the histological sliced plane), because very long myocytes (∼140 sarcomeres) appeared occasionally at 8 weeks. Almost all animals over 16 weeks showed ICDs predominated by I-mode regardless of “odd” or “even” number-day overload except one heart at 113-day overload, which showed IV-mode predominantly and occasional ∼180-sarcomere-long myocytes. We consider that the cycle ceases after 16-week overload except one animal.
From echocardiographic data, LV dilated gradually after volume overload, while CO increased rather quickly as early as 4 weeks with significant increase of EF and slight elevation of HR. After 8-week CO was almost unchanged, while Dd kept increasing at 8 weeks and kept almost unchanged after 10 weeks. EF was around 50% after 8 weeks and HR gradually decreased. We consider that the heart compensates acute volume overload by the combination of the enlargement of left ventricle, the elevation of EF and the increase of HR until 4 weeks. After 8 weeks, the heart can compensate volume overload only by the enlargement of left ventricle. We consider that the heart can endure this level of overload without cardiac failure, because EF was almost as high as that of controls and 92% of animals survived until 4 weeks and 79% over 8 weeks. If Dd increased simply by myocyte elongation following our 2-sarcomere per 2-day ICD cycle prediction (28-sarcomere increase in 60-sarcomere-long myocyte) for 4 weeks and left ventricular lumen shape was unchanged, dilatation would increase by 47%, while Dd increased by 34% at 4-week overload. However, we found that the left ventricular lumen shape shifted narrow-and-long to spherical, when it enlarges (Figure 2). Therefore, when we take left ventricular lumen shape shift into consideration, our results obtained by echocardiography will be consistent with our 2-day ICD cycle prediction. Gradual increases of HW, LVW, and LVW/BW ratio will be also consistent with the cycle.
After overload removal, we found cyclic shift of ICD modes (I, r-V, r-IV, r-III, r-II to r-I-mode). Although we did not observe dynamic movement of interdigitations, we assume that interdigitations repeatedly elongate and shorten two times per cycle. The first elongation and shortening appeared to synchronize with the appearance of “grooves” and the second synchronized with the disappearance of the “grooves.” We hypothesize two-time elongation-and-shortenings in one broadening and narrowing cycle of 2-day in case of overload removal of “even” number day-overloaded hearts as follows (Figure 18). [First-time elongation-and-shortening] All interdigitations elongate from I-mode to r-IV-mode in two-steps. First, one-sarcomere-long interdigitations grow sporadically in rows bilaterally like spikes (I-mode to r-V-mode). Second, into the spaces surrounded by spiked-interdigitations, interdigitations elongate alternately in one direction and in contra-lateral direction (r-V-mode to r-IV-mode). Consequently, grooves and contra-grooves appear. This interdigitation elongation couples with the disposal of one-sarcomere-long myofibril bundles so that the heart keeps contracting in this stage (disappearance of yellow-colored myofibril bundles from r-V-mode to r-IV-mode in Figure 18). From r-IV-mode to r-III-mode all elongated interdigitations shorten. [Second-time elongation-and-shortening] Two interdigitations elongate into grooves from r-III to r-II-mode so that grooves disappear. This interdigitation elongation couples with the disposal of one-sarcomere-long myofibril bundles so that the heart keeps contracting in this stage (disappearance of red-colored myofibril bundles from r-III-mode to r-II-mode in Figure 18). From r-II-mode to r-I-mode, all elongated interdigitations shorten. Consequently, ICDs dispose two layers of sarcomere during one reverse cycle. Immunohistochemical observation revealed wide zones with no myosin filaments, vague and irregular actin, and irregular desmin at r-IV mode. Therefore, this ICD mode shift runs parallel to a dynamic change of these filaments; however, we could not analyze changes of individual filaments within ICDs with this immunohistochemical magnification. In the TEM images assumed from r-V mode to r-IV-mode or r-III-mode to r-II-mode, we found scanty myofibril spaces, which would be a kind of sequelae of sarcomere-disposal. Atrophy of the hearts has recently been discussed with relation to myocardial cell degeneration45,46,47; however, we could not find any evidence of autophagy, any debris of disposed sarcomere or any macrophages cleaning the debris. We consider that sarcomere disposal couples with sliding elongation of interdigitations within a hollow (or space) circumscribed by grooved wall (or spiked interdigitations) so that the supposed mechanical weakness appearing at the moment of sarcomere disposal is minimized. This process might be smooth and efficient not to remain any detectable evidence of autophagy or any debris of disposed sarcomeres.
Because ICDs of 2-, 4-, 14-, and 28-day (“even” number-day) overload-removed hearts of 4-week overloaded animals showed I-mode (narrow ICD) predominantly and those of 1-, 3-, 5-, 7-, and 21-day (“odd” number-day) overload-removed hearts of 4-week-overloaded animals showed IV-mode (broad ICD) predominantly, we assume that ICDs of 4-week-overloaded hearts keep the 2-day ICD cycle after overload removal until 4 weeks. When one cycle may dispose 2 sarcomeres as discussed above, myocytes would dispose 28 sarcomeres during this 4-week period. This rate of shortening is consistent with decrease rate of sarcomeres until 4-week (∼one-sarcomere per day) so that we assume that myocytes shorten keeping time with the cycle. Because this cycle rhythm is 2-day, we predict that, if ICDs of “odd” number day-overload-removed hearts show IV-mode (broad ICD), the cycle would continue. If ICDs of “odd” number day-overload-removed hearts show I-mode (narrow ICD), the cycle would stop. Because 6-week overload-removal of 4-week overloaded hearts (1.0-cycle) showed almost same myocyte length as 4-week overload-removal of 4-week overloaded heats, it is suspected that overload-induced elongated myocytes return their original length after same duration of overload-removal and they stop shortening at that point. This myocyte shortening was well consistent with the echocardiographic data showing normalization of Dd, EDV, SV, and CO and reduction of HW to the normal level at 1.0-cycle. Because 86% of animals were survived and EF was 50% at 1.0-cycle, we assume that there was no heart failure and hearts of 4-week-overloaded animals would compensate to the decreased overload during 4-week of overload removal.
Repetitions of overload and overload-removal showed similar repeat of myocardial elongation and shortening up to three times, which were well consistent with three-time enlargement and constriction of the heart shown by echocardiographic data and gross appearance. Because 78% of animals survived in 1.5-cycle, 2.0-cycle, and 3.0-cycle animals, EF at 1.5-cycle and 2.5-cycle was 45% to 50%, and myocytes at 2.0- and 3.0-cycle were as long as control, we assume that there was no heart failure and hearts of 4-week overloaded animals would compensate to the decreased overload during 6 weeks of overload removal at 2.0 and 3.0 cycles as well. We predict that overload induced myocyte elongation and overload-removal-induced myocyte shortening are reversible and repeatable. Because the five modes that appear during overload and overload-removal are similar in morphology and the order of five modes is opposite, we hypothesize that the disposal of myofibrils is the reversal of myofibrillogenesis. Therefore at any instance (of modes) during volume overload or overload removal, myofibrillogenesis or disposal of myofibrils may shift to disposal of myofibrils or myofibrillogenesis, when the state of volume overload changes to the state of overload removal or the state of overload removal changes to the state of volume overload, respectively. This is as if ICDs weave or unravel two sarcomeres per 2-day ICD cycle (one sarcomere per day) using elongation-and-shortening of interdigitations to adapt volume-load change.
Because three chaperons, Tcp1-α, UNC45B, and Hsp90, and one ubiquitin ligase, MuRF1, showed constant activity during 2-day ICD cycle after volume overload and after overload removal of overloaded hearts, and immunofluorescent observations of these proteins did not show specifically intensely stained portions within myocytes and around ICDs, basic chaperon and protein ligase systems17 would be kept constant during a 2-day cycle. These findings are consistent with the known evidences that volume overload stimulates protein synthesis not so distinctive to explain enlargement and dilatation of volume-overloaded hearts.7,12,15,16 With immunohistochemical and immunofluorescent observations on actin, myosin, titin, and desmin,42,43 we found preserved sarcomeres of myocytes throughout cycles after overload and after overload removal of the overloaded heart. We consider that volume overload-induced sarcomerogenesis and overload removal-induced sarcomere disposal occur selectively in and around ICDs with keeping basic molecular dynamics in the body of myocytes.
Volume overload experiments using dog2,12,13 and rat4,5,6,7,8,9,11 showed similar gradual enlargement and dilatation of hearts as we observed in the rabbits. Therefore, it is probable that, in mammalian hearts including human, myocytes gain (or loose) sarcomere layer according to the volume overload (or overload removal) using ICD weaving machinery. Therefore, left ventricle size is always in equilibrium with its volume load, which inevitably follows the existence of volume load-sensing mechanism. It is well known that mechanical stress-strain sensors are embedded in cardiac cytoskeleton: Z disk, titin, and associated structures.44,48,49 In these cases, myocytes are quickly responding to adapt to stress-strain change before myocytes change their basic structure. However, it is unclear how myocytes chronically adapt to the stress-strain change. As retractile interdigitations are supposed to play important role in the adaptation process in our present experiments, it is necessary to clarify the dynamic molecular change of ICDs during a 2-day cycle. However, as far as we reviewed, we found no reports concerning molecular change according to the interdigitation elongation-and-shortening. Irregular ICDs, including widened ICDs and multiple ICDs, were known to exist in cardiac hypertrophy,22,24,25 growing heart,23 hypertrophic cardiomyopathy,26 and genetically SRF-disrupted mice.27 It is assumed that some of these ICDs were attained by the physiological volume-overloaded conditions and some were in the pathological conditions suggesting stressed ICDs caused by failing of compensation. Therefore, we consider that it is useful to use ICD microscopic changes as deducing indicator of volume-overload condition followed by our supposed 2-day ICD cycle, when hearts are supposed to be clinically loaded by various flow conditions.
Recently, myocytes have become shown to exhibit a circadian cycle.50,51 Although our experiments were performed with no regard to the night and day, we eventually found the 2-day cycle of the broadening and narrowing of ICD, which consisted of one interdigitation elongation-and-shortening per day. This cycle seems very accurate, because it is thought to cycle nearly 28 times without error. This is to say that ICD cycle synchronizes with circadian cycle. We speculate that this ICD cycle may relate to the circadian cycle and therefore both dilatation and contraction of hearts also relate to the circadian cycle, although we did not prove circadian related protein activity. This speculation shall be further investigated.
In summary, we reported a 2-day broadening and narrowing cycle of ICD after volume overload in proportion to cardiac dilation and myocyte elongation. This cycle consisted of the shift of five ICD modes characterized by two-time interdigitation elongation-and-shortening. After overload removal of overloaded rabbits, hearts contracted and myocytes shortened with similar 2-day broadening and narrowing cycle of ICD, in which five modes shifted reversely. We suppose that during each interdigitation elongation-and-shortening, the one-sarcomere layer assembles or disposes. The second of two-consecutive interdigitation elongation-and-shortening occurs exactly complementary to the first so that ICD configuration returns to its original configuration after each cycle. Although we could not provide molecular evidence explaining the dynamic ICD mode shift, we suggest that the body of myocytes does not contribute these assembly and disposal of sarcomeres, because we found constant activities of chaperons and ubiquitin ligase, which are known to contribute to the dynamic sarcomere preservation during the two-time ICD cycle after overload or after overload removal. We consider that ICDs are the special structure, which manipulates sarcomere assembly and disposal like weaving and unraveling machinery.
Acknowledgments
We thank Miss Yuki Yoshinari and Miss Sumie Aoki for technical assistance and Mr. Shonan Sho (University of Pittsburgh School of Medicine) and Dr. Chengpei Xu and Dr. Christopher K Zarins (Vascular Surgery, Stanford University School of Medicine) for reviewing the manuscript.
Footnotes
Address reprint requests to Hirotake Masuda, M.D., Ph.D., Professor, Department of Pathology and Immunology, Akita University Graduate School of Medicine, 1-1-1 Hondo, Akita 010-8543 Japan. E-mail: masuda@med.akita-u.ac.jp.
Supported in part by the grants (19590381, 20500573) from Ministry of Education, Culture, Sports, and Science of Japan.
References
- Linzbach AJ. Heart failure from the point of view of quantitative anatomy. Am J Cardiol. 1960;5:370–382. doi: 10.1016/0002-9149(60)90084-9. [DOI] [PubMed] [Google Scholar]
- Ross J., Jr Adaptations of the left ventricle to chronic volume overload. Circ Res. 1974;35 suppl II:64–70. doi: 10.1016/0002-9149(75)90774-2. [DOI] [PubMed] [Google Scholar]
- Hunter JJ, Chien KR. Signaling pathways for cardiac hypertrophy and failure. New Eng J Med. 1999;341:1276–1283. doi: 10.1056/NEJM199910213411706. [DOI] [PubMed] [Google Scholar]
- Gerdes AM, Campbell SE, Hilbelink DR. Structural remodeling of cardiac myocytes in rats with arteriovenous fistulas. Lab Invest. 1988;59:857–861. [PubMed] [Google Scholar]
- Huang M, Hester RL, Guyton AC. Hemodynamic changes in rats after opening an arteriovenous fistula. Am J Physiol. 1992;262:H846–H851. doi: 10.1152/ajpheart.1992.262.3.H846. [DOI] [PubMed] [Google Scholar]
- Ruzicka M, Leenen FHH. Relevance of blockade of cardiac and circulatory angiotensin-converting enzyme for the prevention of volume overload-induced cardiac hypertrophy. Circulation. 1995;91:16–19. doi: 10.1161/01.cir.91.1.16. [DOI] [PubMed] [Google Scholar]
- Di Fusco F, Hashim S, Anand-Srivastava MB. Volume overload cardiac hypertrophy exhibits decreased expression of Gsα and not of Giα in heart. Am J Physiol Cell Physiol. 2000;279:C990–C998. doi: 10.1152/ajpcell.2000.279.4.C990. [DOI] [PubMed] [Google Scholar]
- Yamakawa H, Imamura T, Matsuo T, Onitsuka H, Tsumori Y, Kato J, Kitamura K, Koiwaya Y, Eto T. Diastolic wall stress and ANG II in cardiac hypertrophy and gene expression induced by volume overload. Am J Physiol Heart Circ Physiol. 2000;279:H2939–H2946. doi: 10.1152/ajpheart.2000.279.6.H2939. [DOI] [PubMed] [Google Scholar]
- Holmes JW. Candidate mechanical stimuli for hypertrophy during volume overload. J Appl Physiol. 2004;97:1453–1460. doi: 10.1152/japplphysiol.00834.2003. [DOI] [PubMed] [Google Scholar]
- Takahashi N, Atsumi H, Nakada S, Takeishi Y, Tomoike H. Alterations in the inotropic responses to forskolin and Ca2+ and reduced gene expression of Ca2+-signaling proteins induced by chronic volume overload in rabbits. Jpn Circ J. 2000;64:861–867. doi: 10.1253/jcj.64.861. [DOI] [PubMed] [Google Scholar]
- Isoyama S, Grossman W, Wel JY. Effect of age on myocardial adaptation to volume overload in the rat. J Clin Invest. 1988;81:1850–1857. doi: 10.1172/JCI113530. [DOI] [PMC free article] [PubMed] [Google Scholar]
- Matsuo T, Carabello BA, Nagatomo Y, Koide M, Hamawaki M, Zile MR, McDermott PJ. Mechanisms of cardiac hypertrophy in canine volume overload. Am J Physiol Heart Circ Physiol. 1998;275:H65–H74. doi: 10.1152/ajpheart.1998.275.1.h65. [DOI] [PubMed] [Google Scholar]
- Nagatomo Y, Carabello BA, Coker M, McDermott PJ, Nemoto S, Hamawaki M, Spinale FG. Differential effects of pressure or volume overload on myocardial MMP levels and inhibitory control. Am J Physiol Heart Circ Physiol. 2000;278:H151–H161. doi: 10.1152/ajpheart.2000.278.1.H151. [DOI] [PubMed] [Google Scholar]
- Masuda H, Yamauchi M, Yoshida M, Takahashi M, Nanjo H, Asari Y, Sugita A. Side-to-side linking of myocardial cells in hypertrophic cardiomyopathy: whole heart microscopic observation with tangential sections. Path Int. 2005;55:677–687. doi: 10.1111/j.1440-1827.2005.01894.x. [DOI] [PubMed] [Google Scholar]
- Imamura T, McDermott PJ, Kent RL, Nagatsu M, Cooper G, 4th, Carabello BA. Acute changes in myosin heavy chain synthesis rate in pressure versus volume overload. Circ Res. 1994;75:418–425. doi: 10.1161/01.res.75.3.418. [DOI] [PubMed] [Google Scholar]
- Donker DW, Maessen JG, Verheyen F, Ramaekers FC, Spatjens RL, Kuijpers H, Ramakers C, Schiffers PM, Vos MA, Crijns HJ, Volders PG. Impact of acute and enduring volume overload on mechanotransduction and cytoskeletal integrity of canine left ventricular myocardium. Am J Physiol Heart Circ Physiol. 2007;292:H2324–H2332. doi: 10.1152/ajpheart.00392.2006. [DOI] [PubMed] [Google Scholar]
- Willis MS, Schisler JC, Portbury AL, Patterson C. Built it up-tear it down: protein quality control in the cardiac sarcomere. Cardiovasc Res. 2009;81:439–448. doi: 10.1093/cvr/cvn289. [DOI] [PMC free article] [PubMed] [Google Scholar]
- Krstic RV. Berlin, Heidelberg, New York, Tokyo,: Springer-Verlag,; Illustrated encyclopedia of human histology. 1984:p 204. [Google Scholar]
- Forbes MS, Sperelakis N. Intercalated discs of mammalian heart: a review of structure and function. Tissue Cell. 1985;17:605–648. doi: 10.1016/0040-8166(85)90001-1. [DOI] [PubMed] [Google Scholar]
- Ogata T, Yamasaki Y. High-resolution scanning electron microscopic studies on the three-dimensional structure of the transverse-axial tubular system, sarcoplasmic reticulum and intercalated disc of the rat myocardium. Anat Rec. 1990;228:277–287. doi: 10.1002/ar.1092280307. [DOI] [PubMed] [Google Scholar]
- Heidenhain M. Uber die Structure des menschlichen Herzmuskels. Anat Anz. 1901;20:33–78. [Google Scholar]
- Laks MM, Morady F, Adomian GE, Swan HJC. Presence of widened and multiple intercalated disc in the hypertrophied canine heart. Circ Res. 1970;27:391–402. doi: 10.1161/01.res.27.3.391. [DOI] [PubMed] [Google Scholar]
- Legato MJ. Cellular mechanisms of normal growth in the mammalian heart. I. Qualitative and quantitative features of ventricular architecture in the dog from birth to five months of age. Circ Res. 1979;44:250–262. doi: 10.1161/01.res.44.2.250. [DOI] [PubMed] [Google Scholar]
- Legato MJ, Mulieri LA, Alpert NR. The ultrastructure of myocardial hypertrophy; why does the compensated heart fail? Eur Hear J. 1984;5:251–269. doi: 10.1093/eurheartj/5.suppl_f.251. [DOI] [PubMed] [Google Scholar]
- Laks MM, Morady F, Adomian GE, Swan HJC. Presence of widened and multiple intercalated discs in the hypertrophied canine heart. Circ Res. 1970;28:391–402. doi: 10.1161/01.res.27.3.391. [DOI] [PubMed] [Google Scholar]
- Maron BJ, Ferrans VJ. Significance of multiple intercalated discs in hypertrophied human myocardium. Am J Pathol. 1973;73:81–96. [PMC free article] [PubMed] [Google Scholar]
- Parlakian A, Charvet C, Escoubet B, Mericskay M, Molkentin JD, Gary-Bobo G, De Windt LJ, Ludosky M-A, Paulin D, Daegelen D, Tuil D, Li Z. Temporally controlled onset of dilated cardiomyopathy through disruption of the SRF gene in adult hearts. Circulation. 2005;112:2930–2939. doi: 10.1161/CIRCULATIONAHA.105.533778. [DOI] [PubMed] [Google Scholar]
- Yu J-G, Russell B. Cardiomyocyte remodeling and sarcomere addition after uniaxial static strain in vitro. J Histochem Cytochem. 2005;53:839–844. doi: 10.1369/jhc.4A6608.2005. [DOI] [PubMed] [Google Scholar]
- Bennett PM, Maggs AM, Baines AJ, Pinder JC. The transitional junction: a new functional subcellular domain at the intercalated disc. Mol Biol Cell. 2006;17:2091–2100. doi: 10.1091/mbc.E05-12-1109. [DOI] [PMC free article] [PubMed] [Google Scholar]
- Masuda H, Kawamura K, Sugiyama T, Kamiya A. Effects of endothelial denudation in flow-induced arterial dilatation. Front Med Biol Eng. 1993;5:57–62. [PubMed] [Google Scholar]
- Masuda H, Zhuang Y-J, Singh TM, Kawamura K, Murakami M, Zarins CK, Glagov S. Adaptive remodeling of internal elastic lamina and endothelial lining during flow-induced Arterial enlargement. Arterioscler Thromb Vasc Biol. 1999;19:2298–2307. doi: 10.1161/01.atv.19.10.2298. [DOI] [PubMed] [Google Scholar]
- Sho E, Sho M, Singh TM, Nanjo H, Komatsu M, Xu C, Masuda H, Zarins CK. Arterial enlargement in response to high flow requires early expression of matrix metalloproteinases to degrade extracellular matrix. Exp Mol Pathol. 2002;73:142–153. doi: 10.1006/exmp.2002.2457. [DOI] [PubMed] [Google Scholar]
- Sho E, Komatsu M, Sho M, Nanjo H, Singh TM, Xu C, Masuda H, Zarins CK. High flow drives vascular endothelial cell proliferation during flow-induced arterial remodeling associated with the expression of vascular endothelial growth factor. Exp Mol Pathol. 2003;75:1–11. doi: 10.1016/s0014-4800(03)00032-7. [DOI] [PubMed] [Google Scholar]
- Sho E, Sho M, Singh TM, Xu C, Zarins CK, Masuda H. Blood flow decrease induces apoptosis of endothelial cells in previously dilated arteries resulting from chronic high blood flow. Arterioscler Thromb Vasc Biol. 2001;21:1139–1145. doi: 10.1161/hq0701.092118. [DOI] [PubMed] [Google Scholar]
- Sho M, Sho E, Singh TM, Komatsu M, Sugita A, Xu C, Nanjo H, Zarins CK, Masuda H. Subnormal shear stress-induced intimal thickening requires medial smooth muscle cell proliferation and migration. Exp Mol Pathol. 2002;72:150–160. doi: 10.1006/exmp.2002.2426. [DOI] [PubMed] [Google Scholar]
- Zhuang YJ, Singh TM, Zarins CK, Masuda H. Sequential increases and decreases in blood flow stimulates progressive intimal thickening. Eur J Vasc Endovasc Surg. 1998;16:301–310. doi: 10.1016/s1078-5884(98)80049-x. [DOI] [PubMed] [Google Scholar]
- Sho E, Nanjo H, Sho M, Kobayashi M, Komatsu M, Kawamura K, Xu C, Zarins CK, Masuda H. Arterial enlargement, tortuosity, and intimal thickening in response to sequential exposure to high and low wall shear stress. J Vasc Surg. 2004;39:601–612. doi: 10.1016/j.jvs.2003.10.058. [DOI] [PubMed] [Google Scholar]
- Pombo JF, Troy BL, Russell RO., Jr Left ventricular volumes and ejection fraction by echocardiography. Circulation. 1971;43:480–490. doi: 10.1161/01.cir.43.4.480. [DOI] [PubMed] [Google Scholar]
- Teichholz LE, Kreulen T, Herman MV, Gorlin R. Echocardiographic-angiographic correlations in the presence or absence of asynergy. Am J Cardiol. 1976;37:7–11. doi: 10.1016/0002-9149(76)90491-4. [DOI] [PubMed] [Google Scholar]
- Sonnenblick EH, Ross J, Jr, Covell JW, Spotnitz HM, Spiro D. The ultrastructure of the heart in systole and diastole. Circ Res. 1967;21:423–431. doi: 10.1161/01.res.21.4.423. [DOI] [PubMed] [Google Scholar]
- Streeter DD., Jr Berne RM, Sperelakis N, Geiger SR, editors. Bethesda: American Physiological Society,; 1979:pp 61–112. [Google Scholar]
- Michele DE, Albayya FP, Metzger JM. Thin filament protein dynamics in fully differentiated adult cardiac myocytes: toward a model of sarcomere maintenance. J Cell Biol. 1999;145:1483–1495. doi: 10.1083/jcb.145.7.1483. [DOI] [PMC free article] [PubMed] [Google Scholar]
- Gregorio CC, Antin PB. To the heart of myofibril assembly. Trends Cell Biol. 2000;10:355–362. doi: 10.1016/s0962-8924(00)01793-1. [DOI] [PubMed] [Google Scholar]
- Pyle WG, Solaro RJ. At the crossroads of myocardial signaling. The role of Z-discs in intracellular signaling and cardiac function. Circ Res. 2004;94:296–305. doi: 10.1161/01.RES.0000116143.74830.A9. [DOI] [PubMed] [Google Scholar]
- Razeghi P, Taegtmeyer H. Hypertrophy and atrophy of the heart. The other side of remodeling. Ann NY Acad Sci. 2006;1080:110–119. doi: 10.1196/annals.1380.011. [DOI] [PubMed] [Google Scholar]
- Galvez AS, Diwan A, Odley AM, Hahn HS, Osinska H, Melendez JG, Robbins J, Lynch RA, Manreez Y, Dorn GW., II Cardiomyocyte degeneration with calpain deficiency reveals a critical role in protein homeostasis. Circ Res. 2007;100:1071–1078. doi: 10.1161/01.RES.0000261938.28365.11. [DOI] [PubMed] [Google Scholar]
- Nakai A, Yamaguchi O, Takeda T, Higuchi Y, Hikoso S, Taniike M, Omiya S, Mizote I, Matsumura Y, Asahi M, Nishida K, Hori M, Mizushima N, Otsu K. The role of autophagy in cardiomyocytes in the basal state and in response to hemodynamic stress. Nat Med. 2007;13:619–624. doi: 10.1038/nm1574. [DOI] [PubMed] [Google Scholar]
- Miller MK, Granzier H, Ehler E, Gregorio CC. The sensitive giant: the role of titin-based stretch sensing complexes in the heart. Trends in Cell Biol. 2004;14:119–126. doi: 10.1016/j.tcb.2004.01.003. [DOI] [PubMed] [Google Scholar]
- Hoshijima M. Mechanical stress-strain sensors embedded in cardiac cytoskeleton: z disc, titin, and associated structures. Am J Physiol Heart Circ Physiol. 2006;290:H1313–H1325. doi: 10.1152/ajpheart.00816.2005. [DOI] [PMC free article] [PubMed] [Google Scholar]
- Boateng SY, Goldspink PH. Assembly and maintenance of the sarcomere night and day. Cardiovasc Res. 2008;77:667–675. doi: 10.1093/cvr/cvm048. [DOI] [PubMed] [Google Scholar]
- Young ME. The circadian clock within the heart: potential influence on myocardial gene expression, metabolism, and function. Am J Physiol Heart Circ Physiol. 2006;290:H1–H16. doi: 10.1152/ajpheart.00582.2005. [DOI] [PubMed] [Google Scholar]