

Abstract
Iron overload is a risk factor for hepatocarcinoma, but the pathways involved are poorly characterized. Gene expression analysis in immortalized mouse hepatocytes exposed to iron or the iron chelator deferoxamine revealed that iron downregulated, whereas deferoxamine upregulated, mRNA levels of mouse double minute gene 2 (MDM2), the ubiquitin ligase involved in the degradation of the oncosuppressor p53. Regulation of MDM2 by iron status was observed at protein levels in mouse hepatocytes and rat liver, and was associated with specular changes in p53 expression. Iron dependent regulation of MDM2/p53 was confirmed ex-vivo in human monocytes, by manipulation of iron pool and in a genetic model of iron deficiency, leading to modulation of p53 target genes involved in the antioxidant response and apoptosis. Iron status influenced p53 ubiquitination and degradation rate, and the MDM2 inhibitor nutlin increased p53 levels in iron-depleted cells. Furthermore, nutlin enhanced the antiproliferative activity of deferoxamine in HepG2 hepatoblastoma cells. The MDM2 −309T > G promoter polymorphism, determining increased MDM2 and lower p53 activity, was associated with higher risk of hepatocarcinoma in cirrhotic patients with hemochromatosis, and with HFE mutations in patients with hepatocarcinoma without hemochromatosis, suggesting an interaction between MDM2 and iron in the pathogenesis of hepatocarcinoma. In conclusion, iron status influences p53 activity and antioxidant response by modulating MDM2 expression. MDM2 inhibitors may enhance the antiproliferative activity of iron chelators.
Hepatocellular iron accumulation, either genetic due to hereditary hemochromatosis (HH) or acquired due to alcohol abuse, chronic hepatitis C virus infection, or porphyria cutanea tarda, is a frequent cause of liver damage and has been associated with increased risk of developing hepatocellular carcinoma (HCC), a leading cause of cancer related death worldwide.1,2,3,4 Furthermore, increased iron stores have been reported to be a risk factor for other neoplasia, such as breast and colon cancer,5 whereas iron reduction therapy has been associated with a decreased incidence of cancer.6
A role for iron overload in HCC development is supported by several lines of evidence including increased concentrations of iron in non-neoplastic liver tissue of patients who underwent liver transplantation for liver cancer,7 and an augmented risk of developing liver cancer in patients with HH.5 Epidemiological data have shown that common mutations of the hemochromatosis gene, HFE, the gene responsible for HH representing the major inherited determinant of iron status in Caucasians, interact with acquired cofactors, such as chronic viral infections and alcohol abuse, in the pathogenesis of HCC.1,4
Deregulation of cellular iron metabolism has been shown to contribute to the malignant phenotype induced by oncogene expression,8 and by loss of tumor suppressors,9 whereas alterations in iron homeostasis progressively determine intracellular iron accumulation during multistep carcinogenesis in solid neoplasia.10,11 Hence, iron chelators are under study as potential antineoplastic drugs.12
Oxidative stress is believed to play a role in iron-induced carcinogenesis, possibly by regulating CyclinD1, p27 and Cdk2, whereas iron depletion may halt the cell cycle progression by modulating the expression of p21 and Cyclin D1.13 However, elucidation of the complex effects of iron on the expression of molecules involved in cell cycle control remains in its infancy,13 and the cellular pathways and molecular targets of iron-induced oxidative stress contributing to the increased risk of HCC have not been characterized.
Aims of the present study, were I) to identify iron-regulated gene pathways involved in hepatocarcinogenesis by evaluating gene expression profiles in iron supplemented compared with iron depleted immortalized mouse hepatocytes; II) to confirm these data at protein levels in vitro in hepatocytes, ex vivo in human monocytes, and in vivo in rat liver, and to characterize the underlying molecular mechanisms of regulation; and, III) to assess the clinical impact of these findings by evaluating the effect of genetic variants of the identified genes on HCC risk in patients with iron overload.
The results of our initial analysis of microarrays data indicated that iron status regulates the expression of mouse double minute gene 2 (MDM2), which is involved in the control of p53 activity and degradation through ubiquitination.14 Besides regulating cell cycle and apoptosis, the oncosuppressor p53 induces antioxidant enzymes, thus protecting cells from reactive oxygen species-mediated DNA damage and carcinogenesis,15 and is frequently mutated in HCC, in particular in the presence of oxidative stress and iron overload.16 Our results show that iron overload-mediated reduction in MDM2 levels leads to p53 upregulation and consequent induction of antioxidant enzymes, thereby providing a mechanism to counteract iron-related oxidative stress. Furthermore, we observed a synergic effect of the MDM2 −309 promoter polymorphism, determining higher MDM2 and lower p53 activity,17 and HFE mutations in the determination of HCC susceptibility in humans. These data shed light on the mechanisms underpinning iron-induced carcinogenesis and may be helpful to enhance therapeutic approaches for cancer based on the use of iron chelators.
Materials and Methods
Cell Culture
SV40 immortalized fetal mouse hepatocytes isolated from embryonic livers of wild-type mice (henceforth SV40 hepatocytes) were maintained in α-minimal essential medium supplemented with 1 mmol/L l-glutamine, 4% fetal calf serum, 1% penicillin-streptomycin, and 200 nmol/L dexamethasone at 37°C in a 5% CO2 incubator.18 Cell viability was assessed in triplicate by trypan blue exclusion dye test.
When appropriate, cells were treated with 100 μmol/L deferoxamine (Dfo), 150 μmol/L ferric ammonium citrate (FAC), 0.33 μmol/L insulin (Sigma, St. Louis, MO), 60/120 μmol/L vitamin E (Sigma), 10 mmol/L N-acetylcysteine (NAC) (Sigma), 10 μmol/L H2O2 (Sigma). Unless otherwise specified, treatments were started 24 hours after cell plating.
To evaluate whether the effect of iron on p53 was mediated by MDM2, cells were treated for 24 hours with the inhibitor of the MDM2/p53 interaction Nutlin-3 (25 μmol/L for 24 hours),19,20 and with the proteasomal inhibitor MG132 (0.5 μmol/L for 24 hours, from Sigma).21
To evaluate p53 degradation kinetics cells were treated with the protein synthesis inhibitor cycloheximide (CHX: 40 μg/ml, from Sigma). Cells were pre-incubated for 24 hours with FAC or Dfo and then treated with CHX for up to 8 hours. Results were normalized for β-actin.
Total RNA Extraction and Purification
RNA was isolated by a guanidinium isothiocyanate phenol-chloroform procedure using Trizol (Invitrogen, Carlsbad, CA) and purified using the RNeasy total RNA isolation kit (Qiagen, Valencia, CA).
Gene Expression Profiles Analysis
SV40 hepatocytes were cultured in standard medium or treated with 150 μmol/L FAC or 100 μmol/L Dfo for 24 hours. Four replicates were performed for each condition tested, and the whole experiment was repeated in two independent cell lines isolated from different mice. Biotin-labeled cRNA was prepared according to the GeneChip expression analysis technical manual protocol (Affymetrix Inc., Santa Clara, CA). Briefly, 5 μg of total RNA were converted into double strand cDNA using the Custom SuperScript Double Stranded cDNA Synthesis Kit (Invitrogen, Carlsbad, CA). Biotinylated cRNA was generated by an in vitro transcription reaction using the Enzo Bioarray high Yield RNA Transcript Labeling Kit (Enzo Life Science, Inc., Farmingdale, NY) and purified using the RNeasy total RNA isolation kit (Qiagen, Valencia, CA). 15 μg of fragmented cRNA were hybridized on GeneChip Mouse Genome U340 Arrays (Affymetrix Inc., Santa Clara, CA) after quality checking on GeneChip Test 3 Arrays (Affymetrix Inc., Santa Clara, CA). After scanning, the images were processed using Affymetrix MicroArray Suite (MAS) 5.0 software to generate gene expression intensity values. Arrays normalization was performed using the MAS 5.0 “global scaling” procedure. The genes whose expression did not vary across the data set were not considered for further analysis.
To identify genes significantly modulated by treatment with FAC or Dfo compared with controls in each cell line, supervised gene expression analysis was performed using the Genes@work software platform. Genes@work is a gene expression analysis tool based on the structural pattern localization analysis by sequential histograms (SPLASH) algorithm,22 which discovers global gene expression signatures that are common to an entire set of experiments (the support set). Briefly, differentially expressed genes are identified by comparing an expected gene expression probability density, empirically computed from the experimental set, with a predefined threshold (which was set to 0.02). Patterns of differentially expressed genes are then ranked according to their statistical significance.23
As a second step, we identified genes that according to the previous analysis were regulated in opposite ways (down-regulated and up-regulated or vice versa) by FAC and Dfo in each cell line. Finally, we selected among the genes coming out from step two only the ones whose pattern of regulation was confirmed in both cell lines.
Iron Regulatory Protein Activity Assay
Iron regulator protein (IRP) activity reflecting intracellular free iron availability (the higher IRP activity the lower iron availability) was measured by RNA band shift assay as previously described.24
Western Blot Analysis
Cells were lysed in RIPA buffer containing 1 mmol/L Na-orthovanadate, 200 mmol/L phenyl-methyl-sulfonyl fluoride, and 0.02 μg/μl aprotinin. Equal amounts of total cellular proteins (50 μg) were separated by SDS gel electrophoresis and transferred electrophoretically to polyvinylidene difluoride membrane (Bio-Rad, Hercules, CA). Membranes were incubated with anti-MDM2, p53, and β-actin antibodies (Santa Cruz Biotechnology, Santa Cruz, CA). Immunoprecipitation was performed using anti-p53 antibodies (Santa Cruz Biotechnology, Santa Cruz, CA). The immunoprecipitated proteins were processed for electrophoresis and Western blotting using anti-ubiquitin antibody (Santa Cruz). For quantitative analysis gels were scanned and analyzed by ImageJ Software provided by the national Institute of Health (Bethesda, MD) as previously described.25
Isolation of Peripheral Blood Monocytes
Peripheral blood monocytes were obtained from patients with hereditary hemochromatosis homozygous for the C282Y/C282Y HFE mutation and controls negative for the C282Y and H63D HFE mutations and with normal iron parameters by using the Lymphoprep method and anti-CD14 coated microbeads (Miltenyi Biotech, Bergisch-Gladbach, Germany), as previously described.26 Monocytes of patients with HH are known to have a defect in iron retention compared with control cells with wild-type HFE, thus representing a naturally occurring genetic model of cellular iron deficiency.27,28 Human monocytes were cultured in RPMI 1640 medium supplemented with 1 mmol/L l-glutamine, 10% fetal calf serum, and 1% Pencillin-Streptomicyn (PS) at 37°C in a 5% CO2 incubator. Cells were treated with 100 or 120 μmol/L Dfo, 150 or 500 μmol/L FAC, 10 μmol/L H2O2.
Effect of Iron Status on Cell Proliferation in HepG2 Cells
HepG2 cells were maintained in RPMI 1640 medium supplemented with 1 mmol/L l-glutamine, 10% fetal calf serum, and 1% penicillin-streptomycin at 37°C in a 5% CO2 incubator.18
Cells were treated with 120 μmol/L deferoxamine (Dfo), 150 μmol/L FAC in the presence or absence of Nutlin-3 25 μmol/L for 24 hours. Cells were then detached by trypsinization and live cells were counted. Cell viability was assessed in triplicate by trypan blue exclusion dye test.
3H-Thymidine Incorporation Assay
HepG2 cells were cultured in serum free RPMI 1640 medium in the presence or absence of 150 μmol/L FAC and 120 μmol/L Dfo and 0.33 μmol/L insulin for 24 hours. Then, 3H-thymidine (1μCi/dish) (Amersham, Stockholm, Sweden) was added to the medium and cells were incubated for 3 hours at 37°C. Unbound 3H-thymidine was removed by rinsing the cells three times with PBS and the bound radioactivity measured by a β-counter.
Quantitative Real Time PCR
First-strand cDNA was synthesized with equal amounts (1 μg) of total RNA by the Superscript first strand synthesis system (Invitrogen) with random hexamers. Quantitative real time PCR was performed with TaqMan universal master mix (1×), plus the assay specific for the genes analyzed (MyScience; Applied Biosystem, Foster City, CA). All of the reactions were performed in triplicate in the Opticon analyzer (BioRad, Hercules, CA), in a 25 μl final volume.
Animal Model
Male Sprague-Dawley rats weighing 180 to 200 g (Charles River, Calco, Italy) were maintained at the preclinical Research Center of the Ospedale Policlinico, Milan, Italy, in compliance with the Principles of Laboratory Animal Care. They were fed ad libitum and kept in a climate-controlled room with a 12-hour dark-light cycle. Rats were either iron depleted by daily injections of 200 mg/kg Dfo or injected with vehicle (0.9% saline) for 2 weeks. The experimental protocol was approved by the local ethical committee. Animals were sacrificed under anesthesia by exsanguination and samples of liver collected. Blood hematocrit and serum iron levels were measured by standard methods. Hepatic iron concentration was measured by atomic absorption spectrometry. Quantitative real time PCR and Western blotting were performed as described above. Results were normalized for β-actin.29
Genetic Analysis of −309 MDM2 Polymorphism and HFE Mutations in Patients
The −309 T > G MDM2 promoter polymorphism and the C282Y and H63D HFE mutations were retrospectively evaluated in a cohort of 74 patients with cirrhosis due to HH. These represent all patients with cirrhosis due to HH in regular follow-up at our center with ultrasonography and AFP evaluation performed every 4 months for HCC screening, for at least 1 year. The prevalence of HCC in this cohort was assessed on January 1, 2008. The control group included 136 healthy subjects of the same geographical origin.30 Moreover, the MDM2 promoter polymorphism was also evaluated in 143 consecutive patients with HCC without HH due to mixed causes (cirrhosis related to chronic hepatitis C virus or hepatitis B virus infection, or alcohol abuse),1 all from Northern Italy, who were followed at our center between 2002 and 2008. In this case-only cohort, a significant association between risk factors for HCC would suggest the existence of an interaction in the pathogenesis of this condition.1
Genomic DNA was extracted from EDTA-preserved whole blood using the phenol-chloroform method. The −309 T > G MDM2 promoter polymorphism was detected by polymerase chain reaction and restriction analysis as previously described.17 Genotypes of random samples were confirmed by sequencing, which was consistent with restriction analysis in each case. HFE genotypes were determined by restriction analysis.1 Informed written consent was obtained from each subject analyzed.
Statistical Analysis
We performed descriptive statistics and analysis of variance using the JMP 6.0 software (SAS Institute Inc, Cary, NC). Results were expressed as means ± SD and compared by analysis of variance and χ2 test as required. P was considered significant when P ≤ 0.05 (two-tailed).
Results
Efficacy of FAC and Dfo Treatments in SV40 Hepatocytes
To confirm that exposure to Dfo and FAC modulated the intracellular iron pool in SV40 hepatocytes we used a RNA bandshift assay to measure the activity of the iron regulatory proteins, IRP1 and IRP2, key regulators of iron homeostasis that are activated by decreased intracellular iron availability (Figure 1). As expected, the binding activity of both IRPs decreased in cells treated with FAC as compared with untreated cells, but was remarkably activated in cells deprived of iron by exposure to the iron chelator Dfo. We also excluded that these treatments were toxic for SV40 hepatocytes, as cell viability evaluated by Trypan blue dye test was >95% for each treatment condition for the evaluated times (Figure 1).
Figure 1.
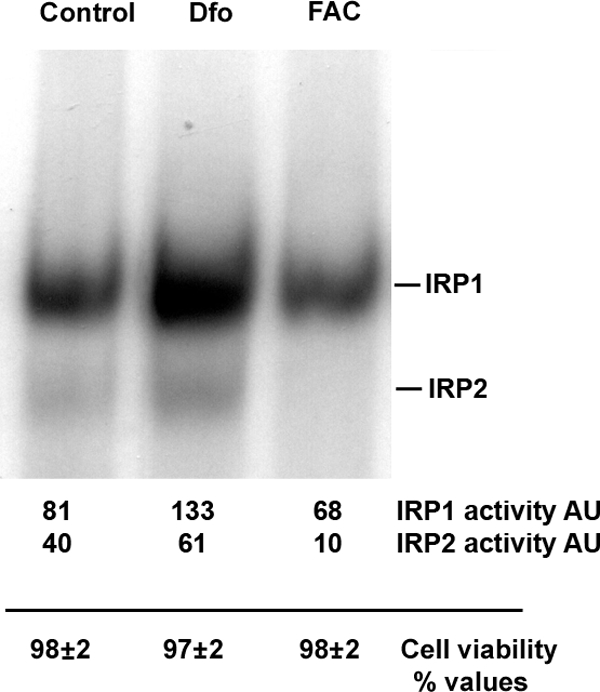
IRP activity as detected by IRP binding assay with relative densitometric quantification (top) and cell viability as detected by Trypan blue exclusion (bottom) according to iron status. AU: arbitrary units. SV40 hepatocytes were treated for 24 hours with 100 μmol/L Dfo (Dfo), 150 μmol/L FAC (FAC) or vehicle (Control). Cell viability was detected by Trypan blue exclusion and represents the mean ± SD of three independent experiments.
Identification of Genes Modulated in Opposite Ways by Dfo and FAC Treatments in SV40 Hepatocytes
To identify genes regulated in opposite ways by iron supplementation and iron depletion we performed gene expression evaluation by high-density oligonucleotide microarrays in two lines of SV40 hepatocytes. The whole data set of gene expression profiles is reported in Supplemental Table S1 at http://ajp.amjpathol.org. We identified five genes whose mRNA levels were oppositely regulated by iron status (Table 1). All of them were significantly up-regulated by Dfo and down-regulated by FAC compared with absence of treatment. Besides p21, previously shown to be induced by iron deprivation in cancer cell lines,13 we identified as iron regulated genes MDM2, an ubiquitin ligase involved in p53 degradation,31 and its co-activator cyclin G1,21 envoplakin, and Ero-1 like, an endoplasmic reticulum oxidase. Importantly, as compared with iron treatment, exposure to Dfo increased the expression of transferrin receptor-1 mRNA, which is known to be up-regulated by IRP when intracellular iron availability is low.28
Table 1.
Genes Significantly Regulated in Opposite Ways by FAC and Dfo in Two Independent Lines of SV40 Hepatocytes
| Gene | Dfo/FAC ratio |
|---|---|
| Mdm-2 | 3.3 |
| Envoplakin-1 | 2.7 |
| p21 | 2.4 |
| CyclinG1 | 2.3 |
|
Ero-1 like
|
1.5
|
| TfR-1 | 2.5 |
The relative mRNA expression in Dfo versus FAC treated cells is shown on the right; mRNA levels of TfR1 are shown as a control for iron status. Experimental design. Step I: gene expression evaluation in iron supplemented, control, and iron depleted cells in two cell lines. Step II: Identification of genes modulated by iron depletion/ supplementation versus control. Step III: Identification of genes modulated in opposite ways by iron depletion versus iron supplementation. Step IV: Identification of genes modulated in opposite ways in both of the two cell lines evaluated.
Effect of Iron Manipulation on MDM2 and p53 Protein Levels in SV40 Hepatocytes
We next confirmed by Western blotting in SV40 hepatocytes that incubation with 100 μmol/L Dfo for 24 hours increased, whereas 150 μmol/L FAC decreased MDM2 protein levels, as compared with untreated cells (Figure 2A). Iron supplementation by FAC was associated with increased H-ferritin protein levels compared with untreated and Dfo-treated cells (Figure 2A). Importantly, MDM2 up-regulation after Dfo treatment was associated with down-regulation of p53 protein levels, as compared with controls, whereas iron supplementation had the opposite effect (Figure 2A). Exposure to either FAC or Dfo did not alter p53 mRNA levels as determined by microarrays gene expression analysis (results not shown), suggesting posttranscriptional regulation of p53 protein levels by MDM2. The effect of iron depletion on p53 levels was dose-dependent. Indeed, increasing concentrations of Dfo progressively decreased p53 levels, whereas p53 protein content was higher in cells exposed to FAC than in untreated cells (Figure 2B, upper panel). These alterations in p53 protein levels were associated with specular changes in MDM2 mRNA expression (Figure 2B, lower panel).
Figure 2.

Effect of iron status on the MDM2/p53 pathway in SV40 mouse hepatocytes and in rat liver. A: Effect of Dfo and FAC on MDM2 and p53 protein levels in SV40 hepatocytes. Twenty-four hours after plating, cells were treated with 100 μmol/L Dfo (Dfo) or 150 μmol/L FAC (FAC) or vehicle for 24 hours and then lysed. MDM2, p53, and H-ferritin were detected in cell extracts by immunoblot analysis. The blots were reprobed with the antibody against β-actin as a loading control. B: Dose response relationship between iron availability and p53 protein levels in SV40 hepatocytes. Ct: control, untreated hepatocytes. Cells were treated for 24 hours with the indicated concentrations of FAC and Dfo. The upper part of the figure indicates the p53/β-actin ratio as detected by densitometry. AU: arbitrary units. Results are representative of two independent experiments. In the lower part of the figure the corresponding β-actin normalized MDM2 mRNA levels are shown. Results are representative of two independent experiments. *P < 0.05 vs. untreated cells. C: Effect of iron status on p53 protein and mRNA levels and cell viability in differentiating SV40 hepatocytes, at different days from cell plating. AU: arbitrary units. p53 AU indicates the p53/β-actin ratio as detected by densitometry. p53 mRNA levels were normalized for β-actin. *P < 0.05 vs. untreated cells 24 hours after plating (controls). Results are representative of two independent experiments. D: Effect of iron depletion by Dfo on serum iron, hepatic iron concentration, MDM2 and p53 protein levels in rat liver. White bars: control rats (n = 5), black bars: iron depleted rats (n = 4). Serum iron and hepatic iron concentration were measured by atomic absorption spectrometry. Protein expression of p53 and MDM2, was evaluated by densitometry and normalized for β-actin. AU: arbitrary units. *P ≤ 0.05 vs. control rats.
We next evaluated the time course of p53 expression after plating in differentiating SV40 hepatocytes cultured in the presence of 100 μmol/L Dfo and 150 μmol/L FAC as compared with untreated cells. Expression of p53 was very low immediately after plating due to decreased p53 mRNA levels, increased after 24 hours, and reached the highest expression at 48 hours after plating (Figure 2C). Starting from 24 hours after treatment, FAC induced p53 up-regulation, whereas Dfo decreased p53, as compared with untreated cells independently of p53 mRNA levels. Cells treated for 72 hours with Dfo were not included in this analysis because significant treatment related toxicity was detected (viability < 90%).
Effect of Iron Depletion by Dfo on MDM2 and p53 Expression in Rat Liver
To confirm these findings in an in vivo model, we analyzed the effect of iron depletion on MDM2 and p53 expression in the liver of iron depleted rats (n = 4), as compared with untreated rats (n = 5). As expected, exposure to Dfo decreased serum iron (38 ± 13 μg/dl versus 83 ± 37 μg/dl, P = 0.03) and hepatic iron concentration (42 ± 25 vs. 106 ± 88 μg/100 mg dry weight tissue, P = 0.1). In line with the results obtained in SV40 hepatocytes, Dfo treatment increased MDM2 while decreasing p53 protein levels (P < 0.05; Figure 2D).
Additional genes whose altered expression induced by iron manipulation in at least one line of SV40 hepatocytes favored activation of the p53 pathway, p53-dependent DNA damage response, cell cycle control, antioxidant response, and apoptosis are shown in Supplemental Table S2 at http://ajp.amjpathol.org.32,33,34,35,36,37,38,39,40
Effect of Antioxidants on Iron-Dependent p53 Induction
To evaluate whether p53 induction reflected an antioxidant response to iron, we pretreated SV40 hepatocytes for 24 hours with NAC (10 mmol/L), able to increase cytoplasmic antioxidant capacity by raising GSH levels, and the lipid-soluble membrane antioxidant α tocopherol (60 and 120 μmol/L), or a combination of both. Treatment with the antioxidant NAC partially prevented the iron induced increase in p53 expression (Figure 3). On the other hand, α tocopherol alone did not show significant effects. However, association of the two antioxidants more effectively blunted the iron induced increase in p53 protein levels. Overall, these data suggest that the effect of iron on p53 induction is mediated by oxidative stress.
Figure 3.

Effect of antioxidants on p53 protein levels in SV40 hepatocytes. After plating, cells were treated for 24 hours with or without NAC and α-Tocopherol, and then 150 μmol/L FAC was added to the culture medium for additional 24 hours. Ct: control, untreated cells, NAC: N-acetyl-cysteine 10 mmol/L, α-Toc: α-Tocopherol 60 μmol/L (+), 120 μmol/L (++). p53 levels AU (arbitrary units): indicates the p53/β-actin ratio as detected by densitometry in two independent experiments. *P < 0.05 vs. untreated cells. **P < 0.05 vs. cells treated with FAC 150 μmol/L alone. The Western blot shown in the lower part of the figure is representative of two independent experiments.
Effect of Iron Status on MDM2/p53 and Target Genes Expression in Human Monocytes
To confirm these results in humans we evaluated the effect of manipulation of iron status on p53 expression in human monocytes. Cells were cultured for 24 hours in the presence of FAC (150 and 500 μmol/L), Dfo (100 and 120 μmol/L) and H2O2 (10 μmol/L). Iron addition increased p53 expression in a dose-dependent manner compared with control cells, whereas Dfo reduced p53 expression (Figure 4A). Treatment of cells with H2O2 to cause oxidative stress significantly increased p53 expression, as compared with untreated cells.
Figure 4.
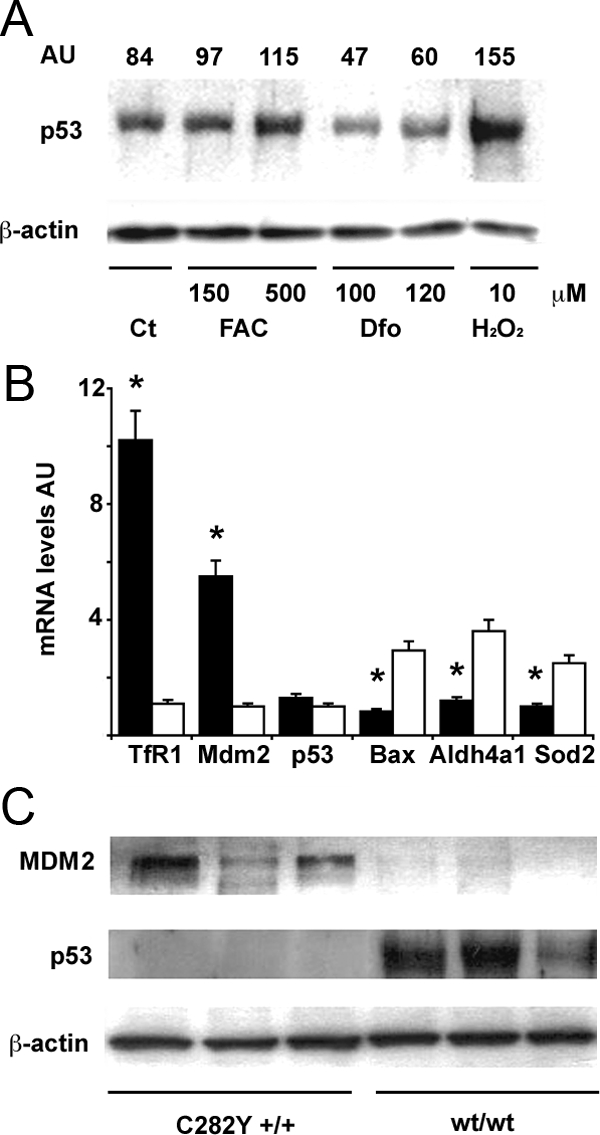
Effect of iron status on the MDM2/p53 pathway in human monocytes. A: Effect of iron status on p53 protein levels. Twenty-four hours after plating, after removal of lymphocytes, cells were treated as indicated for 24 hours. Ct: control, untreated monocytes. H2O2 is shown as positive control. β-actin is shown as a loading control. AU (arbitrary units): indicates the p53/β-actin ratio as detected by densitometry. Results are representative of two independent experiments. B: Expression of mRNAs of transferrin receptor-1 (up-regulated by iron depletion), MDM2, p53, and p53 target genes (including Bax, Aldh4a1, Sod2) in monocytes of subjects with C282Y +/+ HH (n = 6, black bars), and subjects with normal iron parameters negative for HFE mutations (n = 6, white bars). *P < 0.05 vs. control subjects. AU: mRNA levels, arbitrary units. C: MDM2 and p53 protein expression, as detected by Western blotting, in subjects with C282Y +/+ HH, and in subjects with normal iron parameters negative for HFE mutations. Three representative subjects are shown for each group. β-actin is shown as a loading control.
To verify that modulation of MDM2/p53 is actually caused by iron depletion and not simply related to some unknown effect of the exposure to Dfo, we next isolated monocytes from patients with HH due to homozygosity for the C282Y HFE mutation, which have been shown to be iron-deficient,28 and from healthy control subjects without HFE mutations and with normal iron parameters. The iron-poor phenotype of monocytes of patients with HH was confirmed by the strong up-regulation of transferrin receptor-1 (about tenfold) as compared with monocytes of control subjects (Figure 4B).
When we analyzed iron deficient human monocytes, we found increased MDM2 expression, both at mRNA and protein levels, associated with decreased p53 protein, but not mRNA levels (Figure 4, B and C). These data confirm that p53 protein levels are decreased by post-transcriptional regulation very likely related to MDM2 increased levels.
In addition, in iron-deficient monocytes we also observed down-regulation of p53 target genes involved in apoptosis (such as Bax) and oxidative stress management (such as Aldh4a1 and Sod2),15 thus suggesting a functional consequence of decreased p53 levels (Figure 4B).
Effect of Iron Status on p53 Protein Levels in Human Monocytes Is Related to Alteration of MDM2-Mediated Ubiquitination and Degradation
Given that in vitro assessment of MDM2 specific activity would not reveal changes related to altered transcription of this protein,41 to confirm that iron status regulates p53 protein levels and activity through modulation of MDM2 expression and MDM2-mediated p53 ubiquitination and proteasomal degradation,31 we first assessed whether inhibition of the MDM2/p53 interaction modified the effect of changes in iron availability on p53 protein levels. To this end, human monocytes were incubated with 150 μmol/L FAC or 100 μmol/L Dfo in the presence or absence of Nutlin-3, a MDM2 inhibitor. The presence of Nutlin-3 increased p53 protein levels in all treatment conditions, and exposure to Dfo did not decrease p53 levels in Nutlin-3 treated cells, whereas treatment with FAC in the presence of Nutlin-3 was associated with a stronger upregulation of p53 (Figure 5A).
Figure 5.

Effect of iron status on p53 expression is mediated through MDM2. A: Effect of Nutlin-3 on iron mediated regulation of p53 levels. The effect of manipulation of iron status with FAC and Dfo on p53 is compared in cells exposed or not to Nutlin-3. Human monocytes isolated from a healthy subject with normal iron parameters and negative for HFE mutations were cultured for 24 hours after removal of lymphocytes in the presence or in the absence of 25 μmol/L Nutlin-3, 100 μmol/L Dfo, and 150 μmol/L FAC. β-actin is shown as a loading control. p53 levels normalized for β-actin, as detected by densitometry, are shown in the upper part of the figure. Results are representative of two independent experiments. B: Effect of iron status on p53 polyubiquitination during inhibition of proteasomal activity. Human monocytes isolated from a healthy subject with normal iron parameters and negative for HFE mutations were cultured for 24 hours in the presence or not of 25 μmol/L Nutlin-3, 100 μmol/L Dfo, and 150 μmol/L FAC in the presence of the proteasomal inhibitor MG132. Proteins were immunoprecipitated with p53 antibody and pull-downs blotted with antibodies against ubiquitin (upper panel) and p53 (lower panel). The histogram shows the average levels of ubiquitylated/total p53 as determined by densitometric analysis of two independent experiments. *P < 0.05. C: Iron status affects p53 degradation kinetics. Human monocytes isolated from a healthy subject with normal iron parameters and negative for HFE mutations were cultured for 24 hours after removal of lymphocytes in the presence or not of 120 μmol/L Dfo, and 150 μmol/L FAC for 24 hours and then treated with CHX 40 μg/ml for 1 to 8 hours. Western blot analysis and densitometric analysis were performed for p53 levels, which were normalized for β-actin. Thus, relative expression >1 compared with baseline means that protein degradation was slower, whereas relative expression <1 means that protein degradation was faster than that of β-actin. Results represent means and SDs of two independent experiments. *P < 0.05 compared with controls.
Next, we directly evaluated whether iron manipulation modified p53 ubiquitination status by immunoprecipitation in monocytes treated with the proteasomal inhibitor MG132. Results of one experiment and quantification of two independent experiments are shown in Figure 5B. Blotting of p53 immunoprecipitates with anti-ubiquitin antibody demonstrated that incubation with FAC significantly decreased the relative level of p53 ubiquitination, while Dfo increased p53 ubiquitination compared with control cells. As expected, Nutlin-3 decreased p53 ubiquitination.
Finally, to evaluate whether manipulation of iron status and the consequent alteration in p53 ubiquitination affected p53 stability, we evaluated the effect of iron status on p53 protein degradation kinetics by measuring p53 levels after CHX mediated protein synthesis inhibition (Figure 5C). Preliminary experiments (results not shown) showed that exposure to CHX did not affect cell survival until 8 hours after treatment. As compared with control cells in which p53 remained stable after 8 hours of incubation in the presence of CHX, the degradation of p53 (relative to that of β-actin) was accelerated by Dfo treatment with a marked decrease in relative protein levels after 8 hours of CHX incubation. In contrast, in iron supplemented cells p53 degradation was significantly delayed.
These data suggest that regulation of p53 protein levels by iron status is at least partially mediated by alteration of MDM2 protein levels, p53 ubiquitination, and proteasomal degradation.
Effect of Iron Status and of Modulation of MDM2/p53 Interaction on Cell Proliferation in HepG2 Hepatoblastoma Cells
Despite the fact that iron induced the p53 pathway activity (see Figure 2 and Figure 4), iron supplementation promoted cell proliferation in SV40 hepatocytes and in HepG2 cells, a well-differentiated hepatoblastoma cell line, thus representing the possible underlying cause of the promoting effect of iron on carcinogenesis and neoplastic cell growth (Figure 6, A and B). Indeed, as shown in Figure 6A, Dfo inhibited cell growth in HepG2 cells cultured in the presence of insulin, known to induce cell proliferation (see Figure 6A, solid bars), whereas FAC was able to induce cell growth to levels similar to that those induced by insulin treatment in HepG2 cells cultured in the absence of growth factors (Figure 6A, open bars). A list of genes whose expression was significantly affected by manipulation of iron status in at least one of the two evaluated lines of SV40 hepatocytes, and which may be involved in iron dependent promotion of cell growth and hepatic carcinogenesis are shown in Supplemental Table S3 at http://ajp.amjpathol.org.42,43,44,45,46,47,48,49,50,51,52,53,54,55,56,57,58,59,60,61,62,63,64,65,66,67,68
Figure 6.
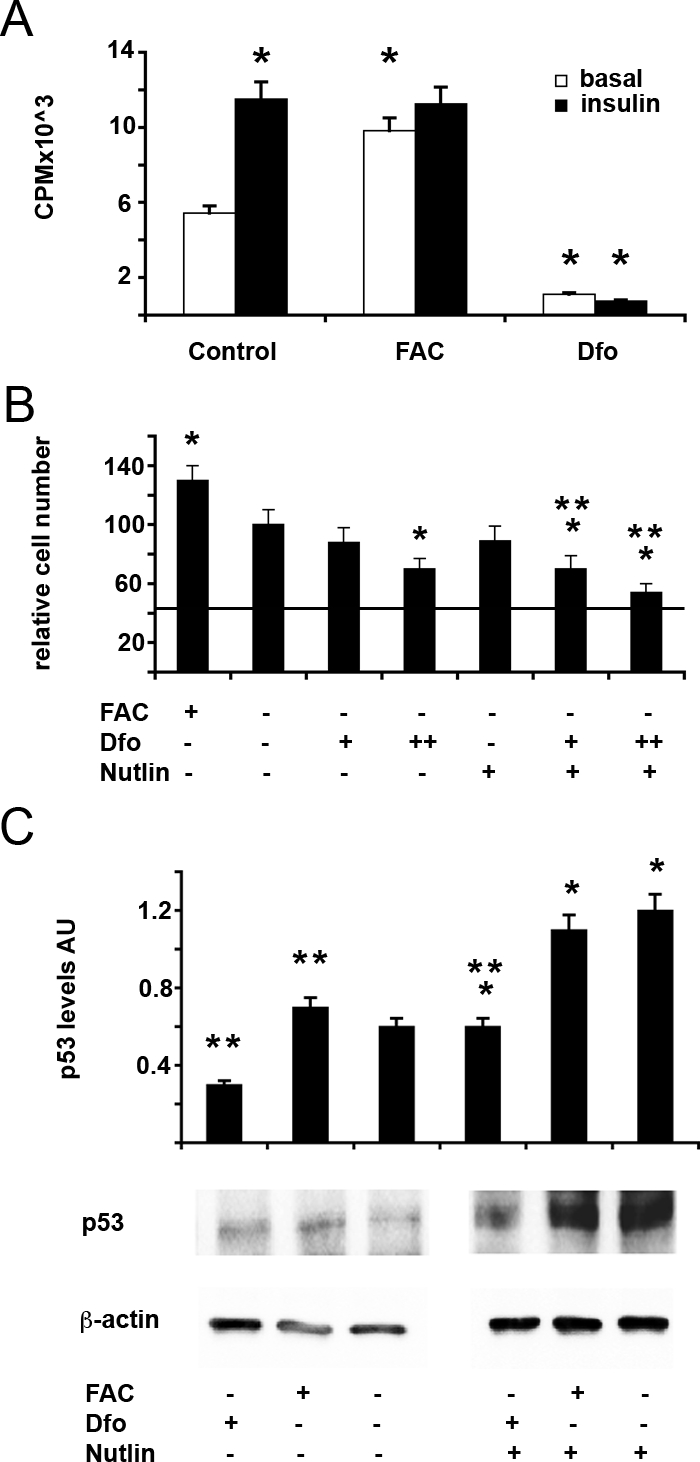
Effect of iron status and of modulation of MDM2/p53 on cell proliferation in HepG2 human hepatoblastoma cells. A: Effect of iron status on H3-Thymidine incorporation in HepG2 cells untreated (Control) and treated for 24 hours with 150 μmol/L FAC (FAC) or 100 μmol/L Dfo (Dfo) in the presence or absence of insulin 0.33 μmol/L. Results are mean ± SD of three independent experiments. cpm: counts per minute. *P < 0.05 vs. untreated cells in the absence of insulin. B: Effect of iron status and of MDM2/p53 modulation on cell number in HepG2 cells untreated or treated for 24 hours with 150 μmol/L FAC (FAC) or 80/120 μmol/L Dfo (+/++ Dfo) in the presence or absence of 25 μmol/L nutlin (Nutlin). The horizontal line indicated the number of cells plated at the beginning of the experiment. *P < 0.05 vs. untreated cells in the absence of nutlin, **P < 0.05 vs. untreated cells in the presence of nutlin. C: Effect of iron status and of MDM2/p53 modulation on p53 protein levels in HepG2 cells untreated or treated for 24 hours with 150 μmol/L FAC (FAC) or 120 μmol/L Dfo (Dfo) in the presence or absence of 25 μmol/L nutlin (Nutlin). AU: protein levels normalized for β-actin, arbitrary units. Results are representative of two independent experiments. *P < 0.05 vs. untreated cells in the absence of nutlin, **P < 0.05 vs. untreated cells in the presence of nutlin.
To evaluate whether modulation of the p53 pathway may influence proliferation and survival in hepatoblastoma cells in response to iron deprivation, we next treated HepG2 cells with Dfo in the presence or absence of Nutlin-3 (Figure 6B). Despite the fact that iron increased p53 protein levels (Figure 6C), FAC supplementation promoted cell proliferation, whereas iron chelation with Dfo inhibited cell growth but reduced p53 protein levels. Treatment with Nutlin was associated with a significant up-regulation of p53 protein levels, although p53 levels were not restored to control levels in Dfo treated cells, suggesting the existence of additional mechanisms that contribute to the down-regulation of p53 by iron depletion in HepG2 cells (Figure 6C). Nutlin by itself did not stunt cell growth, but it significantly enhanced the effect inhibitory of Dfo on cell proliferation. These data suggest that down-regulation of p53 improves cell survival/proliferation in the presence of iron depletion, and that inhibition of MDM2 may increase the antiproliferative effect of iron chelators by increasing p53 activity.
Association between the −309 T > G MDM2 Promoter Polymorphism and the Progression to HCC in Patients with Cirrhosis and Iron Overload
To evaluate whether regulation of p53/MDM2 by iron status may be clinically significant in patients with liver disease, we first tested whether the −309 T > G MDM2 promoter polymorphism associated with higher MDM2 expression and inhibition of p53,17 influenced the risk of developing HCC in 72 patients with liver cirrhosis due to HH (Table 2).
Table 2.
Clinical Features and HCC Risk in 74 Patients with Liver Cirrhosis Due to HHC According to the −309 MDM2 Genotype
| −309 MDM2
|
||
|---|---|---|
| T/T | T/G or G/G | |
| N | 33 | 41 |
| MDM2 activity | + | ++/+++ |
| p53 activity | +++ | ++/+ |
| Age, years | 53 ± 9.6 | 51.5 ± 12 |
| Sex, M | 28 (93) | 39 (93) |
| Transferrin saturation % | 79.4 ± 21.6 | 77.9 ± 11.9 |
| Ferritin, ng/ml | 2183 ± 2408 | 2641 ± 2297 |
| Iron removed, g | 10.7 ± 8.3 | 12.1 ± 10.6 |
| Follow-up, years | 12 ± 8 | 12 ± 8 |
| Hepatocarcinoma* | 5 (15) | 16 (49) |
P = 0.037; (): % values.
Despite similar demographic features, iron parameters, and length of follow-up, patients positive for the G allele displayed a significantly higher prevalence of HCC at the end of follow-up (39% vs. 15%, P = 0.037), suggesting that genetic factors determining increased MDM2 levels facilitate carcinogenesis in the presence of hepatocellular iron overload.
Next, to assess whether this may hold true also for patients with cirrhosis and iron overload not related to HH, we evaluated the association between the −309 T > G MDM2 polymorphism, iron overload, and HCC in 143 patients with HCC due to different causes. Despite similar demographic features and prevalence of viral hepatitis, the MDM2 mutated G allele was significantly associated with alcohol abuse (P = 0.02) and the presence of HFE mutations (P = 0.05), known risk factors for iron overload in patients with cirrhosis4,69 (Table 3). These data suggest an interaction between high MDM2 levels, low p53 activity, and iron overload in the pathogenesis of HCC.
Table 3.
Clinical and Genetic Features of 143 Patients with HCC Due to Mixed Causes According to the MDM2 −309 Genotype
| −309 MDM2
|
|||
|---|---|---|---|
| T/T | T/G | G/G | |
| n | 50 | 70 | 23 |
| MDM2 activity | + | ++ | +++ |
| P53 activity | +++ | ++ | + |
| Age, years | 66.1 ± 9 | 64.5 ± 8 | 65.1 ± 8 |
| Sex, M | 38 (76) | 51 (73) | 19 (83) |
| Alcohol abuse* | 16 (32) | 15 (21) | 12 (52) |
| HCV and / or HBV | 32 (64) | 52 (74) | 17 (74) |
| HFE mutations** | 9 (18) | 20 (28) | 10 (43) |
P = 0.02;
P = 0.05; (): % values.
Discussion
Increased hepatic iron concentration is considered a risk factor for HCC in patients affected by chronic liver diseases. Iron is believed to induce carcinogenesis by promoting oxidative stress,1,5 but the molecular pathways underpinning iron-driven cell-cycle progression and transformation are still under definition.13 To investigate the mechanisms whereby, we evaluated the effect of iron manipulation on gene expression profiles in immortalized mouse hepatocytes.
Our results confirmed previous findings indicating that up-regulation of p21waf1 mRNA levels may be involved in cell cycle arrest induced by iron depletion,13 and strongly pointed to a modulation of the p53 pathway by changes in iron levels. Indeed, among the genes most significantly regulated by iron we identified both MDM2, involved in regulation of p53 activity and stability by ubiquitination,31 and its co-activator Cyclin G1.70 Iron supplementation decreased MDM2 and Cyclin G1 mRNA levels, as compared with untreated cells, whereas iron chelation had the opposite effect. These findings were replicated at the protein level, and variations of MDM2 induced by iron were associated with opposite changes in p53, ie, iron supplementation increased, whereas chelation decreased p53 levels. Moreover, the effect of iron availability on p53 protein levels appeared to be dose dependent and consistent at all time points during cell differentiation.
Importantly, since p53 itself induces MDM2 as a feedback control mechanism,71 our data showing opposite regulation of these two genes indicate that the strong effect of iron status on the regulation of MDM2 mRNA levels is not mediated by p53. The inhibition of iron-dependent up-regulation of p53 obtained with antioxidants suggest that modulation of the redox status plays a role, but the precise characterization of the molecular mechanism involved needs further investigations.
The oncosuppressor p53 is involved in the regulation of cell cycle and apoptosis, but also plays a key role in the induction of a number of genes, including DNA repair and antioxidant enzymes.15 Since exposure to iron did not stunt cellular growth, but on the contrary in immortalized hepatocytes and hepatoblastoma cells promoted cell proliferation, which was associated with up-regulation of oncogenes potentially involved in hepatocarcinoma pathogenesis, the induction of p53 may be particularly relevant for the prevention of neoplastic transformation in cells exposed to excess iron. Therefore, our results suggest that down-regulation of MDM2 may allow activation of p53 and induction of antioxidant, DNA repair, cell cycle control and eventually apoptotic responses to iron.15
This view is apparently in contradiction with previously reported data on the effect of intracellular iron chelators being tested as antineoplastic agents in cell lines.13 Whereas toxic doses of iron chelators increased p53 levels in neoplastic cells, in our experiments exposure to Dfo did not affect cell viability; therefore, the p53 induction by iron chelation reported in previous experiments may represent an epiphenomenon correlated to irreversible cellular damage and induction of apoptosis. To address this issue, we checked the effect of iron depletion on the MDM2/p53 pathway in vivo. In line with our findings in immortalized hepatocytes, exposure to Dfo concentrations causing moderate iron deficiency increased MDM2 expression and consequently decreased p53 protein levels in rat livers. Furthermore, the effect of iron manipulation on p53 levels was replicated in monocytes isolated from humans with normal iron parameters, which were chosen to evaluate the physiological regulation of p53 by iron stores in non-neoplastic cells because of their easy availability. To evaluate whether the effect of iron depletion on p53 could be replicated in a model not depending on a chemical iron chelator, we exploited a naturally occurring model of cellular iron deficiency due to an inherited mutation.27,28 Monocytes of individuals homozygous for the C282Y HFE mutation that are relatively iron poor due to inability to retain iron28 had higher MDM2 mRNA and protein and lower p53 protein, but not mRNA levels, than their normal counterpart. These data suggest that in this ex vivo model iron deficiency decreases p53 protein levels by a post-transcriptional mechanism associated with increased MDM2 expression. Furthermore, decreased p53 levels were associated with down-modulation of target genes involved in regulation of redox status, cell cycle, and apoptosis.
Mechanistic data were also provided indicating a causal relationship linking MDM2 regulation by iron to modulation of p53 activity. First, iron dependent modulation of p53 was abrogated in the presence of Nutlin-3, a small molecule that inhibits MDM2-mediated degradation of p53 and has antineoplastic activity.19,20,72,73 Second, iron supplementation decreased whereas iron depletion increased p53 ubiquitination status, and, third, manipulation of cellular iron availability was associated with significant changes in the degradation kinetics of p53, consistently with the observed changes in expression of MDM2.31 All in all, these data suggest that iron induces p53 activity by decreasing MDM2 expression, which in turn leads to reduced p53 ubiquitination, proteasomal targeting and degradation, whereas iron deprivation has the opposite effect.
However, since we did not measure specific MDM2 activity, we cannot discern whether modulation of p53 ubiquitination by manipulation of iron status is a consequence of transcriptional regulation of MDM2 expression, or iron manipulation has also an influence on MDM2 enzymatic activity. However, we would like to point out that iron is not a cofactor required for MDM2 enzymatic activity, and post-translational modification of MDM2 determined by manipulation of intracellular iron status would be difficult to reproduce in vitro to measure the effect of iron status on MDM2 activity.32
Rather than challenging evidence supporting the antineoplastic activity of iron chelators,13 we believe our results suggest the use of combination therapy with MDM2 inhibitors, such as Nutlin-3, to maximize effects and overcome resistances, at least for cancers maintaining some expression of functional p53. Interestingly, combined treatment with Dfo and Nutlin-3 appeared to increase p53 protein levels compared with baseline levels in our experimental conditions, and Nutlin-3 enhanced the inhibitory effect of Dfo on cell growth in HepG2 hepatoblastoma cells. Furthermore, MDM2 has been demonstrated to promote carcinogenesis also independently of p53, by regulating retinoblastoma, hypoxia inducible factor-1α, and E2F1.72,74,75 Additional work is required to test the synergistic effect of iron chelation and MDM2/proteasome inhibitors and to identify possible clinical applications.
Finally, to test the clinical relevance of MDM2 down-regulation by iron, we analyzed the effect of the MDM2 −309 promoter polymorphism17 on the risk of developing HCC in patients with cirrhosis due to HH, which represents the leading cause of death in these patients.76,77 In line with our hypothesis, we observed that the G allele, previously linked to increased MDM2 expression and lower p53 activity,78,79 was associated with increased cancer risk, indicating that a preserved ability to down-regulate MDM2 expression may protect from iron-induced carcinogenesis through p53 upregulation. Moreover, the MDM2 −309G allele was significantly associated with the presence of HFE mutations in a case-only cohort of Italian patients with HCC, suggesting an interaction between iron overload and the failure to adequately down-regulate MDM2 expression in the pathogenesis of the disease in a subset of patients.1 These results await confirmation in future prospective studies including larger series of patients with cirrhosis.
Thus, down-regulation of MDM2 induced by iron seems to play a protective role on HCC development, and the likely mechanism involves up-regulation of p53 and of antioxidant, cell cycle regulation, and pro-apoptotic genes. Interestingly, p53 has recently been shown to contribute to growth arrest by reducing iron uptake and intracellular iron through the interaction with IRPs,80 thus potentially providing a feed-back mechanism to control cellular iron availability.
All together, our data obtained in vitro, ex vivo and in vivo, show that iron status modulates p53 activity by MDM2 mediated ubiquitination. Moreover, an interaction favoring iron-related oxidative damage may occur between the HFE—mutated in hemochromatosis—and MDM2 genes in the pathogenesis of HCC in humans. MDM2 is involved in the protection from iron induced oxidative stress and carcinogenesis.
Acknowledgments
We thank Michela Mattioli, Alessandra Alberghini, Martino Ravani, Fabio Ambrosetti, and Valeria De Barba for technical support and Cristina Bertelli, Alessandra Maraschi, and Erika Fatta for help in collecting clinical data.
Footnotes
Address reprint requests to Prof. Silvia Fargion, Center for the Study of Metabolic and Liver Diseases, Department of Internal Medicine, UO Medicina Interna 1B, University of Milano, Ospedale Policlinico Mangiagalli e Regina Elena Fondazione IRCCS, Via F Sforza 35, 20122 Milano, Italy. E-mail: silvia.fargion@unimi.it.
Supported by PUR 2007, 2008, 2009 Università di Milano (L.V. and S.F.), Ricerca corrente Ospedale Maggiore Policlinico IRCCS Milano 2006–8, Progetto a Concorso Ospedale Maggiore Policlinico IRCCS Milano 2009–10 (L.V. and S.F.), Bando Giovani Ricercatori 2007 Ministero della Salute (L.V.).
There is no conflict of interest to disclose.
Supplemental material for this article can be found on http://ajp.amjpathol.org.
References
- Fracanzani AL, Fargion S, Stazi MA, Valenti L, Amoroso P, Cariani E, Sangiovanni A, Tommasini M, Rossini A, Bertelli C, Fatta E, Patriarca V, Brescianini S, Stroffolini T. Association between heterozygosity for HFE gene mutations and hepatitis viruses in hepatocellular carcinoma. Blood Cells Mol Dis. 2005;35:27–32. doi: 10.1016/j.bcmd.2005.03.007. [DOI] [PubMed] [Google Scholar]
- Farazi PA, DePinho RA. Hepatocellular carcinoma pathogenesis: from genes to environment. Nat Rev Cancer. 2006;6:674–687. doi: 10.1038/nrc1934. [DOI] [PubMed] [Google Scholar]
- Fracanzani AL, Taioli E, Sampietro M, Fatta E, Bertelli C, Fiorelli G, Fargion S. Liver cancer risk is increased in patients with porphyria cutanea tarda in comparison to matched control patients with chronic liver disease. J Hepatol. 2001;35:498–503. doi: 10.1016/s0168-8278(01)00160-x. [DOI] [PubMed] [Google Scholar]
- Nahon P, Sutton A, Rufat P, Ziol M, Thabut G, Schischmanoff PO, Vidaud D, Charnaux N, Couvert P, Ganne-Carrie N, Trinchet JC, Gattegno L, Beaugrand M. Liver iron, HFE gene mutations, and hepatocellular carcinoma occurrence in patients with cirrhosis. Gastroenterology. 2008;134:102–110. doi: 10.1053/j.gastro.2007.10.038. [DOI] [PubMed] [Google Scholar]
- Fracanzani AL, Conte D, Fraquelli M, Taioli E, Mattioli M, Losco A, Fargion S. Increased cancer risk in a cohort of 230 patients with hereditary hemochromatosis in comparison to matched control patients with non-iron-related chronic liver disease. Hepatology. 2001;33:647–651. doi: 10.1053/jhep.2001.22506. [DOI] [PubMed] [Google Scholar]
- Zacharski LR, Chow BK, Howes PS, Shamayeva G, Baron JA, Dalman RL, Malenka DJ, Ozaki CK, Lavori PW. Decreased cancer risk after iron reduction in patients with peripheral arterial disease: results from a randomized trial. J Natl Cancer Inst. 2008;100:996–1002. doi: 10.1093/jnci/djn209. [DOI] [PubMed] [Google Scholar]
- Turlin B, Juguet F, Moirand R, Le Quilleuc D, Loreal O, Campion JP, Launois B, Ramee MP, Brissot P, Deugnier Y. Increased liver iron stores in patients with hepatocellular carcinoma developed on a noncirrhotic liver. Hepatology. 1995;22:446–450. [PubMed] [Google Scholar]
- Wu KJ, Polack A, Dalla-Favera R. Coordinated regulation of iron-controlling genes. H-ferritin and IRP2, by c-MYC, Science. 1999;283:676–679. doi: 10.1126/science.283.5402.676. [DOI] [PubMed] [Google Scholar]
- Alberghini A, Recalcati S, Tacchini L, Santambrogio P, Campanella A, Cairo G. Loss of the von Hippel Lindau tumor suppressor disrupts iron homeostasis in renal carcinoma cells. J Biol Chem. 2005;280:30120–30128. doi: 10.1074/jbc.M500971200. [DOI] [PubMed] [Google Scholar]
- Boult J, Roberts K, Brookes MJ, Hughes S, Bury JP, Cross SS, Anderson GJ, Spychal R, Iqbal T, Tselepis C. Overexpression of cellular iron import proteins is associated with malignant progression of esophageal adenocarcinoma. Clin Cancer Res. 2008;14:379–387. doi: 10.1158/1078-0432.CCR-07-1054. [DOI] [PubMed] [Google Scholar]
- Brookes MJ, Hughes S, Turner FE, Reynolds G, Sharma N, Ismail T, Berx G, McKie AT, Hotchin N, Anderson GJ, Iqbal T, Tselepis C. Modulation of iron transport proteins in human colorectal carcinogenesis. Gut. 2006;55:1449–1460. doi: 10.1136/gut.2006.094060. [DOI] [PMC free article] [PubMed] [Google Scholar]
- Whitnall M, Howard J, Ponka P, Richardson DR. A class of iron chelators with a wide spectrum of potent antitumor activity that overcomes resistance to chemotherapeutics. Proc Natl Acad Sci USA. 2006;103:14901–14906. doi: 10.1073/pnas.0604979103. [DOI] [PMC free article] [PubMed] [Google Scholar]
- Yu Y, Kovacevic Z, Richardson DR. Tuning cell cycle regulation with an iron key. Cell Cycle. 2007;6:1982–1994. doi: 10.4161/cc.6.16.4603. [DOI] [PubMed] [Google Scholar]
- Brooks CL, Gu W. Ubiquitination, phosphorylation and acetylation: the molecular basis for p53 regulation. Curr Opin Cell Biol. 2003;15:164–171. doi: 10.1016/s0955-0674(03)00003-6. [DOI] [PubMed] [Google Scholar]
- Sablina AA, Budanov AV, Ilyinskaya GV, Agapova LS, Kravchenko JE, Chumakov PM. The antioxidant function of the p53 tumor suppressor. Nat Med. 2005;11:1306–1313. doi: 10.1038/nm1320. [DOI] [PMC free article] [PubMed] [Google Scholar]
- Farazi PA, Glickman J, Horner J, Depinho RA. Cooperative interactions of p53 mutation, telomere dysfunction, and chronic liver damage in hepatocellular carcinoma progression. Cancer Res. 2006;66:4766–4773. doi: 10.1158/0008-5472.CAN-05-4608. [DOI] [PubMed] [Google Scholar]
- Bond GL, Hu W, Bond EE, Robins H, Lutzker SG, Arva NC, Bargonetti J, Bartel F, Taubert H, Wuerl P, Onel K, Yip L, Hwang SJ, Strong LC, Lozano G, Levine AJ. A single nucleotide polymorphism in the MDM2 promoter attenuates the p53 tumor suppressor pathway and accelerates tumor formation in humans. Cell. 2004;119:591–602. doi: 10.1016/j.cell.2004.11.022. [DOI] [PubMed] [Google Scholar]
- Nakae J, Park BC, Accili D. Insulin stimulates phosphorylation of the forkhead transcription factor FKHR on serine 253 through a Wortmannin-sensitive pathway. J Biol Chem. 1999;274:15982–15985. doi: 10.1074/jbc.274.23.15982. [DOI] [PubMed] [Google Scholar]
- Vassilev LT. MDM2 inhibitors for cancer therapy. Trends Mol Med. 2007;13:23–31. doi: 10.1016/j.molmed.2006.11.002. [DOI] [PubMed] [Google Scholar]
- Vassilev LT, Vu BT, Graves B, Carvajal D, Podlaski F, Filipovic Z, Kong N, Kammlott U, Lukacs C, Klein C, Fotouhi N, Liu EA. In vivo activation of the p53 pathway by small-molecule antagonists of MDM2. Science. 2004;303:844–848. doi: 10.1126/science.1092472. [DOI] [PubMed] [Google Scholar]
- Zhu Q, Wani G, Yao J, Patnaik S, Wang QE, El-Mahdy MA, Praetorius-Ibba M, Wani AA. The ubiquitin-proteasome system regulates p53-mediated transcription at p21waf1 promoter. Oncogene. 2007;26:4199–4208. doi: 10.1038/sj.onc.1210191. [DOI] [PubMed] [Google Scholar]
- Califano A. SPLASH: structural pattern localization analysis by sequential histograms. Bioinformatics. 2000;16:341–357. doi: 10.1093/bioinformatics/16.4.341. [DOI] [PubMed] [Google Scholar]
- Mattioli M, Agnelli L, Fabris S, Baldini L, Morabito F, Bicciato S, Verdelli D, Intini D, Nobili L, Cro L, Pruneri G, Callea V, Stelitano C, Maiolo AT, Lombardi L, Neri A. Gene expression profiling of plasma cell dyscrasias reveals molecular patterns associated with distinct IGH translocations in multiple myeloma. Oncogene. 2005;24:2461–2473. doi: 10.1038/sj.onc.1208447. [DOI] [PubMed] [Google Scholar]
- Cairo G, Tacchini L, Pogliaghi G, Anzon E, Tomasi A, Bernelli-Zazzera A. Induction of ferritin synthesis by oxidative stress. Transcriptional and post-transcriptional regulation by expansion of the “free” iron pool. J Biol Chem. 1995;270:700–703. doi: 10.1074/jbc.270.2.700. [DOI] [PubMed] [Google Scholar]
- Altomonte J, Richter A, Harbaran S, Suriawinata J, Nakae J, Thung SN, Meseck M, Accili D, Dong H. Inhibition of Foxo1 function is associated with improved fasting glycemia in diabetic mice. Am J Physiol Endocrinol Metab. 2003;285:E718–E728. doi: 10.1152/ajpendo.00156.2003. [DOI] [PubMed] [Google Scholar]
- Fargion S, Valenti L, Dongiovanni P, Scaccabarozzi A, Fracanzani AL, Taioli E, Mattioli M, Sampietro M, Fiorelli G. Tumor necrosis factor alpha promoter polymorphisms influence the phenotypic expression of hereditary hemochromatosis. Blood. 2001;97:3707–3712. doi: 10.1182/blood.v97.12.3707. [DOI] [PubMed] [Google Scholar]
- Recalcati S, Alberghini A, Campanella A, Gianelli U, De Camilli E, Conte D, Cairo G. Iron regulatory proteins 1 and 2 in human monocytes, macrophages and duodenum: expression and regulation in hereditary hemochromatosis and iron deficiency. Haematologica. 2006;91:303–310. [PubMed] [Google Scholar]
- Cairo G, Recalcati S, Montosi G, Castrusini E, Conte D, Pietrangelo A. Inappropriately high iron regulatory protein activity in monocytes of patients with genetic hemochromatosis. Blood. 1997;89:2546–2553. [PubMed] [Google Scholar]
- Dongiovanni P, Valenti L, Ludovica Fracanzani A, Gatti S, Cairo G, Fargion S. Iron depletion by deferoxamine up-regulates glucose uptake and insulin signaling in hepatoma cells and in rat liver. Am J Pathol. 2008;172:738–747. doi: 10.2353/ajpath.2008.070097. [DOI] [PMC free article] [PubMed] [Google Scholar]
- Valenti L, Dongiovanni P, Fracanzani AL, Santorelli G, Fatta E, Bertelli C, Taioli E, Fiorelli G, Fargion S. Increased susceptibility to nonalcoholic fatty liver disease in heterozygotes for the mutation responsible for hereditary hemochromatosis. Dig Liver Dis. 2003;35:172–178. doi: 10.1016/s1590-8658(03)00025-2. [DOI] [PubMed] [Google Scholar]
- Brooks CL, Gu W. Dynamics in the p53-Mdm2 ubiquitination pathway. Cell Cycle. 2004;3:895–89932. [PubMed] [Google Scholar]
- Monte M, Benetti R, Collavin L, Marchionni L, Del Sal G, Schneider C. hGTSE-1 expression stimulates cytoplasmic localization of p53. J Biol Chem. 2004;279:11744–11752. doi: 10.1074/jbc.M311123200. [DOI] [PubMed] [Google Scholar]
- Mallakin A, Sugiyama T, Taneja P, Matise LA, Frazier DP, Choudhary M, Hawkins GA, D'Agostino RB, Jr, Willingham MC, Inoue K. Mutually exclusive inactivation of DMP1 and ARF/p53 in lung cancer. Cancer Cell. 2007;12:381–394. doi: 10.1016/j.ccr.2007.08.034. [DOI] [PMC free article] [PubMed] [Google Scholar]
- Pabla N, Huang S, Mi QS, Daniel R, Dong Z. ATR-Chk2 signaling in p53 activation and DNA damage response during cisplatin-induced apoptosis. J Biol Chem. 2008;283:6572–6583. doi: 10.1074/jbc.M707568200. [DOI] [PubMed] [Google Scholar]
- Ochocka AM, Kampanis P, Nicol S, Allende-Vega N, Cox M, Marcar L, Milne D, Fuller-Pace F, Meek D. FKBP25, a novel regulator of the p53 pathway, induces the degradation of MDM2 and activation of p53. FEBS Lett. 2009;583:621–626. doi: 10.1016/j.febslet.2009.01.009. [DOI] [PubMed] [Google Scholar]
- Liu H, Lu ZG, Miki Y, Yoshida K. Protein kinase C delta induces transcription of the TP53 tumor suppressor gene by controlling death-promoting factor Btf in the apoptotic response to DNA damage. Mol Cell Biol. 2007;27:8480–8491. doi: 10.1128/MCB.01126-07. [DOI] [PMC free article] [PubMed] [Google Scholar]
- Brooks CL, Gu W. How does SIRT1 affect metabolism, senescence and cancer? Nat Rev Cancer. 2009;9:123–128. doi: 10.1038/nrc2562. [DOI] [PMC free article] [PubMed] [Google Scholar]
- Fukuda N, Saitoh M, Kobayashi N, Miyazono K. Execution of BMP-4-induced apoptosis by p53-dependent ER dysfunction in myeloma and B-cell hybridoma cells. Oncogene. 2006;25:3509–3517. doi: 10.1038/sj.onc.1209393. [DOI] [PubMed] [Google Scholar]
- Lecona E, Barrasa JI, Olmo N, Llorente B, Turnay J, Lizarbe MA. Upregulation of annexin A1 expression by butyrate in human colon adenocarcinoma cells: role of p53, NF-Y, and p38 mitogen-activated protein kinase. Mol Cell Biol. 2008;28:4665–4674. doi: 10.1128/MCB.00650-07. [DOI] [PMC free article] [PubMed] [Google Scholar]
- Prahl M, Vilborg A, Palmberg C, Jornvall H, Asker C, Wiman KG. The p53 target protein Wig-1 binds hnRNP A2/B1 and RNA Helicase A via RNA, FEBS Lett. 2008;582:2173–2177. doi: 10.1016/j.febslet.2008.04.065. [DOI] [PubMed] [Google Scholar]
- Linares LK, Hengstermann A, Ciechanover A, Muller S, Scheffner M. HdmX stimulates Hdm2-mediated ubiquitination and degradation of p53. Proc Natl Acad Sci USA. 2003;100:12009–12014. doi: 10.1073/pnas.2030930100. [DOI] [PMC free article] [PubMed] [Google Scholar]
- Toyama T, Sasaki Y, Horimoto M, Iyoda K, Yakushijin T, Ohkawa K, Takehara T, Kasahara A, Araki T, Hori M, Hayashi N. Ninjurin1 increases p21 expression and induces cellular senescence in human hepatoma cells. J Hepatol. 2004;41:637–643. doi: 10.1016/j.jhep.2004.06.027. [DOI] [PubMed] [Google Scholar]
- Chu F, Borthakur A, Sun X, Barkinge J, Gudi R, Hawkins S, Prasad KV. The Siva-1 putative amphipathic helical region (SAH) is sufficient to bind to BCL-XL and sensitize cells to UV radiation induced apoptosis. Apoptosis. 2004;9:83–95. doi: 10.1023/B:APPT.0000012125.01799.4c. [DOI] [PubMed] [Google Scholar]
- Baessler T, Krusch M, Schmiedel BJ, Kloss M, Baltz KM, Wacker A, Schmetzer HM, Salih HR. Glucocorticoid-induced tumor necrosis factor receptor-related protein ligand subverts immunosurveillance of acute myeloid leukemia in humans. Cancer Res. 2009;69:1037–1045. doi: 10.1158/0008-5472.CAN-08-2650. [DOI] [PubMed] [Google Scholar]
- Szydlowska M, Roszkowska A. Expression patterns of AMP-deaminase isozymes in human hepatocellular carcinoma (HCC). Mol Cell Biochem. 2008;318:1–5. doi: 10.1007/s11010-008-9773-x. [DOI] [PubMed] [Google Scholar]
- Kawakubo H, Carey JL, Brachtel E, Gupta V, Green JE, Walden PD, Maheswaran S. Expression of the NF-kappaB-responsive gene BTG2 is aberrantly regulated in breast cancer. Oncogene. 2004;23:8310–8319. doi: 10.1038/sj.onc.1208008. [DOI] [PubMed] [Google Scholar]
- Sakaue H, Ogawa W, Nakamura T, Mori T, Nakamura K, Kasuga M. Role of MAPK phosphatase-1 (MKP-1) in adipocyte differentiation. J Biol Chem. 2004;279:39951–39957. doi: 10.1074/jbc.M407353200. [DOI] [PubMed] [Google Scholar]
- Sotgia F, Del Galdo F, Casimiro MC, Bonuccelli G, Mercier I, Whitaker-Menezes D, Daumer KM, Zhou J, Wang C, Katiyar S, Xu H, Bosco E, Quong AA, Aronow B, Witkiewicz AK, Minetti C, Frank PG, Jimenez SA, Knudsen ES, Pestell RG, Lisanti MP. Caveolin-1−/− null mammary stromal fibroblasts share characteristics with human breast cancer-associated fibroblasts. Am J Pathol. 2009;174:746–761. doi: 10.2353/ajpath.2009.080658. [DOI] [PMC free article] [PubMed] [Google Scholar]
- Samanta AK, Chakraborty SN, Wang Y, Kantarjian H, Sun X, Hood J, Perrotti D, Arlinghaus RB. Jak2 inhibition deactivates Lyn kinase through the SET-PP2A-SHP1 pathway, causing apoptosis in drug-resistant cells from chronic myelogenous leukemia patients. Oncogene. 2009;28:1669–1681. doi: 10.1038/onc.2009.7. [DOI] [PMC free article] [PubMed] [Google Scholar]
- Young AR, Chan EY, Hu XW, Kochl R, Crawshaw SG, High S, Hailey DW, Lippincott-Schwartz J, Tooze SA. Starvation and ULK1-dependent cycling of mammalian Atg9 between the TGN and endosomes. J Cell Sci. 2006;119:3888–3900. doi: 10.1242/jcs.03172. [DOI] [PubMed] [Google Scholar]
- Hirata D, Yamabuki T, Miki D, Ito T, Tsuchiya E, Fujita M, Hosokawa M, Chayama K, Nakamura Y, Daigo Y. Involvement of epithelial cell transforming sequence-2 oncoantigen in lung and esophageal cancer progression. Clin Cancer Res. 2009;15:256–266. doi: 10.1158/1078-0432.CCR-08-1672. [DOI] [PubMed] [Google Scholar]
- Tian C, Zhou ZG, Meng WJ, Sun XF, Yu YY, Li L, Luo HZ, Yang L, Zhou B, Gu J. Overexpression of connective tissue growth factor WISP-1 in Chinese primary rectal cancer patients. World J Gastroenterol. 2007;13:3878–3882. doi: 10.3748/wjg.v13.i28.3878. [DOI] [PMC free article] [PubMed] [Google Scholar]
- Li ZG, Yang J, Vazquez ES, Rose D, Vakar-Lopez F, Mathew P, Lopez A, Logothetis CJ, Lin SH, Navone NM. Low-density lipoprotein receptor-related protein 5 (LRP5) mediates the prostate cancer-induced formation of new bone. Oncogene. 2008;27:596–603. doi: 10.1038/sj.onc.1210694. [DOI] [PubMed] [Google Scholar]
- Katoh H, Shibata T, Kokubu A, Ojima H, Kosuge T, Kanai Y, Hirohashi S. Genetic inactivation of the APC gene contributes to the malignant progression of sporadic hepatocellular carcinoma: a case report. Genes Chromosomes Cancer. 2006;45:1050–1057. doi: 10.1002/gcc.20362. [DOI] [PubMed] [Google Scholar]
- Otto H, Conz C, Maier P, Wolfle T, Suzuki CK, Jeno P, Rucknagel P, Stahl J, Rospert S. The chaperones MPP11 and Hsp70L1 form the mammalian ribosome-associated complex. Proc Natl Acad Sci USA. 2005;102:10064–10069. doi: 10.1073/pnas.0504400102. [DOI] [PMC free article] [PubMed] [Google Scholar]
- Shibata S, Matsuoka Y, Yoneda Y. Nucleocytoplasmic transport of proteins and poly(A)+ RNA in reconstituted Tpr-less nuclei in living mammalian cells. Genes Cells. 2002;7:421–434. doi: 10.1046/j.1365-2443.2002.00525.x. [DOI] [PubMed] [Google Scholar]
- Aigner E, Theurl I, Theurl M, Lederer D, Haufe H, Dietze O, Strasser M, Datz C, Weiss G. Pathways underlying iron accumulation in human nonalcoholic fatty liver disease. Am J Clin Nutr. 2008;87:1374–1383. doi: 10.1093/ajcn/87.5.1374. [DOI] [PubMed] [Google Scholar]
- Park JM, Kohn MJ, Bruinsma MW, Vech C, Intine RV, Fuhrmann S, Grinberg A, Mukherjee I, Love PE, Ko MS, DePamphilis ML, Maraia RJ. The multifunctional RNA-binding protein La is required for mouse development and for the establishment of embryonic stem cells. Mol Cell Biol. 2006;26:1445–1451. doi: 10.1128/MCB.26.4.1445-1451.2006. [DOI] [PMC free article] [PubMed] [Google Scholar]
- Sasaki M, Ikeda H, Itatsu K, Yamaguchi J, Sawada S, Minato H, Ohta T, Nakanuma Y. The overexpression of polycomb group proteins Bmi1 and EZH2 is associated with the progression and aggressive biological behavior of hepatocellular carcinoma. Lab Invest. 2008;88:873–882. doi: 10.1038/labinvest.2008.52. [DOI] [PubMed] [Google Scholar]
- Liu J, Cao L, Chen J, Song S, Lee IH, Quijano C, Liu H, Keyvanfar K, Chen H, Cao LY, Ahn BH, Kumar NG, Rovira II, Xu XL, van Lohuizen M, Motoyama N, Deng CX, Finkel T. Bmi1 regulates mitochondrial function and the DNA damage response pathway. Nature. 2009;459:387–392. doi: 10.1038/nature08040. [DOI] [PMC free article] [PubMed] [Google Scholar]
- Carro MS, Spiga FM, Quarto M, Di Ninni V, Volorio S, Alcalay M, Muller H. DEK Expression is controlled by E2F and deregulated in diverse tumor types. Cell Cycle. 2006;5:1202–1207. doi: 10.4161/cc.5.11.2801. [DOI] [PubMed] [Google Scholar]
- Wu PC, Lau VK, Fang JW, Lai VC, Lai CL, Lau JY. Imbalance between cell proliferation and cellular DNA fragmentation in hepatocellular carcinoma. Liver. 1999;19:444–451. doi: 10.1111/j.1478-3231.1999.tb00076.x. [DOI] [PubMed] [Google Scholar]
- Hirano K, Shishido-Hara Y, Kitazawa A, Kojima K, Sumiishi A, Umino M, Kikuchi F, Sakamoto A, Fujioka Y, Kamma H. Expression of stem cell factor (SCF), a KIT ligand, in gastrointestinal stromal tumors (GISTs): a potential marker for tumor proliferation. Pathol Res Pract. 2008;204:799–807. doi: 10.1016/j.prp.2008.05.002. [DOI] [PubMed] [Google Scholar]
- Sharma A, Ray R, Rajeswari MR. Overexpression of high mobility group (HMG) B1 and B2 proteins directly correlates with the progression of squamous cell carcinoma in skin. Cancer Invest. 2008;26:843–851. doi: 10.1080/07357900801954210. [DOI] [PubMed] [Google Scholar]
- Lambros MB, Fiegler H, Jones A, Gorman P, Roylance RR, Carter NP, Tomlinson IP. Analysis of ovarian cancer cell lines using array-based comparative genomic hybridization. J Pathol. 2005;205:29–40. doi: 10.1002/path.1681. [DOI] [PubMed] [Google Scholar]
- Lin CJ, Cencic R, Mills JR, Robert F, Pelletier J. c-Myc and eIF4F are components of a feedforward loop that links transcription and translation. Cancer Res. 2008;68:5326–5334. doi: 10.1158/0008-5472.CAN-07-5876. [DOI] [PubMed] [Google Scholar]
- Kao YR, Shih JY, Wen WC, Ko YP, Chen BM, Chan YL, Chu YW, Yang PC, Wu CW, Roffler SR. Tumor-associated antigen L6 and the invasion of human lung cancer cells. Clin Cancer Res. 2003;9:2807–2816. [PubMed] [Google Scholar]
- Hu C, Chen L, Jiang Y, Li Y, Wang S. The effect of fatty acid-CoA ligase 4 on the growth of hepatic cancer cells. Cancer Biol Ther. 2008;7:131–134. doi: 10.4161/cbt.7.1.5198. [DOI] [PubMed] [Google Scholar]
- Valenti L, Pulixi EA, Arosio P, Cremonesi L, Biasiotto G, Dongiovanni P, Maggioni M, Fargion S, Fracanzani AL. Relative contribution of iron genes, dysmetabolism and hepatitis C virus (HCV) in the pathogenesis of altered iron regulation in HCV chronic hepatitis. Haematologica. 2007;92:1037–1042. doi: 10.3324/haematol.11281. [DOI] [PubMed] [Google Scholar]
- Chen X. Cyclin G: a regulator of the p53-Mdm2 network. Dev Cell. 2002;2:518–519. doi: 10.1016/s1534-5807(02)00182-x. [DOI] [PubMed] [Google Scholar]
- Michael D, Oren M. The p53 and Mdm2 families in cancer. Curr Opin Genet Dev. 2002;12:53–59. doi: 10.1016/s0959-437x(01)00264-7. [DOI] [PubMed] [Google Scholar]
- Ambrosini G, Sambol EB, Carvajal D, Vassilev LT, Singer S, Schwartz GK. Mouse double minute antagonist Nutlin-3a enhances chemotherapy-induced apoptosis in cancer cells with mutant p53 by activating E2F1. Oncogene. 2007;26:3473–3481. doi: 10.1038/sj.onc.1210136. [DOI] [PubMed] [Google Scholar]
- Secchiero P, Barbarotto E, Tiribelli M, Zerbinati C, di Iasio MG, Gonelli A, Cavazzini F, Campioni D, Fanin R, Cuneo A, Zauli G. Functional integrity of the p53-mediated apoptotic pathway induced by the nongenotoxic agent nutlin-3 in B-cell chronic lymphocytic leukemia (B-CLL). Blood. 2006;107:4122–4129. doi: 10.1182/blood-2005-11-4465. [DOI] [PubMed] [Google Scholar]
- Bardos JI, Chau NM, Ashcroft M. Growth factor-mediated induction of HDM2 positively regulates hypoxia-inducible factor 1alpha expression. Mol Cell Biol. 2004;24:2905–2914. doi: 10.1128/MCB.24.7.2905-2914.2004. [DOI] [PMC free article] [PubMed] [Google Scholar]
- Chang DL, Qiu W, Ying H, Zhang Y, Chen CY, Xiao ZX. ARF promotes accumulation of retinoblastoma protein through inhibition of MDM2. Oncogene. 2007;26:4627–4634. doi: 10.1038/sj.onc.1210254. [DOI] [PubMed] [Google Scholar]
- Fargion S, Fracanzani AL, Piperno A, Braga M, D'Alba R, Ronchi G, Fiorelli G. Prognostic factors for hepatocellular carcinoma in genetic hemochromatosis. Hepatology. 1994;20:1426–1431. doi: 10.1002/hep.1840200608. [DOI] [PubMed] [Google Scholar]
- Fargion S, Mandelli C, Piperno A, Cesana B, Fracanzani AL, Fraquelli M, Bianchi PA, Fiorelli G, Conte D. Survival and prognostic factors in 212 Italian patients with genetic hemochromatosis. Hepatology. 1992;15:655–659. doi: 10.1002/hep.1840150417. [DOI] [PubMed] [Google Scholar]
- Bond GL, Hirshfield KM, Kirchhoff T, Alexe G, Bond EE, Robins H, Bartel F, Taubert H, Wuerl P, Hait W, Toppmeyer D, Offit K, Levine AJ. MDM2 SNP309 accelerates tumor formation in a gender-specific and hormone-dependent manner. Cancer Res. 2006;66:5104–5110. doi: 10.1158/0008-5472.CAN-06-0180. [DOI] [PubMed] [Google Scholar]
- Arva NC, Gopen TR, Talbott KE, Campbell LE, Chicas A, White DE, Bond GL, Levine AJ, Bargonetti J. A chromatin-associated and transcriptionally inactive p53-Mdm2 complex occurs in mdm2 SNP309 homozygous cells. J Biol Chem. 2005;280:26776–26787. doi: 10.1074/jbc.M505203200. [DOI] [PubMed] [Google Scholar]
- Zhang F, Wang W, Tsuji Y, Torti SV, Torti FM. Post-transcriptional modulation of iron homeostasis during p53-dependent growth arrest. J Biol Chem. 2008;283:33911–33918. doi: 10.1074/jbc.M806432200. [DOI] [PMC free article] [PubMed] [Google Scholar]