

Abstract
Amyloid deposition is present in 20–50% of nondemented older adults yet the functional consequences remain unclear. The current study found that amyloid accumulation is correlated with functional disruption of the default network as measured by intrinsic activity correlations. Clinically normal participants (n = 38, aged 60–88 years) were characterized using 11C-labeled Pittsburgh Compound B positron emission tomography imaging to estimate fibrillar amyloid burden and, separately, underwent functional magnetic resonance imaging (fMRI). The integrity of the default network was estimated by correlating rest-state fMRI time courses extracted from a priori regions including the posterior cingulate, lateral parietal, and medial prefrontal cortices. Clinically normal participants with high amyloid burden displayed significantly reduced functional correlations within the default network relative to participants with low amyloid burden. These reductions were also observed when amyloid burden was treated as a continuous, rather than a dichotomous, measure and when controlling for age and structural atrophy. Whole-brain analyses initiated by seeding the posterior cingulate cortex, a region of high amyloid burden in Alzheimer's disease, revealed significant disruption in the default network including functional disconnection of the hippocampal formation.
Introduction
Amyloid-β plaques and phosphorylated tau tangles are the hallmark neuropathology markers of Alzheimer's disease (AD). Recently developed molecular imaging techniques allow measurement of fibrillar amyloid deposition in vivo (Klunk et al., 2004; Klunk and Mathis, 2008). Amyloid burden detected by positron emission tomography (PET) imaging with 11C-labeled Pittsburgh Compound B (PiB) differs in extent and pattern in patients with clinically diagnosed AD relative to normal controls and to other dementias (Johnson et al., 2007; Rabinovici et al., 2007; Gomperts et al., 2008), and corresponds to dementia severity (Grimmer et al., 2008) (but see Engler et al., 2006) and to regional amyloid-β levels confirmed at postmortem (Bacskai et al., 2007; Ikonomovic et al., 2008).
Consistent with neuropathological observations, amyloid imaging confirms that a large proportion (20–50%) of clinically normal older adults exhibit substantial amyloid burden (Buckner et al., 2005; Mintun et al., 2006; Johnson et al., 2007; Pike et al., 2007; Rowe et al., 2007; Aizenstein et al., 2008; Fripp et al., 2008; Jack et al., 2009; Reiman et al., 2009). Because, by definition, clinically normal participants do not exhibit dementia symptoms, the functional consequences of elevated amyloid burden in this population are unclear (Johnson, 2006).
Although several studies of nondemented older adults have failed to detect relations between amyloid burden and memory function or clinical symptoms (Jack et al., 2008 2009; Mormino et al., 2009), others have observed relations between amyloid burden and memory performance or brain volume in nondemented individuals (Pike et al., 2007; Fotenos et al., 2008; Villemagne et al., 2008; Dickerson et al., 2009; Mormino et al., 2009). Here, we explored whether amyloid burden in clinically normal older adults is associated with functional disruption detected using sensitive measures of cortical network integrity.
The network targeted for exploration was the default network, an interacting set of brain regions that contribute to autobiographical memory and high-level cognition involving planning and internal mentation (Gusnard and Raichle, 2001; Raichle et al., 2001; Buckner et al., 2008). Anatomically, the default network is comprised of heteromodal association areas that interact with each other and with the medial temporal lobe memory system (Greicius et al., 2003, 2004; Vincent et al., 2006; Buckner et al., 2008, 2009). Amyloid deposition measured by PiB-PET preferentially accumulates in cortical regions linked to the default network (Klunk et al., 2004; Buckner et al., 2005) and these cortical regions show metabolism reduction, functional disruption, and atrophy in early stages of clinically diagnosed AD and mild cognitive impairment (MCI) (Reiman et al., 1996; Minoshima et al., 1997; Herholz et al., 2002; Scahill et al., 2002; Lustig et al., 2003; Thompson et al., 2003; Greicius et al., 2004; Rombouts et al., 2005; Celone et al., 2006; Sorg et al., 2007; Pihlajamäki et al., 2008). Here we used functional connectivity magnetic resonance imaging (fcMRI) (Biswal et al., 1995) to measure the integrity of the default network in clinically normal older adults with significant amyloid deposition.
Materials and Methods
Participants.
Participants were 38 (58% female) community-dwelling clinically normal older adults, aged 60–88 years (mean age = 73.1 years). Participants were excluded if they showed any signs of dementia including MCI. Specifically, participants were excluded if they received a Clinical Dementia Rating (CDR) of very mild (CDR 0.5) or higher, scored <27 on the Mini-Mental State Examination (MMSE), had been previously diagnosed with a neurological or psychiatric condition, had a history of head trauma, were taking >2 blood pressure medications, or presented with any condition that would pose a safety risk for MRI. All participants had normal or corrected to normal vision and were right-handed. Participants provided informed consent in accordance with protocols approved by the Partners Healthcare Inc. Institutional Review Board. Portions of the clinical information and amyloid imaging data used to classify the participants' level of amyloid burden have been used previously (Buckner et al., 2009). Participants in the present study were enrolled separately from that of Sperling et al. (2009) but because of recruitment from the same general pool, a small number of subjects were found to have volunteered for both studies (n = 7). None of the fMRI data and functional connectivity analyses has been previously reported.
Demographic and neuropsychological measures.
Participants were characterized on a number of commonly used demographic and neuropsychological instruments. Socioeconomic status (SES) was measured with the Hollingshead SES scale, which separately ranks an individual's educational and occupational attainment on scales of 1–7. A weighted score is then computed by multiplying the educational score by 4 and the occupational score by 7 and summing the two scores (Hollingshead, 1957). Lower scores indicate higher SES. Participants were asked to report the number of prescription medications they are currently taking and any chronic health conditions for which they have a current diagnosis. They were administered the American version of the National Adult Reading Test (AMNART) (Grober and Sliwinski, 1991; Ryan and Paolo, 1992), which was used to estimate full-scale IQ. Participants completed the Rey Auditory-Verbal Learning Test (RAVLT) (Schmidt, 1996) using a 30 min delayed interval (score indicates number of items recalled), two measures of speed of processing (for both, score indicates the number of items completed in 45 s)—pattern matching and number matching (Salthouse, 1996), verbal fluency using the letters F, A, and S (FAS; score indicates the average number of items generated) (Spreen and Benton, 1977), the Letter-Number Sequencing subtest of working memory from the WAIS-III (score indicates the maximum number of items correctly held and reordered in memory) (Wechsler, 2002), and the Geriatric Depression Scale (GDS) (Yesavage et al., 1983).
Amyloid imaging acquisition.
Amyloid burden was measured with N-methyl-[11C]-2-(4-methylaminophenyl)-6-hydroxybenzothiazole (Pittsburgh Compound B; PiB), which binds to fibrillar amyloid (Klunk et al., 2004). Images were acquired on a Siemens/CTI ECAT PET HR+ scanner. A catheter placed in the antecubital vein was used for radiotracer delivery, and a transmission scan was obtained to correct for attenuation. 11C-PiB (8–15 mCi) was injected as a bolus, followed by a 60 min dynamic PET scan in three-dimensional (3-D) mode (63 image planes, 15.2 cm axial field of view, 5.6 mm transaxial resolution and 2.4 mm slice interval; 69 frames: 12 × 15 s, 57 × 60 s).
Amyloid imaging analysis.
The dynamic PET images were reconstructed with scatter correction using commercially available routines for 3-D PET data and a ramp filter (resolution of ∼5.5–6 mm full-width half-maximum; after 3-D Gaussian filter, final resolution of ∼8.5 mm). Using the high-resolution anatomical MRI images described below, the PET images were aligned to the MRI volume using cross-modal registration maximizing of intensity gradients, taking into account relative gradient orientation. Motion correction was performed using cross-modal alignment to accommodate changes in tissue activity distributed over the scan. Normalization of the PET images was performed in SPM2 using the initial activity images summed across 0–10 min following injection. The distribution volume ratio (DVR) was used based on the Logan graphical analysis technique (Logan et al., 1990) that has been fully validated for PiB imaging (Price et al., 2005). Time-activity curves were measured in each brain region under analysis [region of interest (ROI) or voxel] and in a reference region in cerebellar cortex known to contain low levels of fibrillar amyloid. This approach has been applied to numerous PiB studies (Fagan et al., 2006; Lopresti et al., 2005; Price et al., 2005; Johnson et al., 2007) and yields data that are similar to arterial blood input methods (Lopresti et al., 2005).
Each individual's mean image was examined and an index of PiB presence in cortical regions was calculated using the dynamic data via Logan graphical modeling within a large aggregate cortical ROI consisting of frontal, lateral parietal and lateral temporal, and retrosplenial cortices (the FLR region). PiB uptake in the FLR region is substantial in patients with diagnosed AD (Raji et al., 2008) and has been used as a summary measure of PiB uptake in previous studies (Johnson et al., 2007; Gomperts et al., 2008). In the current sample of 38 clinically normal older adults, PiB DVR values in the FLR were nearly perfectly correlated with global PiB uptake (r = 0.99) and with ROIs located in the precuneus (r = 0.94), posterior cingulate (r = 0.94), and frontal cortices (r = 0.97), supporting the use of FLR as an aggregate measure. FLR DVR was not significantly correlated with age in the current sample (r = 0.15, p = 0.36).
On the basis of observed PiB DVR values in the FLR region, participants were classified into two groups: 21 PiB positive (PiB+) individuals, who displayed extensive increased PiB uptake (defined as greater than FLR DVR ≥1.15), and 17 PiB negative (PiB−) individuals, who displayed insubstantial PiB uptake (FLR DVR <1.15). This PiB cutoff value was selected a priori to be comparable to prior reports (Johnson et al., 2007; Gomperts et al., 2008) and to ensure that individuals classified as PiB− were well outside the range of PiB values observed in AD patients (Fig. 1). In addition to group analyses, PiB uptake (defined as FLR DVR) was treated as a continuous variable for critical analyses to ensure that the selection of a cutoff value did not dictate the results. As the results reveal, the critical significant effects were present both when the a priori cutoff was used and when PiB uptake was treated as a continuous variable.
Figure 1.

Amyloid deposition in clinically normal, MCI, and AD individuals. The DVR for PiB binding in an aggregate region (the FLR region) is plotted for each individual. The present sample of clinically normal older adults (CN) was compared with preexisting samples of MCI participants and AD patients. Means are indicated by black bars. Differences among all group comparisons were significant at p < 0.005.
Functional MRI data acquisition.
Participants underwent functional MRI on a Siemens TrioTIM 3.0 Tesla scanner equipped with a 12-channel phased-array whole-head coil. Visual stimuli were generated using an Apple PowerBook G4 running Psychtoolbox (Brainard, 1997; Pelli, 1997) within Matlab (MathWorks) and projected onto a screen positioned at the head of the magnet bore and reflected onto a mirror affixed to the head coil. Head motion was restrained with a foam pillow and extendable padded head clamps. Earplugs were used to attenuate scanner noise. High-resolution 3D T1-weighted magnetization prepared rapid acquisition gradient echo (MP-RAGE) anatomical images were collected with the following parameters: repetition time (TR) = 2300 ms, echo time (TE) = 2.98 ms, flip angle (FA) = 9°, 1 × 1 × 1.2 mm voxels. Functional data were acquired using a gradient-echo echo-planar pulse sequence sensitive to blood oxygenation level-dependent (BOLD) contrast (Kwong et al., 1992; Ogawa et al., 1992) using the following parameters: TR = 2500 ms, TE = 30 ms, FA = 88°, 3.03 × 3.03 × 3 mm voxels. Thirty-nine transverse slices aligned to the AC-PC plane covered the whole brain. Functional images were acquired during two runs of 124 time points to minimize participant fatigue. In prior optimization studies (Van Dijk et al., 2008), we did not find a difference in power between a continuous single long run (12 min duration) and multiple, separate shorter runs (two 6 min runs). During each run, participants were presented a constant visual stimulus (a centrally presented cross-hair) and were instructed to keep their eyes open and fixate on the cross-hair.
Functional MRI data analysis.
fMRI data analysis computed correlations between regions within the default network as a measure of network integrity. Preprocessing of the functional images was conducted using a set of steps common to most functional imaging studies. The first four volumes of each run were discarded to allow for T1-equilibration effects and the two acquired runs were concatenated. Concatenation across runs or short epochs has been shown to result in similar correlation estimates to continuously acquired data (Fair et al., 2007; Van Dijk et al., 2008). Slice acquisition dependent time shifts were corrected per volume (SPM2, Wellcome Department of Cognitive Neurology, London, UK). Then, rigid body translation and rotation were used to correct for head motion (Jenkinson et al., 2002) [Functional Magnetic Resonance Imaging of the Brain (FMRIB), Oxford, UK] and atlas registration was achieved by computing affine transforms connecting the first volume of the functional run (Jenkinson and Smith, 2001) (FMRIB, Oxford, UK), with a T2 EPI template in the Montreal Neurological Institute (MNI) atlas space (Evans et al., 1993). Motion correction and atlas transformation parameters were applied in a single step in which all data were resampled to 2 mm isotropic voxels. Data were spatially smoothed using a 6 mm full-width half-maximum (FWHM) Gaussian kernel.
Next, a series of preprocessing steps were performed specific to analysis of functional correlations between regions (Fox et al., 2005; Vincent et al., 2006). Temporal filtering removed constant offsets and linear trends over each run while retaining frequencies <0.08 Hz and the mean signal intensity over the run was removed. Several sources of physiological, spurious or regionally nonspecific variance were removed by regression of nuisance variables including (1) six parameters obtained by rigid body head motion correction, (2) the signal averaged over the whole-brain, (3) the signal averaged over the lateral ventricles, and (4) the signal averaged over a region centered in the deep cerebral white matter. Temporally shifted versions of these waveforms were also removed by including the first temporal derivatives (computed by backward differences) in the linear model. Regression of each of these signals was performed simultaneously and the residual volumes were retained. Regression of the whole-brain signal controls, in part, for physiological influences such as cardiac and respiratory noise that are assumed to operate similarly across all regions in the brain (Macey et al., 2004; Wise et al., 2004; Van Dijk et al., 2008). However, it remains possible that physiological influences have some effect on correlations between residual regional BOLD responses (Birn et al., 2006), although there is no current evidence that such physiological differences are associated with presence or absence of amyloid in the brain. In addition, we explored the data further to determine whether anatomic differences existed between PiB− and PiB+ participants in regions used to correct for cardiac and respiratory physiological variation. The lateral ventricle and the cerebral white matter regions were visually inspected in each participant to ensure central placement in the target regions. An average of 8% of gray matter voxels were identified as being included in the ventricle regions, and within the putative white matter regions an average of 4% of voxels were identified as gray matter. No difference in the proportion of gray matter voxels included in the ventricle or white matter regions was observed between PiB− and PiB+ groups, F(2,35) = 0.09, p = 0.91. Entering individual estimates of gray matter included in these regions as nuisance covariates did not substantially alter the results of any analyses.
Hypothesis-driven analyses.
To quantify network disruption, correlation strengths between a priori regions were computed by extracting the mean time course from all voxels included within each ROI. These ROIs were defined from an independent data set consisting of 48 participants [58% female, mean (M) age = 22.3, SD = 3.0]. A correlation map was first computed using an initiating seed region with a 4 mm radius in the posterior cingulate cortex (PCC) (MNI coordinate: 0, −53, 26) based on a previous study (Andrews-Hanna et al., 2007) and motivated by extensive analyses of the topography of the default network (Buckner et al., 2008). The PCC plays a central role in the default network (Buckner et al., 2008; Fransson and Marrelec, 2008; Greicius et al., 2009). The resulting correlation map was used to identify peak voxels of well established nodes of the default network in this independent dataset: medial prefrontal cortex (MPFC) (0, 52, −6) and lateral parietal cortex (LPC) (−48, −62, 36; 46, −62, 32). ROIs with a 4 mm radius were defined around each peak.
In the current dataset, the mean time course was extracted from all voxels within each of these a priori ROIs, and all pairs of correlations between ROI time courses were calculated. In the case of bilateral regions (e.g., LPC), the mean time course was extracted from all voxels combined across the left- and right-lateralized ROIs. Pearson's correlation coefficient was computed between the time courses from each pair of ROIs and normalized using the Fisher's r-to-z transformation (Zar, 1996). The average z-transformed correlation across all ROI pairs was computed for use as a single metric of the functional integrity of the default network. In addition, individual z-transformed correlations between pairs of ROIs are reported. Note that our a priori hypotheses did not include regions within the hippocampal formation. Although extensive analyses have revealed regions within the medial temporal lobe that are linked to the default network, they have been more difficult to detect (e.g., see discussion in Greicius et al., 2003; 2004) and show increased variance (Andrews-Hanna et al., 2007). For these reasons, our a priori hypotheses targeted those cortical regions within the default network that overlap the distribution of amyloid deposition measured with PiB (e.g., Klunk et al., 2004; Buckner et al., 2005) and have shown the most stable measurement properties. As revealed by the results of the exploratory analyses, including regions within the hippocampal formation does not qualitatively change the results and exploratory whole-brain maps reveal effects of amyloid deposition across the entirety of the default network including the hippocampal formation.
To examine the specificity of the observed effects, we identified control regions in the left and right motor (−36, −25, 57; 36, −25, 57) and visual cortices (−19, −98, −3; 19, −98, −3). These regions were chosen on the basis of strong functional correlation across hemispheres, as observed in previous studies (Andrews-Hanna et al., 2007; Witt et al., 2008).
To examine the potential influence of partial volume effects and structural atrophy on group differences in functional correlation strengths, we used the voxel-based morphometric segmentation algorithm implemented in SPM2 (Ashburner and Friston, 2000) to segment gray matter, white matter, and cerebral-spinal (CSF) fluid. We then extracted the relative proportion of gray, white, and CSF within each ROI used in the functional correlation analyses, averaged across all voxels within the ROI. The proportion of gray matter was used as a covariate in specified analyses. Additional analyses entering proportion of white matter, CSF, or combined gray and white matter as covariates found results that were qualitatively and quantitatively similar to those reported for gray matter only.
Exploratory analyses.
The above analyses quantified functional correlations among a set of a priori cortical regions within the default network allowing for an unbiased, hypothesis-driven test of whether amyloid deposition disrupts functional integrity. In addition to our hypothesis-driven analyses, we conducted a further set of exploratory analyses that investigated the effect of amyloid deposition across all regions of the brain. Maps of functional correlations were obtained by computing the correlation between the mean signal time course from voxels within the PCC and the time courses of all voxels across the brain using Pearson's product moment correlation (similar to methods described by Fox et al., 2005; Vincent et al., 2006). The PCC seed region was taken from a previous study (Andrews-Hanna et al., 2007; MNI coordinate: 0, −53, 26). Correlation maps were converted to z-maps using Fisher's r-to-z transformation (Zar, 1996). Maps from each participant were entered into a second-level random effects group analysis, using SPM2, to identify voxels that demonstrate significant differences in PCC correlation between the PiB+ and PiB− participants. Group-level maps were thresholded at a family-wise error corrected value of p < 0.05, achieved by applying a voxel-level statistical threshold of p < 0.005 in conjunction with a cluster extent (k) threshold of k > 136 based on the actual smoothing level of the group-level data, as implemented by John Ashburner (SPM-compatible code available at http://www.sph.umich.edu/∼nichols/JG2/CorrClusTh.m).
In addition to the above a priori ROIs used to measure the default network, regions within the hippocampal formation (HF: −24, −22, −20; 24, −20, −22) were also defined from the independent dataset as those correlated with the PCC seed region. These ROIs within the hippocampus were applied to the current dataset to extract time courses for correlation with the a priori ROI time courses to supplement the hypothesis-driven analyses described above.
Results
A high proportion of clinically normal older adults harbor amyloid burden comparable in extent and pattern to that observed in MCI and AD
Amyloid burden within the 38 clinically normal older adults was compared with that in separate samples of 46 individuals (aged 60–91) with MCI (defined as a CDR of 0.5 and subjective memory complaints not severe enough to be classified as dementia that are corroborated by a study partner, and essentially normal judgment, reasoning, and activities of daily living) and with 35 individuals (aged 59–86) with mild to moderate AD (Fig. 1). Amyloid levels were measured by PiB deposition in the FLR ROI, chosen because it captures the pattern of deposition commonly observed in AD patients (Gomperts et al., 2008; Johnson et al., 2007). Although the mean FLR amyloid level in the clinically normal participants was significantly lower than that observed in both the MCI (t(82) = 2.69, p < 0.01) and AD (t(71) = 12.48, p < 0.001) groups, a substantial portion (18%) of the clinically normal participants exhibited amyloid levels that were within the range of the AD group (PiB DVR >1.25). When the a priori definition of high amyloid burden (PiB DVR ≥1.15, see Materials and Methods) was applied, 55% of the clinically normal older adults were classified as having high amyloid burden, compared with 67% of the MCI group and 100% of the AD group. Notably, the mean PiB DVR value of the high amyloid (PiB+) group was at the lower bound of the PiB DVR values exhibited by the AD group. The variance of PiB binding in the MCI group was especially high (s2 = 0.09) compared with the other two groups (NC: s2 = 0.02; AD: s2 = 0.04), suggesting that the cognitive symptoms observed in the MCI group may result from multiple etiologies.
Clinically normal older adults with and without amyloid burden show comparable neuropsychological test scores
On a range of neuropsychological and demographic variables (Table 1) the overarching finding was no significant differences between low amyloid (PiB−) and high amyloid (PiB+) individuals. The only significant result was on the verbal fluency measure (FAS), for which the PiB+ group outperformed the PiB− group (t(36) = 2.24, p < 0.05), but this result did not survive a correction for multiple comparisons (false discovery rate, pFDR < 0.027). Generally, the PiB+ and PiB− groups performed qualitatively similar on these standard tests of neuropsychological performance, consistent with previous reports (Jack et al., 2008; Mormino et al., 2009).
Table 1.
Demographic and neuropsychological characteristics of clinically normal participants
| Dependent measure | PiB−(n = 17) |
PiB+(n = 21) |
Total(n = 38) |
|||
|---|---|---|---|---|---|---|
| M | SD | M | SD | M | SD | |
| Age (years) | 72.8 | 8.1 | 73.4 | 7.9 | 73.1 | 7.8 |
| MMSE | 29.4 | 0.9 | 29.4 | 0.5 | 29.4 | 0.7 |
| Hollingshead SES | 21.8 | 9.4 | 27.6 | 8.9 | 25.0 | 9.5 |
| Number of medications | 2.8 | 2.7 | 2.1 | 1.8 | 2.4 | 2.2 |
| Number of health conditions | 0.4 | 0.6 | 0.6 | 0.7 | 0.5 | 0.7 |
| RAVLT (30 min. recall) | 10.8 | 3.7 | 10.1 | 3.4 | 10.4 | 3.5 |
| Pattern matching | 12.7 | 2.4 | 12.7 | 3.0 | 12.7 | 2.7 |
| Number matching | 24.4 | 3.3 | 25.6 | 3.3 | 25.1 | 3.3 |
| FAS* | 15.1 | 3.8 | 17.7 | 3.3 | 16.5 | 3.7 |
| AMNART estimated IQ | 120.6 | 8.0 | 121.2 | 7.3 | 121.0 | 7.6 |
| Letter-number sequencing | 4.6 | 0.6 | 5.0 | 0.9 | 4.8 | 0.8 |
| GDS | 4.3 | 3.4 | 4.5 | 5.0 | 4.4 | 4.3 |
*p < 0.05.
The default network is disrupted in clinically normal older adults harboring amyloid burden
Using the a priori division of individuals into PiB− and PiB+ groups (threshold of PiB DVR = 1.15), we examined the relationship of amyloid burden to functional integrity of the default network (see Materials and Methods; supplemental Fig. A, available at www.jneurosci.org as supplemental material). The mean correlation across all pairs of a priori ROIs was taken as the measure of default network integrity (Fig. 2a). Functional correlation within the default network was significantly reduced in the PiB+ group (M = 0.40, SD = 0.16) compared with the PiB− group (M = 0.63, SD = 0.20), t(36) = 3.93, p < 0.001, and remained significant when correcting for gray matter volume in all ROIs, t(36) = 3.47, p < 0.005. Notably, this relationship was not dependent on the cut-point used to define the PiB− and PiB+ groups, as treating PiB level as a continuous measure resulted in a significant correlation, r = −0.40, p < 0.02, with the default network correlations reducing as PiB deposition increased (Fig. 2b). This relationship remained significant when age and gray matter volume were partialled from the analysis, rp = −0.35, p < 0.05. Furthermore, these results were not contingent on averaging all regional correlations, as each pair of regional correlations displayed a significant difference between the PiB− and PiB+ groups (Fig. 3). These individual ROI results were also not due to partial volume or atrophy effects, as an omnibus F test found that the PiB− and PiB+ groups did not differ in the mean proportion of gray matter in any ROI, F(4,33) = 1.02, p = 0.41 (follow-up univariate tests revealed no individually significant ROIs), and the group difference in correlations between all ROI pairs remained significant when gray matter volume in the paired ROIs was covaried from the analysis (minimum corrected t(34) = 2.74, p < 0.01). Finally, the relationship remained significant when partialling age and gray matter volume and applying the nonparametric Spearman's ρ statistic (rs = −0.49, p < 0.005) that does not make assumptions about the normality of the PiB distribution.
Figure 2.
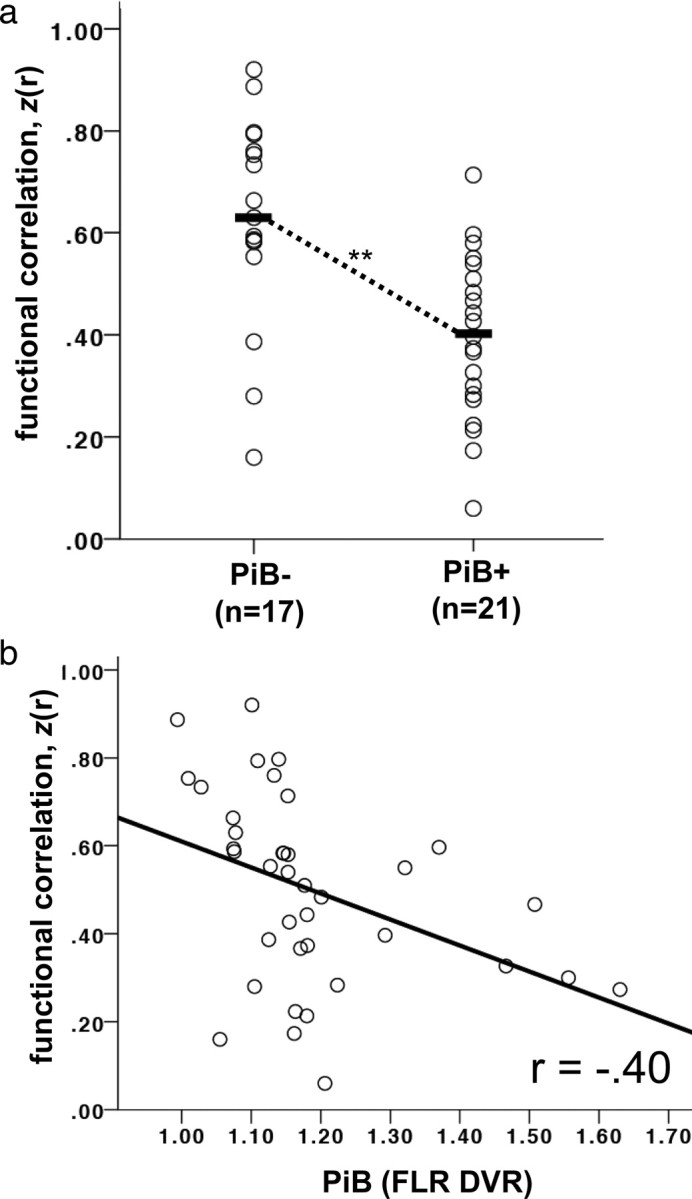
The default network is functionally disrupted in clinically normal older adults harboring amyloid burden. a, Default network correlations for clinically normal older adults with (PiB+) and without (PiB−) substantial amyloid burden. Each value represents the mean of the z-transformed correlation values between a priori regions of interest in the posterior cingulate, lateral parietal, and medial prefrontal cortices. Black bars indicate the group mean. **p < 0.001. b, Default network correlations plotted against amyloid retention in clinically normal older adults. Amyloid deposition (DVR in an aggregate region of interest—the FLR region) was treated as a continuous measure. A significant negative relationship was observed between amyloid burden and default network correlations (p < 0.02).
Figure 3.

Functional correlations between individual regions are reduced within the default network. Regions of interest in the PCC, LPC, and MPFC were defined a priori and examined for differences in z-transformed correlation values between clinically normal individuals with (PiB+) and without (PiB−) substantial amyloid burden. Comparisons involving the lateral parietal regions were averaged across the left and right regions. *p < 0.01.
To test the network specificity of the detrimental influence of amyloid burden, we examined the correlation between left and right motor regions and also between left and right visual regions (see Materials and Methods; supplemental Fig. A, available at www.jneurosci.org as supplemental material). Correlations between the motor cortices (PiB−: M = 0.54, SD = 0.27; PiB+: M = 0.51, SD = 0.35, ns) and between the visual cortices (PiB−: M = 0.59, SD = 0.31; PiB+: M = 0.56, SD = 0.33, ns) were high and equivalent in both groups, indicating that the effect of amyloid burden does not generalize to all cortical regions.
Exploratory and whole-brain analyses reveal significant disruption of the default network including the hippocampal formation in clinically normal older adults harboring amyloid burden
We relied on an a priori definition of the default network and explicitly did not include the hippocampal formation (HF) because of concerns of low signal-to-noise in this region. However, because the HF is a component of the memory network that is linked to the default network (Greicius et al., 2004; Vincent et al., 2006; Kahn et al., 2008; Buckner et al., 2008) and is relevant to the possibility that amyloid burden may have early effects on memory systems even in clinically normal older adults, we examined the relationship of HF regions (supplemental Fig. A, available at www.jneurosci.org as supplemental material) with the a priori regions defining the default network.
A significant difference in the correlation between the HF and PCC was found between the PiB− (M = 0.32, SD = 0.17) and PiB+ (M = 0.09, SD = 0.22) groups, t(36) = 3.60, p < 0.001. However, no significant difference was observed for correlations between the HF and lateral parietal cortex (PiB−: M = 0.21, SD = 0.24; PiB+: M = 0.09, SD = 0.23, ns) or between the HF and medial prefrontal cortex (PiB−: M = 0.25, SD = 0.24; PiB+: M = 0.23, SD = 0.19, ns), which appeared to be at least partly due to the high variability of correlations involving the HF ROI (see also Andrews-Hanna et al., 2007). These results did not change when covarying age and gray matter volume. If the HF ROI was included as a region in the computation of the mean correlation across the default network, results were similar to those reported above for the hypotheses-driven analyses, with a significant difference between the PiB− (M = 0.44, SD = 0.16) and PiB+ (M = 0.26, SD = 0.12) groups, t(36) = 3.93, p < 0.001, which remained significant when covarying age and gray matter volume, t(36) = 3.46, p < 0.005. There was a significant correlation between PiB retention (treated as a continuous variable) and functional integrity within the default network, r = −0.36, p < 0.05, although this correlation was similar in magnitude but now showed a trend for significance when partialling for age and gray matter volume, rp = −0.33, p = 0.06. Thus, had the HF been included in the a priori analysis, the results would remain qualitatively unchanged.
We further expanded our exploratory analyses to examine whole-brain correlation patterns. The purpose of this exploratory analysis was two-fold. First, it allowed an independent exploration of the effect of PiB deposition and, if our a priori hypotheses appropriately targeted relevant regions, the whole-brain exploration should converge with the hypothesis-driven analysis. Second, exploratory whole-brain analysis allowed identification of effects for future study. For this analysis, the PCC was used as a seed region, and the correlation with this seed region was computed for every voxel in each participant's brain. Second-level random effects analyses were conducted within the PiB− and PiB+ groups, and the group differences between PiB− and PiB+ individuals were examined (Fig. 4).
Figure 4.
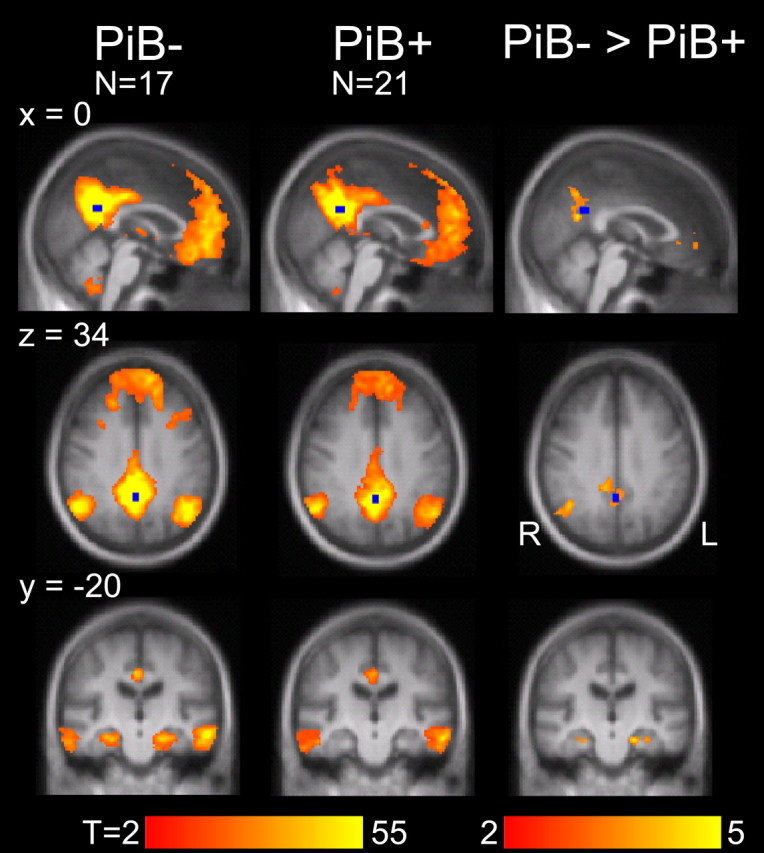
Exploratory whole-brain analyses confirm disruption of the default network including the hippocampal formation. Maps display regions that are significantly (cluster-corrected threshold of p < 0.05) correlated with a seed placed in the posterior cingulate cortex (shown in blue) for clinically normal participants with (PiB+) and without (PiB−) substantial amyloid burden. The third column displays regions with significantly greater functional correlations in the PiB− than in the PiB+ group. Regions displaying group differences included lateral parietal and medial prefrontal cortices, as well as bilateral regions within the hippocampal formation (family-wise error correction of p < 0.05 corresponding to p < 0.005 in conjunction with a cluster constraint k > 136).
The direct statistical comparison between the PiB− and PiB+ groups is displayed in the right-most column of Figure 4 and shows significant differences for the medial prefrontal cortex (x = −8, y = 46, z = −2, peak t statistic = 3.64, cluster extent k = 229), the right lateral parietal cortex (42, −60, 32, t = 4.55, k = 485), and bilateral regions of the HF (left: −20, −22, −22, t = 5.05, k = 149; right: 38, −12, −30, t = 4.07, k = 165). A region within the PCC (0, −60, 20, t = 4.13, k = 638) was also observed, but we do not assign interpretive importance to this result because of its proximity to the seed region. It is especially noteworthy that only regions associated within the default network and HF were above threshold in this exploratory comparison between PiB− and PiB+ groups, reinforcing that the default network is functionally disrupted as a network including interactions across its multiple regions including those within the hippocampal formation.
Discussion
Clinically normal older adults harboring amyloid burden show disruption of functional connectivity that cannot be accounted for by increased age or structural atrophy. Decreases in spontaneous functional correlations among regions within the default network were observed using a priori defined regions in both group analyses and in analyses treating amyloid burden as a continuous measure. Whole-brain analyses further demonstrated decreased functional correlations with the hippocampal formation. Taken collectively, these results suggest the broad network comprising components of the default network linked to the hippocampal formation is disrupted in the preclinical phase of AD.
These results build on previous observations that the functional integrity of the default network is reduced in AD (Greicius et al., 2004) and MCI (Sorg et al., 2007) and further demonstrate that the presence of amyloid is sufficient to predict functional disruption before clinical symptoms emerge. Recent observations in clinically normal individuals (CDR 0) associate amyloid burden with whole-brain atrophy (Fotenos et al., 2008), atrophy of the hippocampal formation (Mormino et al., 2009), cortical thinning in default network regions (Dickerson et al., 2009), and aberrant task-induced activity decreases within the posterior cingulate/precuneus (Sperling et al., 2009). The present results reveal that disruption associated with amyloid burden involves interactions between the widespread cortical regions that comprise the default network and the hippocampal formation.
Consistent with earlier reports (Aizenstein et al., 2008; Jack et al., 2008; Mormino et al., 2009) (but see Pike et al., 2007), amyloid burden was not associated with detectable differences in neuropsychological test performance, suggesting that functional disruption can occur either absent cognitive impairment or with impairment so mild as to be below threshold on standard tests. One possibility is that compensatory processes can mitigate behavioral decline for a period of time when amyloid is present in the brain and associated with functional consequences.
There are multiple implications of the observation that amyloid burden is associated with functional differences in clinically normal individuals. First, consistent with models that place amyloid-β as an important protein product initiating or correlated with synaptic toxicity in AD (Mattson, 2004; Walsh and Selkoe, 2004), the present results show the presence of amyloid deposition is correlated with physiological differences in normal older adults. The results are inconsistent with models that suggest amyloid-β is unrelated to dysfunction in AD, although the results do not directly speak to whether amyloid-β is causal to the toxic cascade.
Second, the results suggest functional disruption in AD may be present years before the onset of clinical symptoms. Although the results do not yet include longitudinal follow-up to firmly establish that the observed disruption is prodromal AD, the observation that amyloid deposition is linked to mild forms of cortical dysfunction that are observed in MCI and AD (e.g., Greicius et al., 2004; Sorg et al., 2007) suggests that the effects may reflect an endophenotype of AD. Disruptions of functional connectivity, used in conjunction with other markers and in the presence of amyloid deposition or CSF markers of amyloid levels, may eventually allow the targeting of at-risk individuals for early diagnosis and interventional therapies.
Third, these results hold an important implication for the study of normal aging— namely, that a substantial fraction of clinically normal individuals harbor amyloid burden that is linked to functional disruption. Normal aging, independent of amyloid burden, is associated with nonspecific network disruption that includes but extends beyond the default network (Andrews-Hanna et al., 2007; Damoiseaux et al., 2008). Molecular markers of amyloid burden will be important to clarify the relationship between normal and pathological aging given the prevalence of amyloid burden in the clinically normal population.
Finally, the observation from our whole-brain analyses that network disruption includes the hippocampal formation and, specifically, its correlation with the posterior cingulate is consistent with the possibility that memory network failure may be an early consequence of amyloid burden. The default network consists of multiple distributed regions including the posterior cingulate cortex/retrosplenial cortex, the ventromedial prefrontal cortex, and the inferior lateral parietal cortex, and can be subdivided into at least two interacting subsystems—one involving the medial temporal lobe and the other involving the dorsomedial prefrontal cortex (Buckner et al., 2008; Greicius et al., 2009). Our exploratory whole-brain analyses indicate that the subsystem correlating with the hippocampal formation is disrupted. Future work will be required to determine whether the medial temporal lobe subsystem is preferentially associated with disruption in the earliest preclinical stages of AD or whether the broader network of cortical regions is affected earliest because of its high baseline metabolism and activity fluctuations (e.g., Buckner et al., 2005; 2009). A possibility that will need to be considered is that functional correlations may be impacted by amyloid burden in remote regions if such regions modulate or interact with the correlated regions under investigation.
It remains to be determined whether the early effects of amyloid burden are associated with declines in cognitive capacities such as memory, which are defining symptoms of AD, and whether longitudinal studies will reveal a predictive effect of amyloid burden on eventual progression from normal cognitive status to MCI or AD. The detection of network disruptions among those clinically normal older adults with substantial amyloid burden indicates that amyloid does associate with a detrimental neurophysiological effect even before cognitive consequences are observed on standard neuropsychological tests. Further research is needed to definitively attribute a neuronal source to these network disruptions, as opposed to physiological influences on neurovascular coupling. Further exploration of cognitive performance on more sensitive tests of memory and also the exploration of mediating influences, such as cognitive reserve, may reveal cognitive correlates of the functional disruption observed here.
Footnotes
This research was supported by National Institutes on Aging Grants AG-021910 and AG-027435-S1, Alzheimer Disease Research Center, Grant P50AG005134, the Howard Hughes Medical Institute, and the Alzheimer's Association. K.R.A.V.D. was supported by the Netherlands Organization for Scientific Research. We thank Renee Poulin, Jeremy Caramasin, and Meghan Frey for assistance during data collection, and Tanveer Talukdar and Itamar Kahn for technical advice. The Athinoula A. Martinos Center MRI Core provided assistance with MRI imaging, and the Massachusetts General Hospital Molecular Imaging PET Core provided assistance with amyloid imaging. Bill Klunk and Chet Mathis provided assistance with PiB. Dorene Rentz and the Massachusetts Alzheimer's Disease Research Center provided assistance with clinical and neuropsychological characterization of the participants.
K.A.J. has served as paid consultant to GE Healthcare, Ltd., which holds a license agreement with the University of Pittsburgh based on the PiB technology described in this article. GE Healthcare provided no grant support for this study and had no role in the design or interpretation of results or preparation of this article.
References
- Aizenstein HJ, Nebes RD, Saxton JA, Price JC, Mathis CA, Tsopelas ND, Ziolko SK, James JA, Snitz BE, Houck PR, Bi W, Cohen AD, Lopresti BJ, DeKosky ST, Halligan EM, Klunk WE. Frequent amyloid deposition without significant cognitive impairment among the elderly. Arch Neurol. 2008;65:1509–1517. doi: 10.1001/archneur.65.11.1509. [DOI] [PMC free article] [PubMed] [Google Scholar]
- Andrews-Hanna JR, Snyder AZ, Vincent JL, Lustig C, Head D, Raichle ME, Buckner RL. Disruption of large-scale brain systems in advanced aging. Neuron. 2007;56:924–935. doi: 10.1016/j.neuron.2007.10.038. [DOI] [PMC free article] [PubMed] [Google Scholar]
- Ashburner J, Friston KJ. Voxel-based morphometry—the methods. Neuroimage. 2000;11:805–821. doi: 10.1006/nimg.2000.0582. [DOI] [PubMed] [Google Scholar]
- Bacskai BJ, Frosch MP, Freeman SH, Raymond SB, Augustinack JC, Johnson KA, Irizarry MC, Klunk WE, Mathis CA, Dekosky ST, Greenberg SM, Hyman BT, Growdon JH. Molecular imaging with Pittsburgh Compound B confirmed at autopsy: a case report. Arch Neurol. 2007;64:431–434. doi: 10.1001/archneur.64.3.431. [DOI] [PubMed] [Google Scholar]
- Birn RM, Diamond JB, Smith MA, Bandettini PA. Separating respiratory-variation-related fluctuations from neuronal-activity-related fluctuations in fMRI. Neuroimage. 2006;31:1536–1548. doi: 10.1016/j.neuroimage.2006.02.048. [DOI] [PubMed] [Google Scholar]
- Biswal B, Yetkin FZ, Haughton VM, Hyde JS. Functional connectivity in the motor cortex of resting human brain using echo-planar MRI. Magn Reson Med. 1995;34:537–541. doi: 10.1002/mrm.1910340409. [DOI] [PubMed] [Google Scholar]
- Brainard DH. The Psychophysics Toolbox. Spat Vis. 1997;10:433–436. [PubMed] [Google Scholar]
- Buckner RL, Snyder AZ, Shannon BJ, LaRossa G, Sachs R, Fotenos AF, Sheline YI, Klunk WE, Mathis CA, Morris JC, Mintun MA. Molecular, structural, and functional characterization of Alzheimer's disease: evidence for a relationship between default activity, amyloid, and memory. J Neurosci. 2005;25:7709–7717. doi: 10.1523/JNEUROSCI.2177-05.2005. [DOI] [PMC free article] [PubMed] [Google Scholar]
- Buckner RL, Andrews-Hanna JR, Schacter DL. The brain's default network: anatomy, function, and relevance to disease. Ann N Y Acad Sci. 2008;1124:1–38. doi: 10.1196/annals.1440.011. [DOI] [PubMed] [Google Scholar]
- Buckner RL, Sepulcre J, Talukdar T, Krienen FM, Liu H, Hedden T, Andrews-Hanna JR, Sperling RA, Johnson KA. Cortical hubs revealed by intrinsic functional connectivity: mapping, assessment of stability, and relation to Alzheimer's disease. J Neurosci. 2009;29:1860–1873. doi: 10.1523/JNEUROSCI.5062-08.2009. [DOI] [PMC free article] [PubMed] [Google Scholar]
- Celone KA, Calhoun VD, Dickerson BC, Atri A, Chua EF, Miller SL, DePeau K, Rentz DM, Selkoe DJ, Blacker D, Albert MS, Sperling RA. Alterations in memory networks in mild cognitive impairment and Alzheimer's disease: an independent component analysis. J Neurosci. 2006;26:10222–10231. doi: 10.1523/JNEUROSCI.2250-06.2006. [DOI] [PMC free article] [PubMed] [Google Scholar]
- Damoiseaux JS, Beckmann CF, Arigita EJ, Barkhof F, Scheltens P, Stam CJ, Smith SM, Rombouts SA. Reduced resting-state brain activity in the “default network” in normal aging. Cereb Cortex. 2008;18:1856–1864. doi: 10.1093/cercor/bhm207. [DOI] [PubMed] [Google Scholar]
- Dickerson BC, Bakkour A, Salat DH, Feczko E, Pacheco J, Greve DN, Grodstein F, Wright CI, Blacker D, Rosas HD, Sperling RA, Atri A, Growdon JH, Hyman BT, Morris JC, Fischl B, Buckner RL. The cortical signature of Alzheimer's disease: Regionally specific cortical thinning relates to symptom severity in very mild to mild AD dementia and is detectable in asymptomatic amyloid positive individuals. Cereb Cortex. 2009;19:497–510. doi: 10.1093/cercor/bhn113. [DOI] [PMC free article] [PubMed] [Google Scholar]
- Engler H, Forsberg A, Almkvist O, Blomquist G, Larsson E, Savitcheva I, Wall A, Ringheim A, Långström B, Nordberg A. Two-year follow-up of amyloid deposition in patients with Alzheimer's disease. Brain. 2006;129:2805–2807. doi: 10.1093/brain/awl178. [DOI] [PubMed] [Google Scholar]
- Evans AJ, Iwai F, Grist TA, Sostman HD, Hedlund LW, Spritzer CE, Negro-Vilar R, Beam CA, Pelc NJ. Magnetic resonance imaging of blood flow with a phase subtraction technique. In vitro and in vivo validation. Invest Radiol. 1993;28:109–115. doi: 10.1097/00004424-199302000-00004. [DOI] [PubMed] [Google Scholar]
- Fagan AM, Mintun MA, Mach RH, Lee SY, Dence CS, Shah AR, LaRossa GN, Spinner ML, Klunk WE, Mathis CA, DeKosky ST, Morris JC, Holtzman DM. Inverse relation between in vivo amyloid imaging load and cerebrospinal fluid Abeta42 in humans. Ann Neurol. 2006;59:512–519. doi: 10.1002/ana.20730. [DOI] [PubMed] [Google Scholar]
- Fair DA, Schlaggar BL, Cohen AL, Miezin FM, Dosenbach NU, Wenger KK, Fox MD, Snyder AZ, Raichle ME, Petersen SE. A method for using blocked and event-related fMRI data to study “resting state” functional connectivity. Neuroimage. 2007;35:396–405. doi: 10.1016/j.neuroimage.2006.11.051. [DOI] [PMC free article] [PubMed] [Google Scholar]
- Fotenos AF, Mintun MA, Snyder AZ, Morris JC, Buckner RL. Brain volume decline in aging: evidence for a relation between socioeconomic status, preclinical Alzheimer disease, and reserve. Arch Neurol. 2008;65:113–120. doi: 10.1001/archneurol.2007.27. [DOI] [PubMed] [Google Scholar]
- Fox MD, Snyder AZ, Vincent JL, Corbetta M, Van Essen DC, Raichle ME. The human brain is intrinsically organized into dynamic, anticorrelated functional networks. Proc Natl Acad Sci U S A. 2005;102:9673–9678. doi: 10.1073/pnas.0504136102. [DOI] [PMC free article] [PubMed] [Google Scholar]
- Fransson P, Marrelec G. The precuneus/posterior cingulate cortex plays a pivotal role in the default mode network: evidence from a partial correlation network analysis. Neuroimage. 2008;42:1178–1184. doi: 10.1016/j.neuroimage.2008.05.059. [DOI] [PubMed] [Google Scholar]
- Fripp J, Bourgeat P, Acosta O, Raniga P, Modat M, Pike KE, Jones G, O'Keefe G, Masters CL, Ames D, Ellis KA, Maruff P, Currie J, Villemagne VL, Rowe CC, Salvado O, Ourselin S. Appearance modeling of 11C PiB PET images: characterizing amyloid deposition in Alzheimer's disease, mild cognitive impairment and healthy aging. Neuroimage. 2008;43:430–439. doi: 10.1016/j.neuroimage.2008.07.053. [DOI] [PubMed] [Google Scholar]
- Gomperts SN, Rentz DM, Moran E, Becker JA, Locascio JJ, Klunk WE, Mathis CA, Elmaleh DR, Shoup T, Fischman AJ, Hyman BT, Growdon JH, Johnson KA. Imaging amyloid deposition in Lewy body diseases. Neurology. 2008;71:903–910. doi: 10.1212/01.wnl.0000326146.60732.d6. [DOI] [PMC free article] [PubMed] [Google Scholar]
- Greicius MD, Krasnow B, Reiss AL, Menon V. Functional connectivity in the resting brain: a network analysis of the default mode hypothesis. Proc Natl Acad Sci U S A. 2003;100:253–258. doi: 10.1073/pnas.0135058100. [DOI] [PMC free article] [PubMed] [Google Scholar]
- Greicius MD, Srivastava G, Reiss AL, Menon V. Default-mode network activity distinguishes Alzheimer's disease from healthy aging: evidence from functional MRI. Proc Natl Acad Sci U S A. 2004;101:4637–4642. doi: 10.1073/pnas.0308627101. [DOI] [PMC free article] [PubMed] [Google Scholar]
- Greicius MD, Supekar K, Menon V, Dougherty RF. Resting-state functional connectivity reflects structural connectivity in the default mode network. Cereb Cortex. 2009;19:72–78. doi: 10.1093/cercor/bhn059. [DOI] [PMC free article] [PubMed] [Google Scholar]
- Grimmer T, Henriksen G, Wester HJ, Forstl H, Klunk WE, Mathis CA, Kurz A, Drzezga A. Clinical severity of Alzheimer's disease is associated with PIB uptake in PET. Neurobiol Aging. 2008 doi: 10.1016/j.neurobiolaging.2008.01.016. [DOI] [PubMed] [Google Scholar]
- Grober E, Sliwinski M. Development and validation of a model for estimating premorbid verbal intelligence in the elderly. J Clin Exp Neuropsychol. 1991;13:933–949. doi: 10.1080/01688639108405109. [DOI] [PubMed] [Google Scholar]
- Gusnard DA, Raichle ME. Searching for a baseline: functional imaging and the resting human brain. Nat Rev Neurosci. 2001;2:685–694. doi: 10.1038/35094500. [DOI] [PubMed] [Google Scholar]
- Herholz K, Salmon E, Perani D, Baron JC, Holthoff V, Frölich L, Schönknecht P, Ito K, Mielke R, Kalbe E, Zündorf G, Delbeuck X, Pelati O, Anchisi D, Fazio F, Kerrouche N, Desgranges B, Eustache F, Beuthien-Baumann B, Menzel C, et al. Discrimination between Alzheimer dementia and controls by automated analysis of multicenter FDG PET. Neuroimage. 2002;17:302–316. doi: 10.1006/nimg.2002.1208. [DOI] [PubMed] [Google Scholar]
- Hollingshead AB. Two factor index of social position. Mimeo. New Haven, CT: Yale University; 1957. [Google Scholar]
- Ikonomovic MD, Klunk WE, Abrahamson EE, Mathis CA, Price JC, Tsopelas ND, Lopresti BJ, Ziolko S, Bi W, Paljug WR, Debnath ML, Hope CE, Isanski BA, Hamilton RL, DeKosky ST. Post-mortem correlates of in vivo PiB-PET amyloid imaging in a typical case of Alzheimer's disease. Brain. 2008;131:1630–1645. doi: 10.1093/brain/awn016. [DOI] [PMC free article] [PubMed] [Google Scholar]
- Jack CR, Jr, Lowe VJ, Senjem ML, Weigand SD, Kemp BJ, Shiung MM, Knopman DS, Boeve BF, Klunk WE, Mathis CA, Petersen RC. 11C PiB and structural MRI provide complementary information in imaging of Alzheimer's disease and amnestic mild cognitive impairment. Brain. 2008;131:665–680. doi: 10.1093/brain/awm336. [DOI] [PMC free article] [PubMed] [Google Scholar]
- Jack CR, Jr, Lowe VJ, Weigand SD, Wiste HJ, Senjem ML, Knopman DS, Shiung MM, Gunter JL, Boeve BF, Kemp BJ, Weiner M, Petersen RC. Serial PIB and MRI in normal, mild cognitive impairment and Alzheimer's disease: implications for sequence of pathological events in Alzheimer's disease. Brain. 2009;132:1355–1365. doi: 10.1093/brain/awp062. [DOI] [PMC free article] [PubMed] [Google Scholar]
- Jenkinson M, Smith S. A global optimisation method for robust affine registration of brain images. Med Image Anal. 2001;5:143–156. doi: 10.1016/s1361-8415(01)00036-6. [DOI] [PubMed] [Google Scholar]
- Jenkinson M, Bannister P, Brady M, Smith S. Improved optimization for the robust and accurate linear registration and motion correction of brain images. Neuroimage. 2002;17:825–841. doi: 10.1016/s1053-8119(02)91132-8. [DOI] [PubMed] [Google Scholar]
- Johnson KA. Amyloid imaging of Alzheimer's disease using Pittsburgh Compound B. Curr Neurol Neurosci Rep. 2006;6:496–503. doi: 10.1007/s11910-006-0052-5. [DOI] [PubMed] [Google Scholar]
- Johnson KA, Gregas M, Becker JA, Kinnecom C, Salat DH, Moran EK, Smith EE, Rosand J, Rentz DM, Klunk WE, Mathis CA, Price JC, Dekosky ST, Fischman AJ, Greenberg SM. Imaging of amyloid burden and distribution in cerebral amyloid angiopathy. Ann Neurol. 2007;62:229–234. doi: 10.1002/ana.21164. [DOI] [PubMed] [Google Scholar]
- Kahn I, Andrews-Hanna JR, Vincent JL, Snyder AZ, Buckner RL. Distinct cortical anatomy linked to subregions of the medial temporal lobe revealed by intrinsic functional connectivity. J Neurophysiol. 2008;100:129–139. doi: 10.1152/jn.00077.2008. [DOI] [PMC free article] [PubMed] [Google Scholar]
- Klunk WE, Mathis CA. The future of amyloid-beta imaging: a tale of radionuclides and tracer proliferation. Curr Opin Neurol. 2008;21:683–687. doi: 10.1097/WCO.0b013e3283168e1a. [DOI] [PMC free article] [PubMed] [Google Scholar]
- Klunk WE, Engler H, Nordberg A, Wang Y, Blomqvist G, Holt DP, Bergström M, Savitcheva I, Huang GF, Estrada S, Ausén B, Debnath ML, Barletta J, Price JC, Sandell J, Lopresti BJ, Wall A, Koivisto P, Antoni G, Mathis CA, et al. Imaging brain amyloid in Alzheimer's disease with Pittsburgh Compound-B. Ann Neurol. 2004;55:306–319. doi: 10.1002/ana.20009. [DOI] [PubMed] [Google Scholar]
- Kwong KK, Belliveau JW, Chesler DA, Goldberg IE, Weisskoff RM, Poncelet BP, Kennedy DN, Hoppel BE, Cohen MS, Turner R, Cheng HM, Brady TJ, Rosen BR. Dynamic magnetic resonance imaging of human brain activity during primary sensory stimulation. Proc Natl Acad Sci U S A. 1992;89:5675–5679. doi: 10.1073/pnas.89.12.5675. [DOI] [PMC free article] [PubMed] [Google Scholar]
- Logan J, Fowler JS, Volkow ND, Wolf AP, Dewey SL, Schlyer DJ, MacGregor RR, Hitzemann R, Bendriem B, Gatley SJ, Christman DR. Graphical analysis of reversible radioligand binding from time-activity measurements applied to [N-11C-methyl]-(−)-cocaine PET studies in human subjects. J Cereb Blood Flow Metab. 1990;10:740–747. doi: 10.1038/jcbfm.1990.127. [DOI] [PubMed] [Google Scholar]
- Lopresti BJ, Klunk WE, Mathis CA, Hoge JA, Ziolko SK, Lu X, Meltzer CC, Schimmel K, Tsopelas ND, DeKosky ST, Price JC. Simplified quantification of Pittsburgh Compound B amyloid imaging PET studies: a comparative analysis. J Nucl Med. 2005;46:1959–1972. [PubMed] [Google Scholar]
- Lustig C, Snyder AZ, Bhakta M, O'Brien KC, McAvoy M, Raichle ME, Morris JC, Buckner RL. Functional deactivations: change with age and dementia of the Alzheimer type. Proc Natl Acad Sci U S A. 2003;100:14504–14509. doi: 10.1073/pnas.2235925100. [DOI] [PMC free article] [PubMed] [Google Scholar]
- Macey PM, Macey KE, Kumar R, Harper RM. A method for removal of global effects from fMRI time series. Neuroimage. 2004;22:360–366. doi: 10.1016/j.neuroimage.2003.12.042. [DOI] [PubMed] [Google Scholar]
- Mattson MP. Pathways towards and away from Alzheimer's disease. Nature. 2004;430:631–639. doi: 10.1038/nature02621. [DOI] [PMC free article] [PubMed] [Google Scholar]
- Minoshima S, Giordani B, Berent S, Frey KA, Foster NL, Kuhl DE. Metabolic reduction in the posterior cingulate cortex in very early Alzheimer's disease. Ann Neurol. 1997;42:85–94. doi: 10.1002/ana.410420114. [DOI] [PubMed] [Google Scholar]
- Mintun MA, Larossa GN, Sheline YI, Dence CS, Lee SY, Mach RH, Klunk WE, Mathis CA, DeKosky ST, Morris JC. [11C]PIB in a nondemented population: potential antecedent marker of Alzheimer disease. Neurology. 2006;67:446–452. doi: 10.1212/01.wnl.0000228230.26044.a4. [DOI] [PubMed] [Google Scholar]
- Alzheimer's Disease Neuroimaging Initiative. Mormino EC, Kluth JT, Madison CM, Rabinovici GD, Baker SL, Miller BL, Koeppe RA, Mathis CA, Weiner MW, Jagust WJ. Episodic memory loss is related to hippocampal-mediated beta-amyloid deposition in elderly subjects. Brain. 2009;132:1310–1323. doi: 10.1093/brain/awn320. [DOI] [PMC free article] [PubMed] [Google Scholar]
- Ogawa S, Tank DW, Menon R, Ellermann JM, Kim SG, Merkle H, Ugurbil K. Intrinsic signal changes accompanying sensory stimulation: functional brain mapping with magnetic resonance imaging. Proc Natl Acad Sci U S A. 1992;89:5951–5955. doi: 10.1073/pnas.89.13.5951. [DOI] [PMC free article] [PubMed] [Google Scholar]
- Pelli DG. The VideoToolbox software for visual psychophysics: transforming numbers into movies. Spat Vis. 1997;10:437–442. [PubMed] [Google Scholar]
- Pihlajamäki M, DePeau KM, Blacker D, Sperling RA. Impaired medial temporal repetition suppression is related to failure of parietal deactivation in Alzheimer disease. Am J Geriatr Psychiatry. 2008;16:283–292. doi: 10.1097/JGP.0b013e318162a0a9. [DOI] [PMC free article] [PubMed] [Google Scholar]
- Pike KE, Savage G, Villemagne VL, Ng S, Moss SA, Maruff P, Mathis CA, Klunk WE, Masters CL, Rowe CC. Beta-amyloid imaging and memory in non-demented individuals: evidence for preclinical Alzheimer's disease. Brain. 2007;130:2837–2844. doi: 10.1093/brain/awm238. [DOI] [PubMed] [Google Scholar]
- Price JC, Klunk WE, Lopresti BJ, Lu X, Hoge JA, Ziolko SK, Holt DP, Meltzer CC, DeKosky ST, Mathis CA. Kinetic modeling of amyloid binding in humans using PET imaging and Pittsburgh Compound-B. J Cereb Blood Flow Metab. 2005;25:1528–1547. doi: 10.1038/sj.jcbfm.9600146. [DOI] [PubMed] [Google Scholar]
- Rabinovici GD, Furst AJ, O'Neil JP, Racine CA, Mormino EC, Baker SL, Chetty S, Patel P, Pagliaro TA, Klunk WE, Mathis CA, Rosen HJ, Miller BL, Jagust WJ. 11C-PIB PET imaging in Alzheimer disease and frontotemporal lobar degeneration. Neurology. 2007;68:1205–1212. doi: 10.1212/01.wnl.0000259035.98480.ed. [DOI] [PubMed] [Google Scholar]
- Raichle ME, MacLeod AM, Snyder AZ, Powers WJ, Gusnard DA, Shulman GL. A default mode of brain function. Proc Natl Acad Sci U S A. 2001;98:676–682. doi: 10.1073/pnas.98.2.676. [DOI] [PMC free article] [PubMed] [Google Scholar]
- Raji CA, Becker JT, Tsopelas ND, Price JC, Mathis CA, Saxton JA, Lopresti BJ, Hoge JA, Ziolko SK, DeKosky ST, Klunk WE. Characterizing regional correlation, laterality and symmetry of amyloid deposition in mild cognitive impairment and Alzheimer's disease with Pittsburgh Compound B. J Neurosci Methods. 2008;172:277–282. doi: 10.1016/j.jneumeth.2008.05.005. [DOI] [PMC free article] [PubMed] [Google Scholar]
- Reiman EM, Caselli RJ, Yun LS, Chen K, Bandy D, Minoshima S, Thibodeau SN, Osborne D. Preclinical evidence of Alzheimer's disease in persons homozygous for the epsilon 4 allele for apolipoprotein E. N Engl J Med. 1996;334:752–758. doi: 10.1056/NEJM199603213341202. [DOI] [PubMed] [Google Scholar]
- Reiman EM, Chen K, Liu X, Bandy D, Yu M, Lee W, Ayutyanont N, Keppler J, Reeder SA, Langbaum JB, Alexander GE, Klunk WE, Mathis CA, Price JC, Aizenstein HJ, DeKosky ST, Caselli RJ. Fibrillar amyloid-beta burden in cognitively normal people at 3 levels of genetic risk for Alzheimer's disease. Proc Natl Acad Sci U S A. 2009;106:6820–6825. doi: 10.1073/pnas.0900345106. [DOI] [PMC free article] [PubMed] [Google Scholar]
- Rombouts SA, Barkhof F, Goekoop R, Stam CJ, Scheltens P. Altered resting state networks in mild cognitive impairment and mild Alzheimer's disease: an fMRI study. Hum Brain Mapp. 2005;26:231–239. doi: 10.1002/hbm.20160. [DOI] [PMC free article] [PubMed] [Google Scholar]
- Rowe CC, Ng S, Ackermann U, Gong SJ, Pike K, Savage G, Cowie TF, Dickinson KL, Maruff P, Darby D, Smith C, Woodward M, Merory J, Tochon-Danguy H, O'Keefe G, Klunk WE, Mathis CA, Price JC, Masters CL, Villemagne VL. Imaging beta-amyloid burden in aging and dementia. Neurology. 2007;68:1718–1725. doi: 10.1212/01.wnl.0000261919.22630.ea. [DOI] [PubMed] [Google Scholar]
- Ryan JJ, Paolo AM. A screening procedure for estimating premorbid intelligence in the elderly. Clin Neuropsychol. 1992;6:53–62. [PubMed] [Google Scholar]
- Salthouse TA. The processing-speed theory of adult age differences in cognition. Psychol Rev. 1996;103:403–428. doi: 10.1037/0033-295x.103.3.403. [DOI] [PubMed] [Google Scholar]
- Scahill RI, Schott JM, Stevens JM, Rossor MN, Fox NC. Mapping the evolution of regional atrophy in Alzheimer's disease: unbiased analysis of fluid-registered serial MRI. Proc Natl Acad Sci U S A. 2002;99:4703–4707. doi: 10.1073/pnas.052587399. [DOI] [PMC free article] [PubMed] [Google Scholar]
- Schmidt M. Rey auditory-verbal learning test. Lutz, FL: Psychological Assessment Resources; 1996. [Google Scholar]
- Sorg C, Riedl V, Mühlau M, Calhoun VD, Eichele T, Läer L, Drzezga A, Förstl H, Kurz A, Zimmer C, Wohlschläger AM. Selective changes of resting-state networks in individuals at risk for Alzheimer's disease. Proc Natl Acad Sci U S A. 2007;104:18760–18765. doi: 10.1073/pnas.0708803104. [DOI] [PMC free article] [PubMed] [Google Scholar]
- Sperling RA, Laviolette P, O'Keefe K, O'Brien J, Rentz DM, Pihlajamaki M, Marshall G, Hyman BT, Selkoe DJ, Hedden T, Buckner RL, Becker JA, Johnson KA. Amyloid deposition is associated with impaired default network function in older persons without dementia. Neuron. 2009;63:178–188. doi: 10.1016/j.neuron.2009.07.003. [DOI] [PMC free article] [PubMed] [Google Scholar]
- Spreen O, Benton AL. Victoria, BC: University of Victoria Neuropsychology Laboratory; 1977. Neurosensory center comprehensive examination for aphasia (NCCEA) [Google Scholar]
- Thompson PM, Hayashi KM, de Zubicaray G, Janke AL, Rose SE, Semple J, Herman D, Hong MS, Dittmer SS, Doddrell DM, Toga AW. Dynamics of gray matter loss in Alzheimer's disease. J Neurosci. 2003;23:994–1005. doi: 10.1523/JNEUROSCI.23-03-00994.2003. [DOI] [PMC free article] [PubMed] [Google Scholar]
- Van Dijk KR, Hedden T, Tu PC, LaViolette P, Sperling RA, Buckner RL. Optimal acquisition parameters for resting state functional connectivity MRI. Soc Neurosci Abstr. 2008;34:885–24. [Google Scholar]
- Villemagne VL, Pike KE, Darby D, Maruff P, Savage G, Ng S, Ackermann U, Cowie TF, Currie J, Chan SG, Jones G, Tochon-Danguy H, O'Keefe G, Masters CL, Rowe CC. Abeta deposits in older non-demented individuals with cognitive decline are indicative of preclinical Alzheimer's disease. Neuropsychologia. 2008;46:1688–1697. doi: 10.1016/j.neuropsychologia.2008.02.008. [DOI] [PubMed] [Google Scholar]
- Vincent JL, Snyder AZ, Fox MD, Shannon BJ, Andrews JR, Raichle ME, Buckner RL. Coherent spontaneous activity identifies a hippocampal-parietal memory network. J Neurophysiol. 2006;96:3517–3531. doi: 10.1152/jn.00048.2006. [DOI] [PubMed] [Google Scholar]
- Walsh DM, Selkoe DJ. Deciphering the molecular basis of memory failure in Alzheimer's disease. Neuron. 2004;44:181–193. doi: 10.1016/j.neuron.2004.09.010. [DOI] [PubMed] [Google Scholar]
- Wechsler D. WAIS-III/WMS-III technical manual: updated. San Antonio, TX: Psychological Corporation; 2002. [Google Scholar]
- Wise RG, Ide K, Poulin MJ, Tracey I. Resting fluctuations in arterial carbon dioxide induce significant low frequency variations in BOLD signal. Neuroimage. 2004;21:1652–1664. doi: 10.1016/j.neuroimage.2003.11.025. [DOI] [PubMed] [Google Scholar]
- Witt ST, Laird AR, Meyerand ME. Functional neuroimaging correlates of finger-tapping task variations: an ALE meta-analysis. Neuroimage. 2008;42:343–356. doi: 10.1016/j.neuroimage.2008.04.025. [DOI] [PMC free article] [PubMed] [Google Scholar]
- Yesavage JA, Brink TL, Rose TL, Lum O, Huang V, Adey MB, Leirer VO. Development and validation of a geriatric depression rating scale: a preliminary report. J Psychiatr Res. 1983;17:37–49. doi: 10.1016/0022-3956(82)90033-4. [DOI] [PubMed] [Google Scholar]
- Zar J. Biostatistical analysis. Upper Saddle River, NJ: Prentice-Hall; 1996. [Google Scholar]