Abstract
Satratoxin G (SG), a macrocyclic trichothecene produced by Stachybotrys chartarum, induces apoptosis in cultured neuronal cells as well as nasal olfactory sensory neurons (OSN) in the nose and brain of mice exposed intranasally to this toxin. The purpose of this study was to (1) develop a facile method for production and purification of both SG, and its putative biosynthetic precursor, roridin L2 (RL2), from S. chartarum cultures and (2) compare their relative neurotoxicity in vitro and in vivo. S. chartarum 29-58-17 was cultured in Fernbach flasks on rice (5×10⁵ spores /250g rice) for 4 to 6 weeks. Following extraction with acetonitrile, the extract was dried, dissolved in dichloromethane and subjected to Michel-Miller silica gel chromatography using a stepwise acetonitrile-dichloromethane gradient with SG and RL2 eluting in the 30 and 40% acetonitrile fractions, respectively. Purification of the two compounds was completed by C18 semi-preparative reverse phase liquid chromatography using an acetonitrile-water gradient and purity confirmed by electrospray ionization/collision-induced dissociation (ESI-CID) tandem mass spectroscopy. Although viability significantly decreased in PC-12 neuronal cells treated with 10 to 25 ng/ml of SG, RL2 at concentrations up to 1000 ng/ml were not toxic. Flow cytometry and agarose DNA fragmentation assays revealed that SG at 10 to 25 ng/ml induced apoptotic death in the PC-12 cells while RL2 at concentrations up to 1000 ng/ml were without effect. In similar fashion, intranasal exposure of mice (female B6C3F1) to SG at 100 µg/kg bw induced marked OSN apoptosis and atrophy of the olfactory epithelium whereas RL2 at the equivalent dose did not exhibit toxicity. Taken together, an optimized protocol for production and isolation of trichothecenes from S. chartarum cultures is described and further demonstrates that while the macrocyclic SG was neurotoxic in vitro and in vivo, its biosynthetic precursor, RL2 was non-toxic.
Introduction
The black mold Stachybotrys chartarum, a saprophytic fungus that grows on cellulosic construction materials including wallboard, ceiling tiles and wood, has been proposed to contribute etiologically to damp building-related illnesses (Pestka et al. 2008). When this mold is identified during environmental inspections of water-damaged buildings, it often raises concerns regarding health of the occupants. While in vitro and in vivo studies suggest that evocation of adverse effects in humans by S. chartarum is biologically plausible, unequivocal association of this fungus with building-related illnesses requires further validation from the perspectives of mechanisms, dose-response and exposure assessment (Institute of Medicine 2004). Since this mold and its mycotoxins may become airborne and expose inhabitants by inhalation, it is particularly critical to understand how toxins elaborated by Stachybotrys affect the upper airway and their relationship to adverse immunologic, respiratory and neurologic effects that have been associated with damp building-related illnesses.
Severe toxicoses have been documented in animals ingesting fodder contaminated with Stachybotrys (Schneider et al. 1979) with toxic manifestations being highly consistent with the trichothecene mycotoxins (Ueno 1984). The trichothecenes consist of over 200 structurally related sesquiterpenoid metabolites produced by fungi common to the environment and agrifoods (Grove 2007). These low molecular weight (~200–500D) mycotoxins interact with eukaryotic ribosomes, resulting in suppression of polypeptide chain initiation or elongation (Bamburg 1983) as well as induction of intracellular stress responses capable of driving both proinflammatory gene expression and apoptosis (Chung et al. 2003; Pestka 2008; Wong et al. 1998; Zhou et al. 2005).
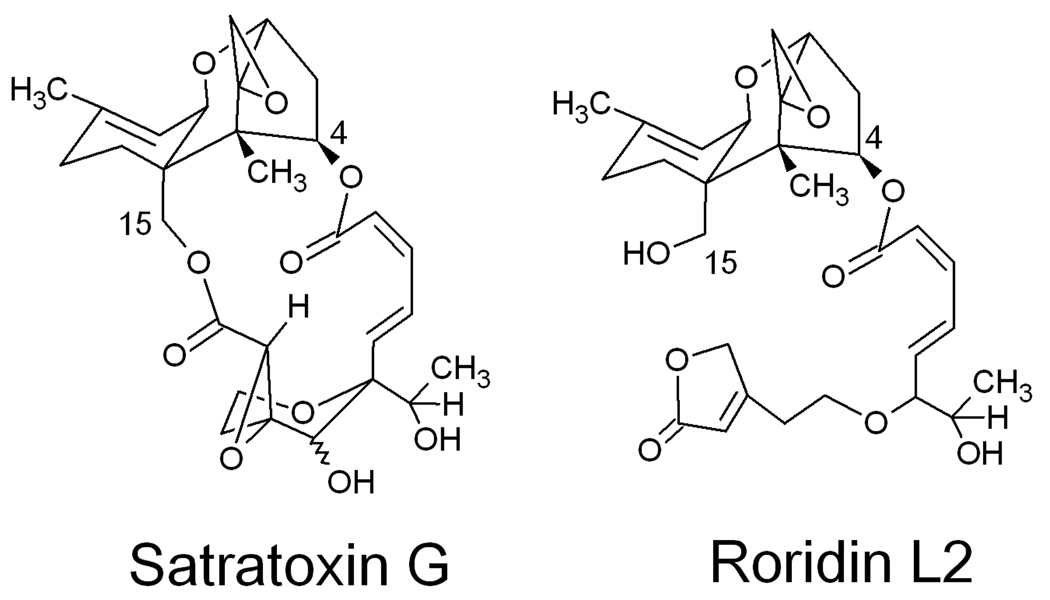
All trichothecenes have in common a 9, 10 double bond and a 12, 13 epoxide group, but extensive variation exists relative to ring oxygenation patterns (Bamburg 1983). The three major structural groups include the Type A trichothecenes which have isovaleryl, hydrogen, or hydroxyl moieties at the C-8 position, Type B trichothecenes which have a carbonyl group at the C-8 position and macrocyclic trichothecenes which conventionally have a cyclic diester or triester ring linking C-4 to C-15 (Grove 2000;1993; 1988). The latter are considered to include the most toxic trichothecenes (Pestka et al. 2008; Pestka and Forsell 1988; Thompson and Wannemacher, Jr. 1986). Brasel et al. (2005) observed that airborne macrocyclic trichothecenes may exist in Stachybotrys-contaminated buildings. Approximately one third of the S. chartarum isolates from the U.S. and Europe belong to a chemotype that produces macrocyclic trichothecenes, most notably the satratoxins and roridins (Andersen et al. 2002). Satratoxin G (SG) and its putative biosynthetic precursor roridin L2 (RL2) (Fig. 1) are two common trichothecenes produced by S. chartarum isolates from water-damaged homes (Nielsen 2002). While SG contains an intact macrocyclic ring linking C-4 to C-15, the precursor RL2 contains only an extended carbon chain linked at C-4. The toxicological significance of these differences is not known.
Fig. 1.
Structures of SG and RL2.
Within 24 hr after a single intranasal instillation of mice with SG or with two other related macrocyclic trichothecenes, isosatratoxin F and roridin A, there is widespread apoptosis of olfactory sensory neurons (OSN) in the olfactory epithelium lining the nasal airways and in the adjacent olfactory bulb of the brain (Islam et al. 2006;2007). While the onset of OSN apoptosis corresponds with increases of proinflammatory and proapoptotic gene expression in the nasal turbinates, the upstream mechanism(s) remains unclear. Recent studies indicate that SG induces apoptosis within 48 hr in the PC-12 neuronal cell model (Islam et al. 2008). Prior to and during apoptosis, SG markedly upregulates the expression of PKR, BAX and p53 in these cultured cells, which is consistent with in vivo toxicity observed in mice exposed intranasally to this toxin.
Understanding the toxic mechanisms by which macrocyclic trichothecenes selectively target OSN might provide clues as to how olfactory function loss occurs in neurodegenerative illnesses such as Parkinson’s and Alzheimer’s diseases (Demarquay et al. 2007; Hawkes 2003; Takeda et al. 2007). A major limitation to such studies is that SG and related macrocyclic trichothecenes are not commercially available. Furthermore, published methods for their lab-scale production and isolation from cultures are complicated or incompletely described. The purpose of this study was to (1) develop a simple, reproducible method for production and purification of SG and RL2 and (2) compare their relative neurotoxicity using in vitro and in vivo models.
Materials and Methods
Chemicals and safety
HPLC-grade acetonitrile dichloromethane, ethyl acetate (EM, Gibbstown, NJ), water and formic acid (J.T. Baker, Phillipsburg, NJ) were used for extraction and purification. SG standard was obtained from B. Jarvis (University of Maryland, College Park). Unless noted, all other reagents were obtained from Sigma-Aldrich (St. Louis, MO). S. chartarum and PC-12 cultures were handled in separate Class 2B biohazard hoods dedicated to fungus and animal culture, respectively. S. chartarum culture extractions and subsequent fractionations were always conducted in a chemical fume hood. Contact with extracts and purified toxins was prevented by the use of solvent-resistant gloves. Contaminated glassware was soaked in 10% (v/v) bleach solution overnight before being washed (Thompson and Wannemacher, Jr. 1986).
Analytical high performance liquid chromatography (HPLC)
Analytical HPLC was used to monitor the presence of SG and RL2 at various stages of the purification. Samples were filtered through 0.2 µm organic solvent resistant filters (Alltech, Deerfield, IL) and 20 µl volumes injected onto an Econosil C18 (5 µ) column (250 mm × 4.6 mm) (Alltech, Deerfield, IL) using a mobile phase consisting of 25% (v/v) acetonitrile/water with 0.1% formic acid. A Shimadzu HPLC with a diode array detector (Columbia, MD) was programmed for 35 min total run time at a flow rate of 1.25 ml/min with acetonitrile concentrations increased from 25 to 80% (v/v). Toxin were determined from standard curves for SG and RL2 by using our own purified standards in which concentrations were calculated gravimetrically.
Toxin production and extraction
Stachybotrys chartarum strain 29-58-17 NIOSH was provided by J. Simpson (NIOSH, Morgantown, WV). Cultures were subjected to single-spore isolation and maintained on potato dextrose agar (PDA) (Becton, Dickinson and Co., Sparks, MD) at 25°C in the dark. Conidiospores were harvested from PDA cultures, suspended in 25% (v/v) glycerol in PBS (Sigma) at 2×10⁶ spores/ml and stored in −70°C prior to use in inoculation of rice production cultures.
Trichothecenes were produced on rice by a modification of previously described method (Jarvis et al. 1998; Hinkley and Jarvis 2001). Briefly, 250 g of rice (Uncle Ben’s Converted, Mars Inc, San Antonio, TX) was soaked in 250 ml distilled water for 2 hr in 2.8 L Fernbach flasks stoppered with foam plugs covered with aluminum foil. Flasks were autoclaved at 121°C twice for 1 hr. After cooling, flasks were inoculated with 5×10⁵ S. chartarum spores and incubated at 25°C in the dark for 4 to 6 weeks. Rice cultures were shaken thoroughly to break clumps daily and thereby ensure maximal growth and toxin production.
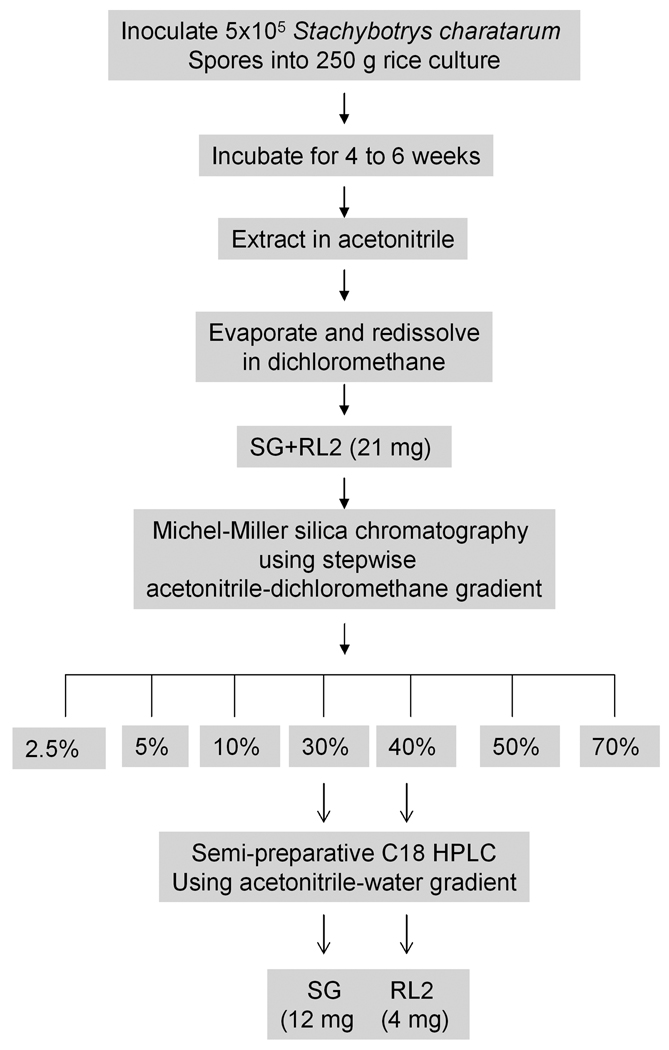
Following incubation, cultures were soaked in 1 L of acetonitrile overnight. The solvent was decanted and residual culture material washed with 500 mL of acetonitrile for an additional 10 min. Extracts were pooled, passed through cheesecloth and then vacuum-filtered twice through Whatman No. 5 paper (Fisher Scientific, Pittsburgh, PA). Solvent was removed under vacuum by rotary evaporation at 30°C. The resultant residue was dissolved in 500 ml dichloromethane by gently heating to 30°C and the solution passed through Whatman No.1 filter paper before evaporation to dryness. This residue was subjected to sequential Michel-Miller silica gel and C18 semi-preparative chromatography for the isolation on SG and RL2 as described below and summarized in Fig. 2.
Fig. 2. Protocol for isolation of SG and RL2.
An optimized procedure was developed for production of SG and RL2 on S. chartarum cultures and subsequent chromatographic purification. Toxin yields following each of the two chromatographic steps are representative of 5 separate purification runs.
Michel-Miller silica gel chromatography
Approximately 5 to 8 g of the crude extract was dissolved in 10 ml dichloromethane and subjected to Michel-Miller silica gel chromatography using a step-wise acetonitrile in dichloromethane gradient system. Briefly, the crude extract was placed on a loading column (Ace Glass, Vineland, NJ, 300 × 21 mm) containing 15 g silica (200–300 Mesh, Natland International, Research Triangle, NC) in dichloromethane attached to a purification column (450 × 40 mm, Ace Glass) containing 50 g of the same silica in dichloromethane. The extract was fractionated by sequential elution with 2.5 (1L), 5 (2L), 15 (2L), 30 (3L), 40 (2L), 50 (2L) and 70 (2L) % (v/v) acetonitrile in dichloromethane at a flow rate of about 10 ml/min using a low pressure chromatography pump (Fluid Metering Inc., Oyster Bay, NY) and LKB fraction collector (Ultrorac Type 7000, Lorton, VA). Eluted fractions were analyzed by HPLC and those containing SG and RL2 were pooled separately and evaporated to dryness by rotary evaporation.
Semi-preparative HPLC
Pooled fractions containing SG or RL2 were dissolved in acetonitrile at concentrations of approximately 5 mg/ml and 100 µl injection volumes subjected to semi-preparative HPLC on a Econosil C18 (10 µ) column (250 mm × 22 mm) (Alltech). Separation was carried out on a Shimadzu HPLC equipped with an automatic fraction collector. The column was eluted with acetonitrile/water mobile phase with 0.1% formic acid. The system was programmed for a 50 min total run time at a flow rate of 12 ml/min with acetonitrile concentrations increasing from 35 to 100% (v/v). SG and RL2 came off the column at 22.5 min with about 70% (v/v) acetonitrile. Resultant HPLC fractions were extracted with ethyl acetate and the extract evaporated to dryness in a rotary evaporator and SG and RL2 were then quantified by HPLC.
Mass spectroscopy
SG and RL2 were confirmed by electrospray ionization/collision-induced dissociation (ESI-CID) tandem mass spectroscopy at the Michigan Sate University mass spectrometry facility by a modification of a published method (Tuomi et al. 1998) using an LCQ-DECA device (Finnigan, San Jose, CA) fitted with an ESI probe.
PC-12 cell culture
PC-12, a pheochromocytoma neuronal cell line, was obtained from American Type Culture Collection (Manassas, VA). Cells were grown in 12-well or 96–well collagen-coated plates (BD Biosciences Pharmingen, San Diego, CA) in F-12K medium supplemented with 2.5% (v/v) fetal bovine serum, 15% (v/v) horse serum (Atlanta Biologicals, Lawrenceville, GA), 100 U/ml penicillin and 100 µg/ml streptomycin (Gibco BRL; Rockville, MD) at 37 °C with 6% CO2 (Islam et al., 2008). SG and RL2 were dissolved in pyrogen-free water (Sigma) prior to culture addition.
Alamar Blue cytotoxicity assay
Cytotoxicity was assessed using an Alamar Blue kit (Biosource International, Camarillo, CA). Alamar blue solution was added to culture suspension on 96-well plates, and after 6 hr incubation at 37°C under 6% CO2, absorbances at 570 nm and 600 nm were measured on a microplate reader (Synergy HT, Bio Tek Instruments, Inc., Winooski, VT). Cell viability was expressed as % inhibition as compared to vehicle treatment.
Flow cytometric measurement of apoptosis
Apoptosis induction was assayed by flow cytometry following propidium iodide (PI) staining (Islam et al. 2002). Cell cycle distribution for single cells was measured with a Becton Dickinson FACS Vantage (San Jose, CA). Data from 5,000 cells were collected in list mode. The 488 line of an argon laser was used to excite PI and fluorescence was detected at 615–645 nm. The cell cycle of individual cells was performed using doublet discrimination and a gate was selected to include hypofluorescent cells. Cells in the DNA histogram with hypofluorescent DNA were designated apoptotic. All other cells distributed themselves in a normal cell cycle profile.
DNA fragmentation assay
DNA fragmentation in PC-12 cells was confirmed by gel electrophoresis (Islam et al. 2002). Cells were harvested by scraping with a disposable cell lifter (Fisher Scientific), suspended in PBS, centrifuged for 10 min (250 × g) at 4°C and the pellet suspended in 0.1 ml hypotonic lysing buffer (10 mM Tris, pH 7.4, 10 mM EDTA, pH 8, 0.5% [v/v] Triton X-100). Cells were incubated for 10 min at 4°C and the resultant lysate was centrifuged for 30 min (13,000 × g) at 4°C. The supernatant, which contained fragmented DNA, was digested for 1 hr at 37°C with 0.4 µg/ml of RNase A (Roche, Indianapolis, IN) and then incubated 1 hr at 37°C with 0.4 µg/ml of proteinase K (Roche). DNA was precipitated with 50% (v/v) isopropanol in 0.5 M NaCl at −20°C overnight. The precipitate was centrifuged at 13,000 × g for 30 min at 4°C. The resultant pellet was air dried and resuspended in 10 mM Tris (pH 7.4), 1 mM EDTA (pH 8). An aliquot equivalent to 1× 10⁶ cells was electrophoresed at 70 V for 2 hr in 2% (w/v) agarose gel in 90 mM Tris–borate buffer containing 2 mM EDTA (pH 8.0). After electrophoresis, the gel was stained with ethidium bromide (0.5 µg/ml), and the nucleic acids were visualized with a UV transilluminator. A 100-bp DNA ladder (GIBCO-BRL, Rockville, MD) was used for molecular sizing.
Intranasal exposure in mice
Pathogen-free female B6C3F1 mice (8 weeks weighing 17–18 g, Charles River, Portage, MI) were randomly assigned to experimental groups (n=5) and housed in polycarbonate cages containing Cell-Sorb plus bedding (A & W Products, Cincinnati, OH) and covered with filter bonnets. Mice were provided free access to food and water. Room lights were set on a 12-hr light/dark cycle, and temperature and relative humidity were maintained between 21–24°C and 40–55% humidity, respectively. For intranasal treatment, mice were anesthetized with 4% halothane and 96% oxygen and then instilled intranasally with 50 µl/mouse with SG or RL2 at 100 µg/kg bw dissolved in a vehicle of pyrogen-free saline (Abbott Laboratories, IL) or with vehicle(s) alone. After 24 hr, mice were deeply anesthetized via i.p. injection of 0.1 ml of 12% (w/v) sodium pentobarbital and killed via exsanguination by cutting the abdominal aorta. Heads from each mouse were immediately removed and 1 ml of 10% (v/v) neutral buffered formalin (Fisher Scientific Co., Fairlawn, NJ) was flushed retrograde through the nasopharyngeal meatus. After the lower jaw, skin, muscles, eyes, and dorsal cranium were removed; the head with the intact brain was immersed and stored in a large volume of the fixative for at least 24 hr prior to further tissue processing.
Histopathology
After fixation, transverse tissue blocks from the head of these mice were selected for light microscopy as previously described (Islam et al. 2006). Prior to sectioning, the heads were decalcified in 13% (v/v) formic acid for 7 days and then rinsed in tap water for at least 4 hr. The nasal cavity of each mouse was transversely sectioned at 4 specific anatomic locations (Mery et al. 1994; Young 1981). The most proximal nasal section was taken immediately posterior to the upper incisor teeth (proximal, T1); the middle section was taken at the level of the incisive papilla of the hard palate (middle, T2); the third nasal section was taken at the level of the second palatal ridge (T3); and the most distal nasal section (T4) was taken at the level of the intersection of the hard and soft palate and through the proximal portion of the olfactory bulb (OB) of the brain. Tissue blocks were embedded in paraffin and the anterior face of each block was sectioned at a thickness of 5 µm, and stained with hematoxylin and eosin. Thickness of the olfactory epithelium (OE) lining the medial surface of the second ethmoid turbinates (2E) and volume density of apoptotic nuclei within the OE in T3 were morphometrically evaluated as previously described (Islam et al. 2006).
Statistics
Data were statistically analyzed with SigmaStat v 3.1 (Jandel Scientific, San Rafael, CA) with the criterion for significance set at p < 0.05 using one-way ANOVA with Student-Newman-Keuls or Dunnett’s post-test.
Results
Production and Isolation of Trichothecenes from S. chartarum
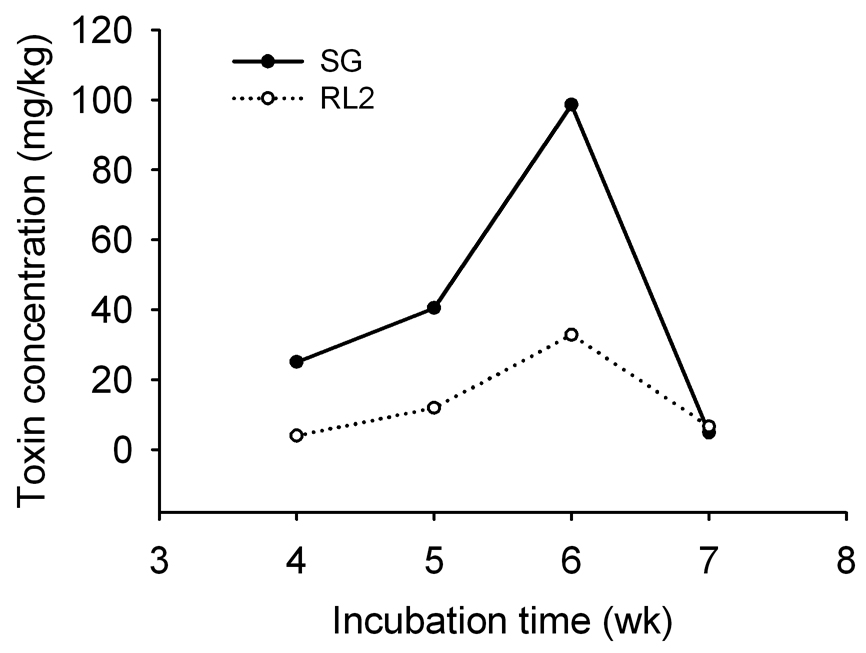
A protocol for production and isolation of SG and RL2 from S. chartarum cultures was optimized relative to inoculum and kinetics of production (Fig. 2). Maximum growth of S. chartarum and toxin production on rice in Fernbach flasks occurred using a spore inoculum of 5×10⁵ spores/250g rice whereas less growth and toxin production was observable using lower or higher spore loads. Peak fungal growth was observed after 4 to 6 weeks of incubation, which corresponded to maximal production of SG and RL2 (Fig 3). SG was markededly reduced at 7 weeks possibly due to degradation or further metabolism by the fungus.
Fig. 3. Kinetics of SG and RL2 production in rice cultures.
S. chartarum was grown in duplicate on rice for various time intervals, extracted with acetonitrile and subjected to Michel-Miller silica gel chromatography fractions. The 30 and 40% (v/v) acetonitrile/dichloromethane fractions which contained SG and RL2, respectively, were individually pooled and analyzed by HPLC.
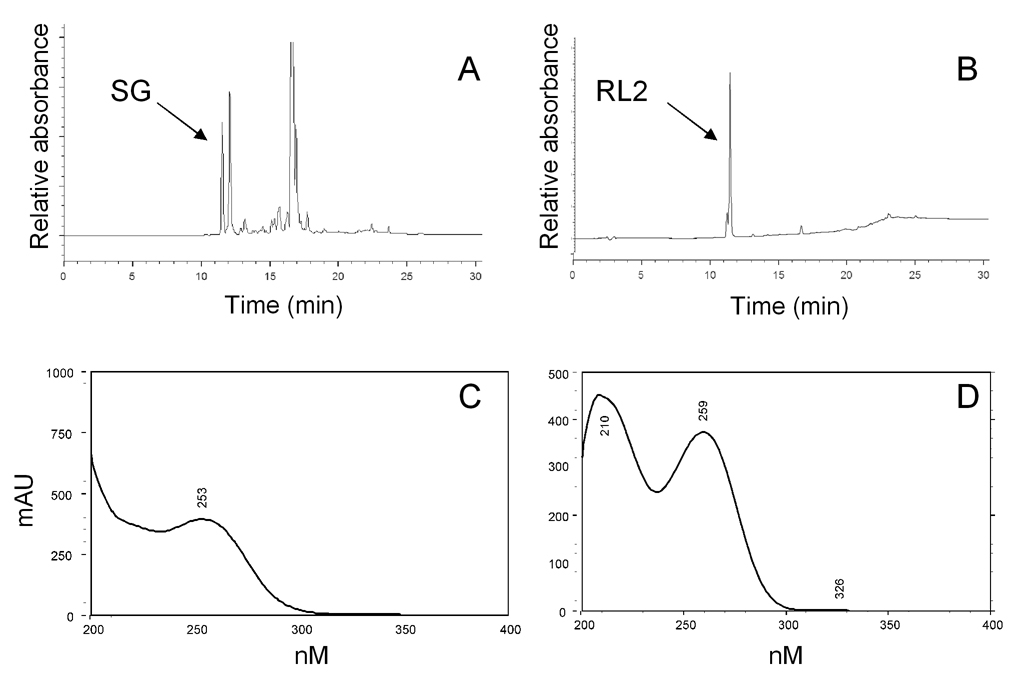
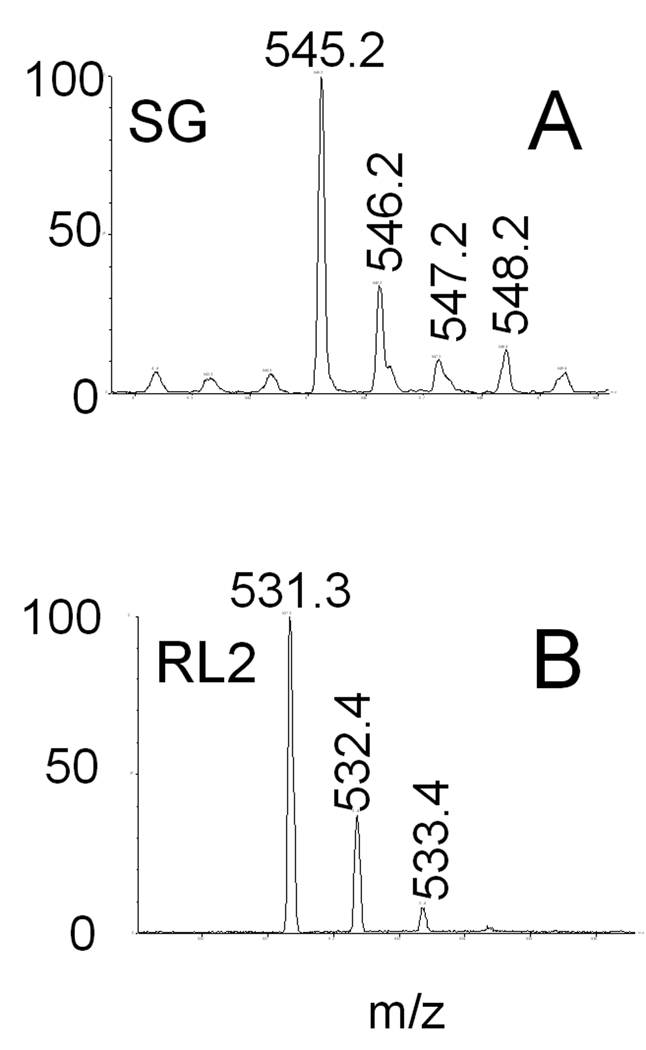
Absorbance peaks for SG and RL2 overlapped at approximately 11.5 min during C-18 reverse phase analytical HPLC. These two compounds could be resolved by Michel-Miller chromatography with SG and RL2 being detectable in the 30% (v/v) (Fig 4A) and 40% (v/v) (Fig 4B) acetonitrile in dichloromethane fractions, respectively, both of which yielded characteristic UV absorption spectra (Fig. 4C,D). Subsequent C-18 reverse phase semi-preparative chromatography yielded highly purified (>95%) SG and RL2 as indicated by (ESI-CID) tandem mass spectroscopy (Fig. 5). In a representative production run, 21 mg of SG+RL2 were produced in a single 250 g rice culture (Fig. 2). Following silica gel and C18 chromatography, 12 mg of SG and 4 mg of RL2 were obtained, respectively.
Fig. 4. Purification of SG and RL2.
High performance liquid chromatograms of crude semipurified SG (A) and RL2 (B) in 30 or 40% (v/v) acetonitrile fraction, respectively, obtained during Michel-Miller silica gel chromatography. UV scan of SG (C) and RL2 (D).
Fig. 5. MS verification of purified SG and RL2.
MS verification of purified SG and RL2. Mass-spectroscopic chromatograms of purified toxins with representative molecular weights indicative of SG (A) and RL2 (B) as described by Hinkley and Jarvis (2001).”
In Vitro Cytotoxicity
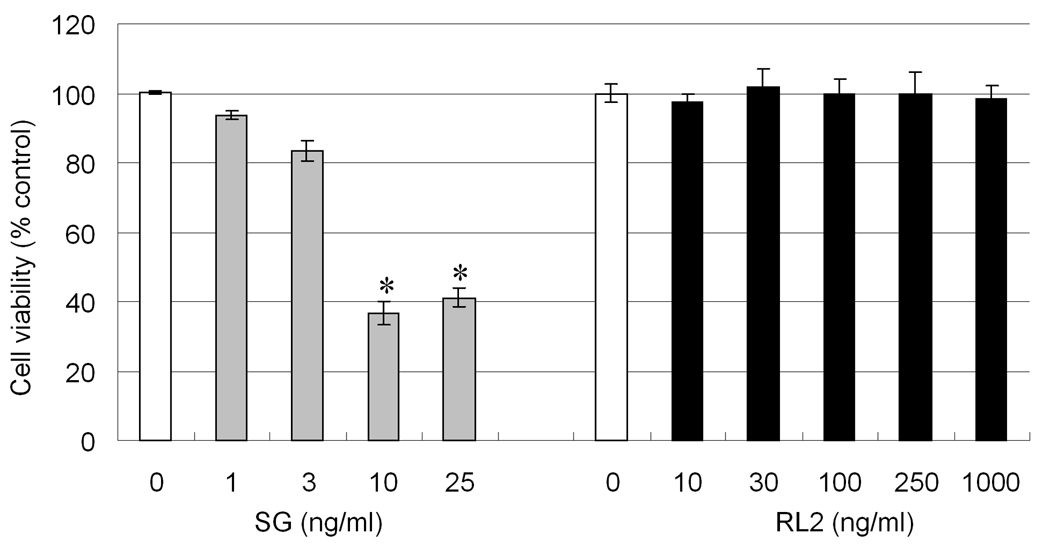
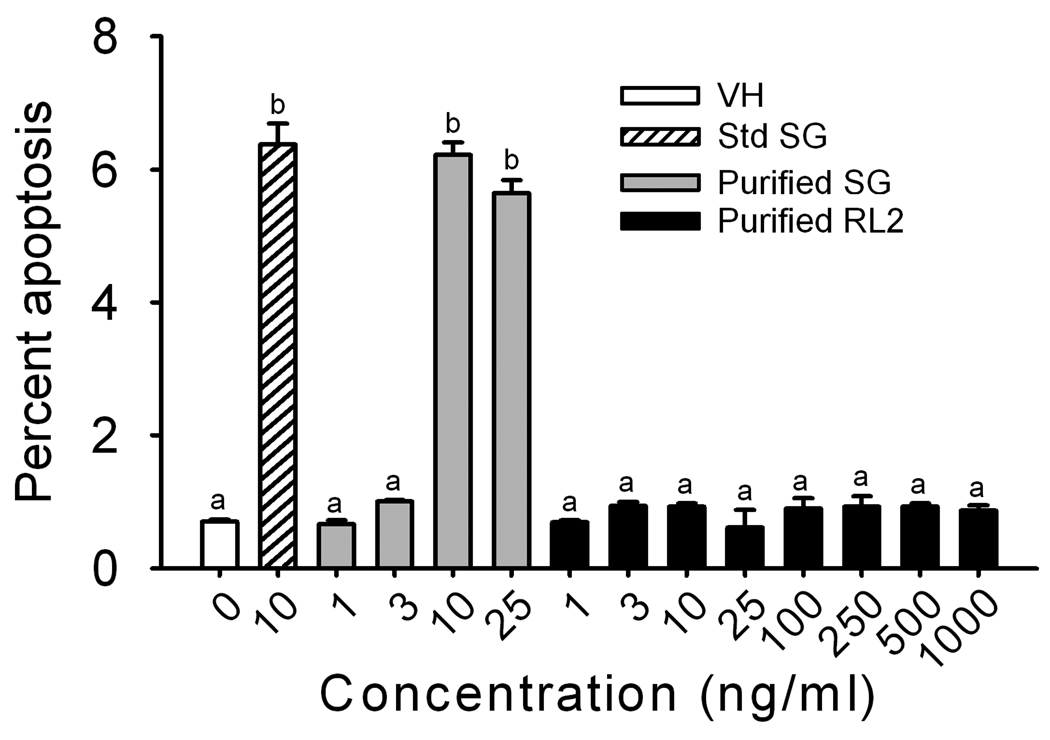
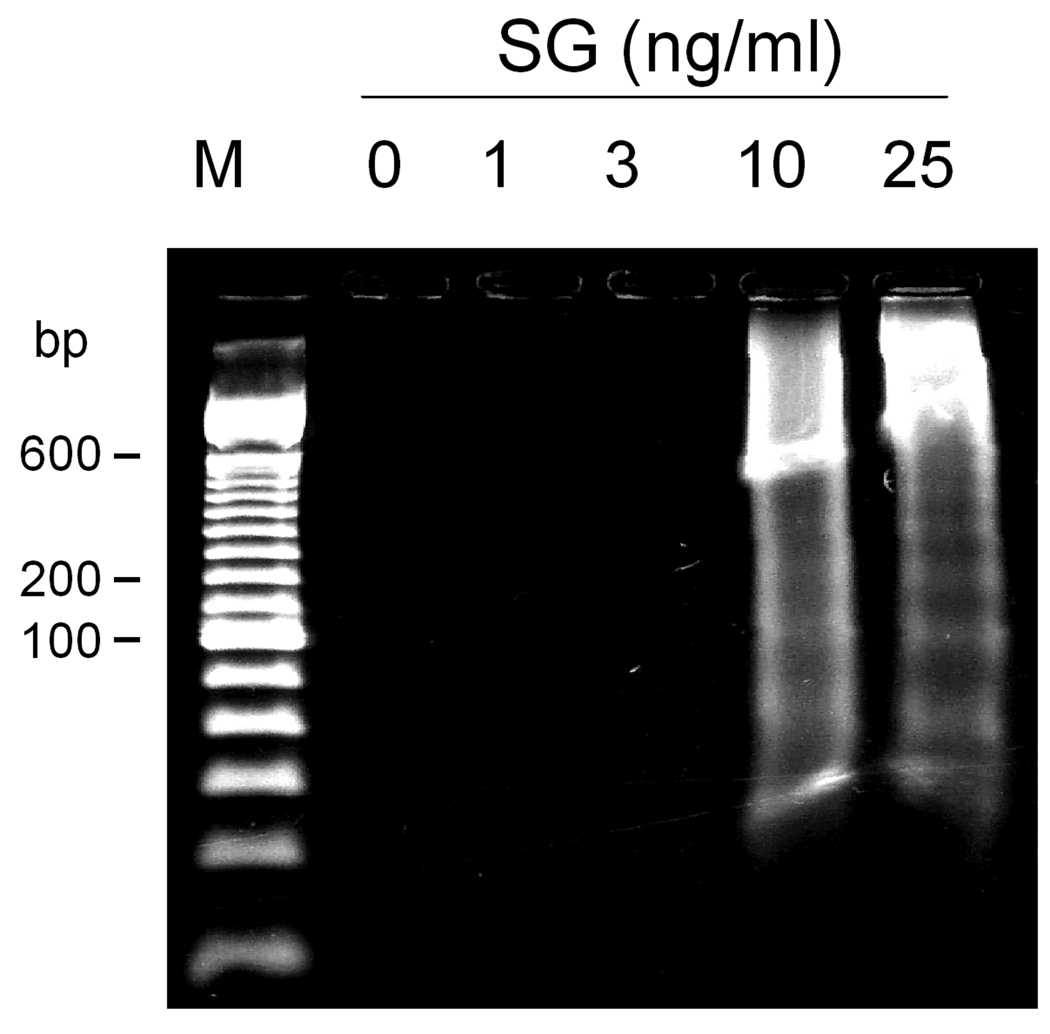
The cytotoxicities of purified SG and RL2 were compared in the PC-12 neuronal cell line. Viability decreased significantly in cells treated with 10 to 25 ng/ml of SG for 48 hr, however, RL2 at concentrations up to 1000 ng/ml were not toxic (Fig. 6). Flow cytometry revealed that SG (10 and 25 ng/ml) induced apoptosis at 48 hr, but that RL2 from 1 to 1000 ng/ml did not produce this effect (Fig. 7). Agarose gel electrophoresis confirmed that exposure to SG at 10 and 25 ng/ml for 48 hr induced DNA fragmentation characteristic of apoptosis (Fig. 8) whereas RL2 exerted no effect (data not shown). The results of all three methods suggested the SG evoked very steep concentration-dependent dependent death curves.
Fig. 6. Cytotoxicity of SG and RL2.
PC-12 cells were incubated with various concentrations of SG or RL2 for 48 hr. Viability was measured by Alamar Blue assay and expressed as % maximum response for control cultures. Data are +/− SEM (n=4). Asterisk indicates significantly different from the vehicle control (p< 0.05).
Fig. 7. Flow cytometric measurement of SG-induced apoptosis in PC-12 cells.
Cells were incubated with various concentrations of SG or RL2 for 48 hr. Flow cytometry was used to measure DNA hypofluorescence indicative of apoptosis. Bars without the same letters are significantly different (p< 0.05).
Fig. 8. SG-induced DNA fragmentation in PC-12 cells.
Cells were incubated with SG as described in Fig. 7 and then analyzed for fragmented DNA by agarose gel electrophoresis.
Nasal Histopathology
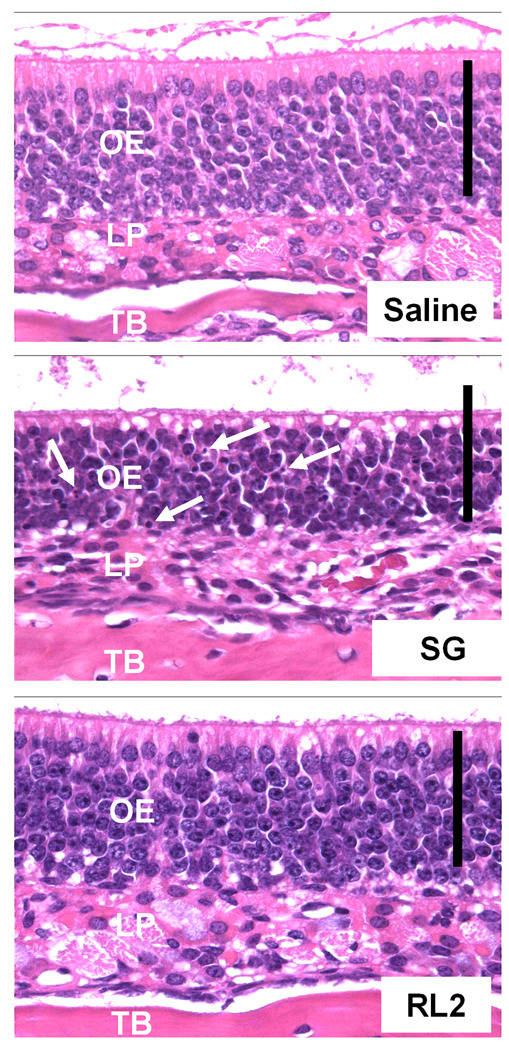
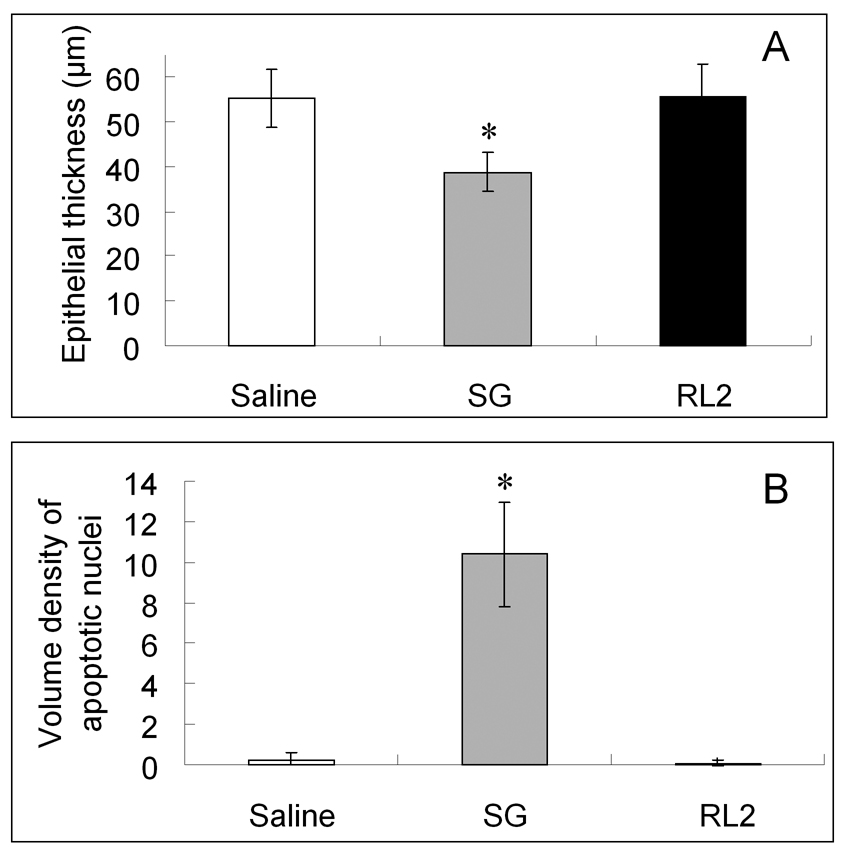
The effects of intranasal exposure of mice to SG and RL2 at equivalent doses (100 µg/kg bw) were compared by morphologic and morphometric examination of the OE lining the nasal airways. Compared to mice intranasally instilled with saline (vehicle) alone, mice instilled with SG had marked apoptosis of olfactory sensory neurons and atrophy of OE that was most evident in the nasal mucosa lining the ethmoid turbinates 1–6 (1E–6E) and the midseptum in the T3 section. Mice instilled with RL2 had no microscopically detectable nasal lesions and were histologically similar to that of saline-control mice. Figure 9 illustrates the differences in nasal histopathology among the three groups of mice. Results of the morphometric analysis of OE lining the medial aspect of the second ethmoid turbinates (2E) indicated that there was a 30 % reduction in epithelial thickness in SG-instilled mice compared to that of control (Fig 10A). Volume density of apoptotic nuclei within the OE was remarkably increased in SG-treated mice as compared to controls (Fig 10B). In addition to the loss of nuclear and cytoplasmic profiles of OSN, their ciliated dendritic knobs that contain the animal's odorant receptors and normally project above the microvillar apical surfaces of the sustentacular cells were vaculated and shrunken by SG (Fig. 9). Exposure to RL2 at an equivalent dose resulted in no detectable quantitative changes in epithelial thickness or volume density of apoptotic nuclei as compared to the saline-instilled controls.
Fig. 9. Nasal histopathology in the nose of the B6C3F1 mouse after intranasal exposure to SG and RL2.
Light photomicrographs of olfactory epithelium (OE) lining medial surface of ethmoid turbinate 2 in the T3 nasal section of mice instilled with saline (vehicle) alone, SG 100 µg/kg bw, or RL2 100 µg/kg bw. Mice were sacrificed 24 hours after a single intranasal instillation. No treatment related histologic alterations are evident in the OE of the saline-control mouse or the RL2-instilled mouse. In contrast, there is conspicuous atrophy of OE with numerous widely scattered pyknotic nuclei and apoptotic bodies (arrows) restricted to the middle nuclear layer (cell bodies of olfactory sensory neurons) from the mouse instilled with SG. The apical nuclear layer (sustentacular cell nuclei) and the basal cell layer of OE in this SG-treated mouse are unaffected. All tissues were stained with hematoxylin and eosin. OE: olfactory epithelium, LP: lamina propria, TB: turbinate bone. Scale bar, 50 microns.
Fig. 10. Morphometric analysis of the nose of the B6C3F1 mouse after intranasal exposure to SG and RL2.
Epithelial thickness (A) and volume density of apoptotic nuclei (B) in OE at 24 hr after a single instillation with saline, SG 100 µg/kg or RL2 100 µg/kg bw. Data are mean +/− SEM (n=5). Asterisk indicates significantly different from the vehicle control (p< 0.05).
Discussion
Damp building-related illnesses include a number of respiratory, immunologic and neurologic symptoms that are often etiologically linked to aberrant growth of Stachybotrys chartarum. Experimental rodent studies revealed that, while this fungus is not infectious, airway exposure to spores of S. chartarum or its components have the potential to evoke toxicity, inflammation and allergic sensitization in the upper and lower respiratory tracts (Pestka et al. 2008). The trichothecenes might be an underlying cause for one or more of these adverse effects. Some macrocyclic trichothecenes are neurotoxic and may selectively induce apoptosis in olfactory sensory neurons in the nose and brain (Islam et al. 2006;2007); however, the mechanisms are unknown. The results presented herein describe a simple and straightforward strategy for production and purification of the macrocylic trichothecene SG and its putative trichothecene precursor RL2 from S. chartarum cultures suitable for studies of neurotoxic mechanisms.
It was further demonstrated here, for the first time, that RL2 possesses little in vitro or in vivo toxic activity as compared to SG. A major difference between SG and RL2 is that the former has an intact cyclic ester rings that link C-4 to C-15 whereas the latter compound has an extended carbon chain at C-4 but no substituent at C-15 (Fig. 1). These differences might impact the capacities of RL2 to diffuse through the cell membrane and/or bind to the ribosome. Our findings suggest that the presence of RL2 in environmental samples might have little potential to adversely impact health as compared to SG.
It should be noted that while SG and RL2 are commonly found in S. chartarum isolates of the trichothecene chemotype, this fungus is capable of producing other macrocyclic trichothecenes such as satratoxin H and isosatratoxin F (Andersen et al. 2002;Hinkley and Jarvis 2001;Nielsen et al. 2002). The relative profile of these toxins in a culture or in an environmental setting will depend on factors such as temperature, water activity, substrate and presence of other microorganisms. The procedures described here might be similarly applicable to the isolation of these other trichothecenes to assess their potential to produce adverse neurologic, immunologic and respiratory effects in cellular and animal models.
Acknowledgments
This research was funded by the Michigan State University Respiratory Research Initiative, Michigan State University Foundation Strategic Partnership Grant and Public Health Service Grant ES03358 (JJP) from the National Institute for Environmental Health Sciences. We thank Evelyne Mbandi, Lijun Chen, Lori Bramble, Sarah Godbehere and Mary Rosner. Animal studies were conducted in accordance with National Institutes of Health guidelines as overseen by the All University Committee on Animal Use and Care at Michigan State University.
REFERENCES
- Andersen B, Nielsen KF, Jarvis BB. Characterization of Stachybotrys from water-damaged buildings based on meorphology, growth, and metabolite production. Mycologia. 2002;94:392–403. [PubMed] [Google Scholar]
- Bamburg JR. Biological and biochemical actions of trichothecene mycotoxins. Prog. Mol. Subcell. Biol. 1983;8:41–110. [Google Scholar]
- Brasel TL, Martin JM, Carriker CG, Wilson SC, Straus DC. Detection of airborne Stachybotrys chartarum macrocyclic trichothecene mycotoxins in the indoor environment. Appl Environ Microbiol. 2005;71:7376–7388. doi: 10.1128/AEM.71.11.7376-7388.2005. [DOI] [PMC free article] [PubMed] [Google Scholar]
- Chung YJ, Zhou HR, Pestka JJ. Transcriptional and posttranscriptional roles for p38 mitogen-activated protein kinase in upregulation of TNF-alpha exp ression by deoxynivalenol (vomitoxin) Toxicol. Appl. Pharmacol. 2003;193:188–201. doi: 10.1016/s0041-008x(03)00299-0. [DOI] [PubMed] [Google Scholar]
- Demarquay G, Ryviln P, Royet JP. Olfaction and neurological diseases: a review of the literature. Rev. Neurol. 2007;163:155–167. doi: 10.1016/s0035-3787(07)90387-2. [DOI] [PubMed] [Google Scholar]
- Grove JF. Macrocyclic trichothecenes. Nat. Prod. Rep. 1993;10:429–448. doi: 10.1039/np9880500187. [DOI] [PubMed] [Google Scholar]
- Grove JF. Non-macrocyclic trichothecenes. Nat. Prod. Rep. 1988;5:187–209. doi: 10.1039/np9880500187. [DOI] [PubMed] [Google Scholar]
- Grove JF. Non-macrocyclic trichothecenes. Part 2. Prod. Chem. Org. Nat. Prod. 2000;69:1–70. doi: 10.1039/np9880500187. [DOI] [PubMed] [Google Scholar]
- Grove JF. The trichothecenes and their biosyn thesis. Fortschr. Chem. Org. Naturst. 2007;88:63–130. [PubMed] [Google Scholar]
- Hawkes C. Olfaction in neurodegenerative disorders. Movement Disorders. 2003;18:364–372. doi: 10.1002/mds.10379. [DOI] [PubMed] [Google Scholar]
- Hinkley SF, Jarvis BB. Chromatographic method for Stachybotrys toxins. Meth. Mol. Biol. 2001;157:173–194. [PubMed] [Google Scholar]
- Institute of Medicine. Damp Indoor Spaces and Health. Washington, D.C: National Academies Press; 2004. [PubMed] [Google Scholar]
- Islam Z, Amuzie CJ, Harkema JR, Pestka JJ. Neurotoxicity and inflammation in the nasal airways of mice exposed to the macrocyclic trichothecene mycotoxin roridin A: Kinetics and potentiation by bacterial lipopolysaccharide co-exposure. Toxicol. Sci. 2007;98:526–541. doi: 10.1093/toxsci/kfm102. [DOI] [PubMed] [Google Scholar]
- Islam Z, Harkema JR, Pestka JJ. Satratoxin G from the black mold Stachybotrys chartarum evokes olfactory sensory neuron loss and inflammation in the murine nose and brain. Environ. Health Persp. 2006;114:1099–1107. doi: 10.1289/ehp.8854. [DOI] [PMC free article] [PubMed] [Google Scholar]
- Islam Z, Hegg CC, Pestka JJ. Satratoxin G-induced apoptosis in PC-12 neuronal cells is mediated by PKR and caspase-independent. Toxicol Sci. 2008;105:142–152. doi: 10.1093/toxsci/kfn110. [DOI] [PMC free article] [PubMed] [Google Scholar]
- Islam Z, Moon YS, Zhou HR, King LE, Fraker PJ, Pestka JJ. Endotoxin potentiation of trichothecene-induced lymphocyte apoptosis is mediated by up-regulation of glucocorticoids. Toxicol. Appl. Pharmacol. 2002;180:43–55. doi: 10.1006/taap.2002.9374. [DOI] [PubMed] [Google Scholar]
- Jarvis BB, Sorenson WG, Hintikka EL, Nikulin M, Zhou Y, Jiang J, Wang S, Hinkley S, Etzel RA, Dearborn D. Study of toxin production by isolates of Stachybotrys chartarum and Memnoniella echinata isolated during a study of pulmonary hemosiderosis in infants. Appl. Environ. Microbiol. 1998;64:3620–3625. doi: 10.1128/aem.64.10.3620-3625.1998. [DOI] [PMC free article] [PubMed] [Google Scholar]
- Mery S, Gross EA, Joyner DR, Godo M, Morgan KT. Nasal diagrams: a tool for recording the distribution of nasal lesions in rats and mice. Toxicol. Pathol. 1994;22:353–372. doi: 10.1177/019262339402200402. [DOI] [PubMed] [Google Scholar]
- Nielsen FK. PhD Thesis Technical University of Denmark. 2002. Mold growth on building materials. Secondary metabolites, mycotoxins and biomarkers. http://www.sbi.dk/download/pdf/phd_kfn.pdf. [Google Scholar]
- Nielsen KF, Huttunen K, Hyvarinen A, Andersen B, Jarvis BB, Hirvonen MR. Metabolite profiles of Stachybotrys isolates from water-damaged buildings and their induction of inflammatory mediators and cytotoxicity in macrophages. Mycopathologia. 2002;154:201–205. doi: 10.1023/a:1016383402963. [DOI] [PubMed] [Google Scholar]
- Pestka JJ. Mechanisms of deoxynivalenol-induced gene expression and apoptosis. Food. Addit. Contam. 2008;24:1–13. doi: 10.1080/02652030802056626. [DOI] [PMC free article] [PubMed] [Google Scholar]
- Pestka JJ, Forsell JH. Inhibition of human lymphocyte transformation by the macrocyclic trichothecenes roridin A and verrucarin A. Toxicol. Lett. 1988;41:215–222. doi: 10.1016/0378-4274(88)90057-4. [DOI] [PubMed] [Google Scholar]
- Pestka JJ, Yike I, Dearborn DG, Ward MD, Harkema JR. Stachybotrys chartarum, trichothecene mycotoxins, and damp building-related illness: new insights into a public health enigma. Toxicol. Sci. 2008;104:4–26. doi: 10.1093/toxsci/kfm284. [DOI] [PubMed] [Google Scholar]
- Schneider DJ, Marasas WF, le Kuys JC, Kriek NP, Van Schalkwyk GC. A field outbreak of suspected stachybotryotoxicosis in sheep. J. S. Afr. Vet. Assoc. 1979;50:73–81. [PubMed] [Google Scholar]
- Takeda A, Kikuchi A, Matsuzaki-Kobayashi M, Sugeno N, Itoyama Y. Olfactory dysfunction in Parkinson's disease. J. Neurol. 2007;254:2–7. [Google Scholar]
- Thompson WL, Wannemacher RW., Jr Structure-function relationships of 12,13-epoxytrichothecene mycotoxins in cell culture: comparison to whole animal lethality. Toxicon. 1986;24:985–994. doi: 10.1016/0041-0101(86)90004-8. [DOI] [PubMed] [Google Scholar]
- Tuomi T, Saarinen L, Reijula K. Detection of polar and macrocyclic trichothecene mycotoxins from indoor environments. Analyst. 1998;123:1835–1841. doi: 10.1039/a803813i. [DOI] [PubMed] [Google Scholar]
- Ueno Y. Toxicological features of T-2 toxin and related trichothecenes. Fundam. Appl. Toxicol. 1984;4:S124–S132. doi: 10.1016/0272-0590(84)90144-1. [DOI] [PubMed] [Google Scholar]
- Wong SS, Zhou HR, Marin-Martinez ML, Brooks K, Pestka JJ. Modulation of IL-1beta, IL-6 and TNF-alpha secretion and mRNA expression by the trichothecene vomitoxin in the RAW 264.7 murine macrophage cell line. Food Chem. Toxicol. 1998;36:409–419. doi: 10.1016/s0278-6915(97)00167-1. [DOI] [PubMed] [Google Scholar]
- Young JT. Histopathologic examination of the rat nasal cavity. Fundam. Appl. Toxicol. 1981;1:309–312. doi: 10.1016/s0272-0590(81)80037-1. [DOI] [PubMed] [Google Scholar]
- Zhou HR, Islam Z, Pestka JJ. Induction of competing apoptotic and survival signaling pathways in the macrophage by the ribotoxic trichothecene deoxynivalenol. Toxicol. Sci. 2005;87:113–122. doi: 10.1093/toxsci/kfi234. [DOI] [PubMed] [Google Scholar]


