Abstract
The effects of ultraviolet (UV) radiation on ionizing radiation biodosimetry were studied in human tooth enamel samples using the technique of electron paramagnetic resonance (EPR) in X-band. For samples in the form of grains, UV-specific EPR spectra were spectrally distinct from that produced by exposure to gamma radiation. From larger enamel samples, the UV penetration depth was determined to be in the 60–120 μm range. The difference in EPR spectra from UV exposure and from exposure to gamma radiation samples was found to be a useful marker of UV equivalent dose (defined as the apparent contribution to the gamma dose in mGy that results from UV radiation absorption) in tooth enamel. This concept was preliminarily tested on front teeth from inhabitants of the region of the Semipalatinsk Nuclear Test Site (Kazakhstan) who might have received some exposure to gamma radiation from the nuclear tests conducted there as well as from normal UV radiation in sunlight. The technique developed here to quantify and subtract the UV contribution to the measured tooth is currently limited to cumulative dose measurements with a component of UV equivalent dose equal to or greater than 300 mGy.
Keywords: EPR dosimetry, light exposure, UV equivalent dose, front teeth
INTRODUCTION
The literature shows a general consensus in recommending against the use of front teeth for retrospective assessment of exposure to ionizing radiation when using the technique of electron paramagnetic resonance (EPR) (Chumak et al. 1999; Nilsson et al. 2001; IAEA 2002). The reason for this precautionary recommendation is that typical front teeth have likely been exposed to ultraviolet (UV). Solar radiation can produce paramagnetic centers that can confound the interpretation of the EPR spectra induced by ionizing radiation. For these studies, the term “UV equivalent dose” is introduced to quantify the UV radiation absorption in tooth enamel samples using well-known anisotropic EPR signal at g⊥= 2.0018, g|| = 1.9985 (hereinafter dosimetric signal or DS), which may be produced by both gamma and UV radiation (Sholom et al. 1998). UV equivalent dose of some sample is numerically equal to the 60Co absorbed dose, which is required to produce the same DS in the sample as UV radiation did.
It was claimed by Liidja et al. (1996) that paramagnetic centers produced by solar UV radiation exposure are spectroscopically indistinguishable from those generated by exposure to gamma radiation. That study asserted that, as a maximum, an EPR signal indicative of 10 mGy could be produced per hour of exposure of 0.1–0.25 mm enamel grains to solar UV.
In related studies, Sholom et al. (1998) made empirical measurements of the UV equivalent dose rate due from solar radiation on grained tooth enamel samples exposed to sunlight during several days in Salt Lake City, USA. The UV equivalent dose was approximately 200 mGy per sunny day (or 25 mGy per hour taking into account that exposure time was in average 8 hours per day). A similar value (19.6 mGy per hour) was found by Jiao et al. (2007) for tooth samples exposed in Hiroshima, Japan. Those measurements demonstrated that exposure to solar UV radiation can pose significant problems to estimating ionizing radiation dose by the EPR method.
Previously, Sholom et al. (2002) proposed to use only the lingual (inside to mouth) side of front teeth to eliminate any signal induced by exposure to UV, however, there may still be some residual UV effect that is not eliminated (Sholom et al. 2002). For that reason, this work was undertaken to develop a more reliable method for using front teeth for the assessment of exposure to ionizing radiation that is based on the separation of the relative contributions from gamma and UV exposure by their individual EPR spectral characteristics. In similar work, El-Faramawy (2005) found that spectra of enamel samples exposed either to gamma and UV radiation were spectroscopically different as measured by EPR. Based on those findings, El-Faramawy (2005) proposed a method to use the ratio of the native EPR signal intensities to estimate the UV signal contribution to the measured cumulative dose. The drawback of that method is the strong instability of the native UV-generated EPR signals. Vorona et al. (2007) used a different approach to account for UV exposure in which the angular dependences of the EPR spectra for large single rectangular slabs or plates of tooth enamel were used to separate gamma doses and UV equivalent doses. They demonstrated that the magnitude of the EPR signal anisotropy in enamel plates depends strongly on the type of radiation. However, it was not demonstrated that the anisotropy method had the sensitivity required for radiation accident biodosimetry as the UV equivalent and ionizing radiation doses used were hundreds of Gy and greater (Vorona et al. 2007).
In another previous study, Sholom et al. (1998) demonstrated that the EPR spectra from tooth enamel samples exposed to gamma and solar radiation have different spectral shapes. Sholom et al. (1998) proposed that this difference, particularly at the EPR spectroscopic g-factor values of 2.0110 and 2.0052, has the potential to serve as a basis for the separation of the UV contribution to the cumulative dose. This approach was recently confirmed by Jiao et al. (2007) who also considered the above mentioned signals as possible indicators of UV exposure.
Our work characterizes the differences between the EPR spectra resulting from exposure to gamma radiation and UV radiation. For the spectral analysis and isolation of the separate signals, the procedure of Sholom and Chumak (2003) was used since it is an established method for the estimation of intensities of strongly overlapping EPR lines. On the basis of measurements of specific differences in the gamma and UV radiation spectra, a technique is proposed for assessing the gamma ionizing radiation absorbed dose to front teeth. This work includes tests of the technique on front teeth from several residents of the region near to the Semipalatinsk Nuclear Test Site in Kazakhstan.
MATERIALS AND METHODS
The tooth enamel samples were prepared and irradiated according to specific protocols as described here:
- The enamel from nine different teeth was mechanically isolated for each tooth, then crushed and sieved to different fractions; aliquots with the size fraction range of 630–850 μm and the weight range of 55–60 mg were used for multiple exposure by the UV source to the maximal value of UV equivalent dose of 9.6 Gy with intermediate values of 0.71, 1.4, 2.1, 2.8 and 4.3 Gy.
- The set of calibration samples was prepared from pooled crushed enamel. 20 samples of this set were used for gamma exposure to doses 0.1, 0.25, 1 and 10 Gy, 5 samples per each dose; 5 samples were left unexposed. All samples were in the weight range of 80–85 mg.
- Plates of enamel from different teeth were used to study the angular dependencies of the dosimetric signal and UV-visible light penetration depth. Eighteen plates were cut from tooth surfaces using low speed diamond saw followed by polishing with diamond whetstones in a progression of increasing fineness (Diamond Machining Technology, USA)**. The final thickness of the enamel plates was measured with Fowler electronic digital caliper (Fowler, USA)and was in the range 0.41–1.79 mm (accuracy of the caliper was 0.02 mm). The thickness was measured for 3 different points of every plate; only plates with thickness inhomogeneity within 0.05 mm (altogether 5 samples) were used in the UV-visible light penetration depth study.
- Eight front teeth from Semipalatinsk area inhabitants were used to test the technique developed here. Enamel from these teeth was mechanically isolated separately for lingual and buccal parts of teeth. The weight of obtained samples was in the range 21–95 mg.
Hard-alloyed dental burs of different sizes were used for mechanical isolation of enamel to assure the careful removing of dentine without any significant influence on enamel.
All teeth, excluding samples obtained from the Semipalatinsk area, were obtained from persons of 18–25 years age. Those teeth were assumed to be not irradiated to gamma and UV radiation in the past; this was confirmed by checking of their initial EPR spectra.
The following experiments were conducted.
- Enamel grain samples: (1) A comparison of spectra for UV and gamma exposure at the same spectrometer parameters was done for 9 UV exposed samples (different UV equivalent doses were investigated) and for calibration samples exposed to different values of gamma dose. (2) A comparison of microwave power saturation curves for dosimetric signals produced by two radiation types was done involving 6 samples: 3 exposed to 9.6 Gy of UV equivalent dose and 3 to 10 Gy of gamma dose. These measurements are designed to address the existing contradiction between Jiao et al. (2007) and Vorona et al. (2007) concerning saturation curves for dosimetric signals in samples exposed to UV and gamma radiation.
- Enamel plate samples: (3) The angular dependencies of the dosimetric EPR signal in UV and gamma exposed samples in the dose range below 10 Gy was investigated using 6 enamel plates with the thickness in the range 0.74–1.35 mm: 3 exposed to 10 Gy of gamma dose and 3 to 17.5 h on the UV source (the obtained values of UV equivalent doses were 7.3, 8.2 and 9.7 Gy due to difference in plate thickness). Plates were rotated in the same plane as in Vorona et al. (2007); the angle increment was 9 degrees; total number of angles was 40 which corresponds to 360 degrees of rotation; (4) transmittance of tooth enamel in the UV-visible spectrum. This experiment exploited already mentioned 5 plates with thickness inhomogeneity within 0.05 mm. Transmittance of the UV-visible light was directly measured with a Cary 300 spectrophotometer (Varian, USA) in the wavelength range of 280–600 nm with data interval of 5 nm, and then converted to values of penetration depth. This work expands on previous studies (Ivannikov et al. 1997, Sholom et al. 1998, Fattibene et al. 1998).
The tooth enamel samples were irradiated with gamma and UV radiation at facilities of the National Institute of Standards and Technology (NIST). Both the gamma and UV source are calibrated and traceable to their respective national standards. A vertical beam 60Co gamma source (48 TBq or 1.3 kCi) was used for the gamma irradiations. At the NIST, a 2 m spherical integrating UV light source had previously been built to simulate solar exposure of building materials studies. That source was used in this work for UV irradiations to provide collimated ultraviolet radiation in the 290 nm to 400 nm region of the spectrum. Visible and infrared components of the UV radiation were largely removed by dichroic mirrors or filters. The unfiltered spectrum of this UV source is shown in Fig. 1; its total irradiance is 39.4 W m−2, the contribution from the UV part of the spectrum (290–400 nm) is 23.1 W m−2. Because the exposure required samples to be mounted vertically (the light source produced a horizontal beam), special sample holders were constructed. Tooth enamel samples were mounted in single layer geometry using thin heavy-duty plastic film to maintain the grain orientation for the duration of the UV exposure. Absorption of the UV light by the film was measured with a Cary 300 spectrophotometer and was approximately 20% over the entire UV range. After each exposure session, but prior to the EPR measurements, the enamel samples were annealed at 95°C for 2 h to remove short-lived signals.
Figure 1.
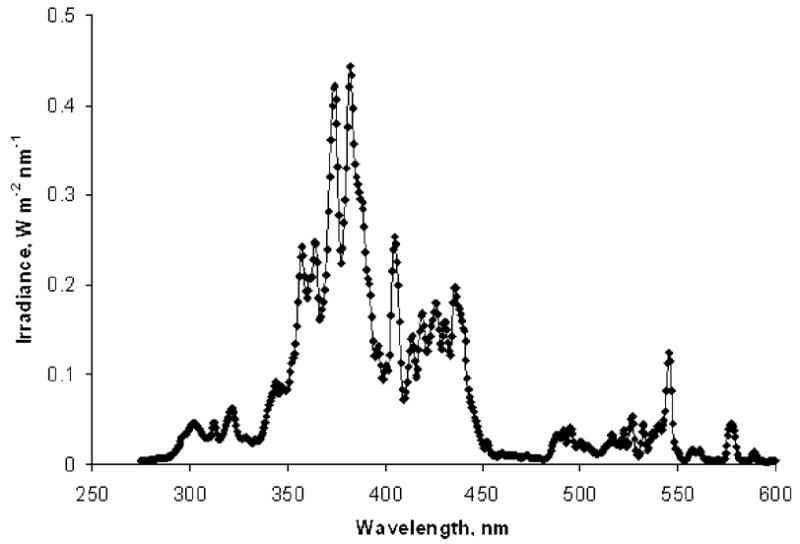
The UV light source spectrum used to expose of the enamel samples.
EPR spectrum recording procedures
All EPR measurements were performed with an Elexsys E500 EPR spectrometer (Bruker, Germany) in use at NIST equipped with a cylindrical HQ4119 resonator. The spectral recording parameters were: microwave power 12.7 mW; field sweep 10 mT; modulation amplitude 0.4 mT; conversion time 20 ms; time constant 20 ms. The spectra were recorded at different angles with the aid of an automated goniometer.
Spectra analysis
All spectral fitting and analysis was done with MatLab software (MathWorks, USA) according to the methods of Sholom and Chumak (2003). The EPR spectra from gamma-irradiated (10 Gy) and unexposed samples were used to produce the reference standards for the dosimetric and native signals, respectively.
Limit of detection and accuracy of the dosimetric signal measurement were determined from another experiment and were 50 mGy and ±25 mGy (1 σ) for the 100-mg sample. The limit of detection for the R1 signal used in the present work for determination of the UV equivalent dose was estimated through comparison of its radiation sensitivity with radiation sensitivity of the dosimetric signal for the same samples.
RESULTS AND DISCUSSION
Grained samples experiment, comparison of the spectra
The EPR spectra for different periods of exposure using the UV source are shown in Fig. 2. Each spectrum shown is an average of nine different sample spectra. The most intensive line in the central part of spectra is the dosimetric signal of the enamel, which is the same as for gamma exposed samples. The positions of DS and the main UV-specific R1 signal (see Fig. 3 for details) is shown by arrows in Fig. 2. The variation of responses of the UV-sensitivity between individual samples was about ± 20 % (1 σ).
Figure 2.
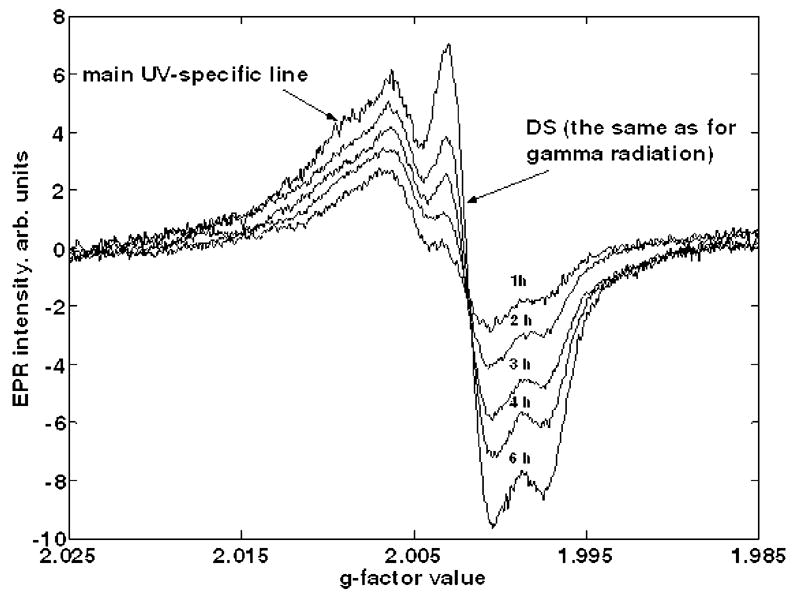
Tooth enamel spectra for different UV exposure times. The position of the dosimetric signal and the main UV-specific R1 signal (see details in Fig. 3) are shown by arrows. One hour of exposure corresponds to light energy flux of approximately 0.14 J mm−2.
Figure 3.
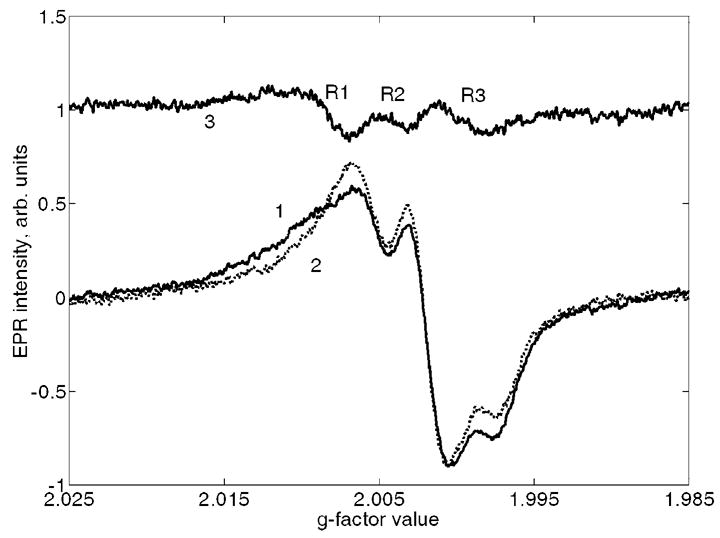
Least-squares fitting of the EPR spectra for UV-exposed samples: 1 is an initial spectrum; 2 is the best fit using the reference standards for dosimetric and native signals and 3 is the difference between 1 and 2. R1, R2 and R3 are UV-specific lines with approximate g-factors of 2.0095 (low field peak at 2.0110), 2.005 and 2.0005 respectively.
An example of the spectral fitting procedure is demonstrated in Fig. 3 where spectrum 1 is an initial spectrum, spectrum 2 is the best fit using the reference standards of dosimetric and native signals (see Section “Spectra analysis” above), and spectrum 3 is the difference between spectra 1 and 2. Spectral lines attributed to UV radiation (denoted as R1, R2 and R3 and corresponding to g-factor values of 2.011, 2.005 and 2.0005, respectively) are evident in spectrum 3. The R1 and R2 signals were also observed in a previous study (Sholom et al. 1998) where R3 was found to be weakly distinguishable due to its strong overlap with the high-intensity dosimetric signal. It should be noted that similar to the R1 and R2 signals were also observed in Jiao et al. (2007) for sunlight exposed samples (designated by Jiao as S3 and S2, respectively). R3 signal was not observed in Jiao et al. (2007) probably due to the same reason as mentioned above.
Using the analysis procedure above, the intensities of dosimetric and R1 signals were determined for all tooth enamel samples in the 630–850 μm size range at each UV exposure time and for the set of gamma-exposed calibration samples. The corresponding “time-dependence” and “dose-dependence” curves were plotted and are shown in Fig. 4. The two bottom curves represent the intensities of the DS and R1 signals in samples exposed to UV radiation (x-axis for them is the time of UV exposure) while the upper curve demonstrates the DS in the samples exposed to gamma radiation (x-axis is the absorbed gamma dose). All dependencies in Fig. 4 were fitted using linear regression; the parameters of regression that were obtained are shown near to corresponding curves.
Figure 4.
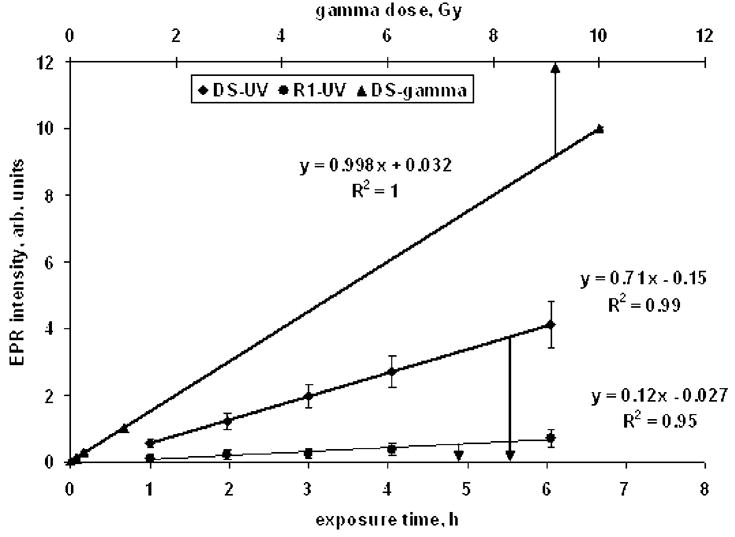
“Time-dependence” and “dose-dependence” curves for samples exposed on UV and gamma sources. Two bottom curves represent the intensities of DS and R1 signals in samples exposed to UV radiation (x-axis for them is the time of UV exposure) while the upper curve shows the DS in the samples exposed to gamma radiation (x-axis is the absorbed gamma dose). Every point is average of measurements of 9 samples in the 630–850 μm size range for UV-related data and 5 grained samples for gamma-related data; arrows show the standard deviation of peak-to-peak intensities and reflect the variability of samples sensitivity to UV or gamma exposure.
A comparison of slopes for DS dependencies (0.998 Gy−1 for samples exposed to gamma radiation and 0.71 h−1 for UV exposed samples) results in an equivalent dose rate calibration coefficient for the UV source: 0.71 Gy h−1. It should be noted here that this value is valid only for tooth enamel tissue and for samples of a specific size range (630–850 μm grains). Any other tissues or tooth enamel samples of other sizes would require a re-calibration of this UV source equivalent dose rate. For example, when two samples of the same tooth with different grain size (250–430 and 630–850 μm) were exposed identically, the UV equivalent dose for the 250–430 μm sample was higher than the 630–850 μm sample by a factor of 3.6 due to the low depth of penetration by UV radiation. These data are in agreement with that of Ivannikov et al. (1997).
The dose rate calibration coefficient of the UV source depends strongly on the emission spectrum of the source. This may be deduced from a comparison of the UV dose equivalent value obtained here (710 mGy h−1) with the UV dose equivalent value for solar radiation (19.6 mGy h−1) as reported by Jiao et al. (2007) for 0.5–1 mm grains samples. It should be noted that the light energy flux rate of the NIST UV source was 0.14 MJ m−2 h−1 compared to the average solar radiation rate of 2.5 MJ m−2 h−1 (Jiao et al. 2007). Hence, even though the NIST UV source has an energy flux that is about 6% of the average solar radiation rate, it has an equivalent dose rate coefficient of about 3600% of solar radiation, a difference that can be attributed to the differences in the UV spectra of the two light sources.
Taking into account the 0.71 Gy h−1 dose rate calibration coefficient, it is seen in Fig. 4 that both DS and R1 signals display the linear dependence in UV equivalent dose range of 0.7–4.2 Gy. In case of the DS, the result obtained agrees with that presented in Jiao et al. 2007 (see Fig. 4 there). There is less agreement for the R1 signal (which corresponds to S3 in Jiao et al. 2007) and this is attributed to a combination of the relative weakness of the signals and the different analysis techniques used. Direct comparisons would be needed to resolve this discrepancy.
Another observation which follows from Fig. 4 is the sensitivity of the R1 signal. This signal was selected for the technique developed here to separate the UV equivalent and gamma doses in front teeth because it is relatively free from overlap with the strong dosimetric signal and, therefore, can be determined with higher accuracy. Its sensitivity, according to Fig. 4, is approximately one-sixth relative to the dosimetric signal sensitivity. This fact enables us to roughly estimate the limit of detection for the R1 signal using the corresponding value for the DS. The limit of detection of the DS as discussed in the Material and Methods section, is around 50 mGy. Hence, 300 mGy may be predicted as the minimal detectable UV equivalent dose if use the R1 signal as the UV equivalent dose indicator. Again, additional measurements are required in order to refine this estimate.
Grained samples experiment, microwave power saturation study
The EPR microwave power saturation curves obtained for gamma and UV exposed samples (with gamma or UV equivalent doses of approximately 10 Gy) were the same within the experimental uncertainty. This finding contradicts the results of Vorona et al. (2007) but confirms the results of Jiao et al. (2007). A possible explanation for this contradiction is that the much higher doses (tens of kGy) used in the study by Vorona et al. (2007) result in different saturation effects for gamma EPR centers compared to UV produced EPR centers. From our data, we conclude that it is not possible to use the power saturation technique for the separation of UV equivalent and gamma doses in front teeth.
Plate sample experiment, angular dependencies
In the studies of Vorona et al. (2007), they proposed to use the difference between the ratios of minimal to maximal EPR intensities from angular dependence measurements of UV and gamma irradiated samples as a basis for separation of the two sources of dosimetric signal intensities. However, the dose level used in their work was tens of kGy which corresponds to the very intensive dosimetric signals measurable with high precision. In our work, this effect was investigated for doses below 10 Gy. The tendency to have difference between angular dependencies for UV and gamma irradiated samples was observed, but this effect was statistically unreliable due to high measurement uncertainties, which were as high as 300–500 mGy (1 σ) for plate samples with typical weight in the range of 15–20 mg. Hence, this effect cannot be used for dose estimation with front teeth.
Plate sample experiment, study of tooth enamel penetration depth
The transmittance of UV light through tooth enamel was measured for a wide range of wavelengths and enamel plates of different thickness. The penetration depths were calculated and are shown in Fig. 5. The typical values (60–120 μm for the UV wavelength range) agreed with results obtained in some previous studies: 63 and 109 μm in Sholom et al. (1998) for 254 nm UV lamp, 85 and 105 μm in Ivannikov et al (1997) also for 254 nm UV exposure and 130 μm which was regarded as an overestimated value in Fattibene et al. (1998) for 365 nm UV radiation. There is some discrepancy with results presented by Ivannikov et al. (1997) for sunlight exposure (they reported a penetration depth value of 280 μm), but it is likely related to the low accuracy of sunlight penetration depth measurements in Ivannikov et al. (1997). In that work, the etching of grained sunlight-exposed samples was used for determination of the parameter, and the low accuracy of such experiment may be seen on corresponding data in Fig. 4 of the cited paper.
Figure 5.
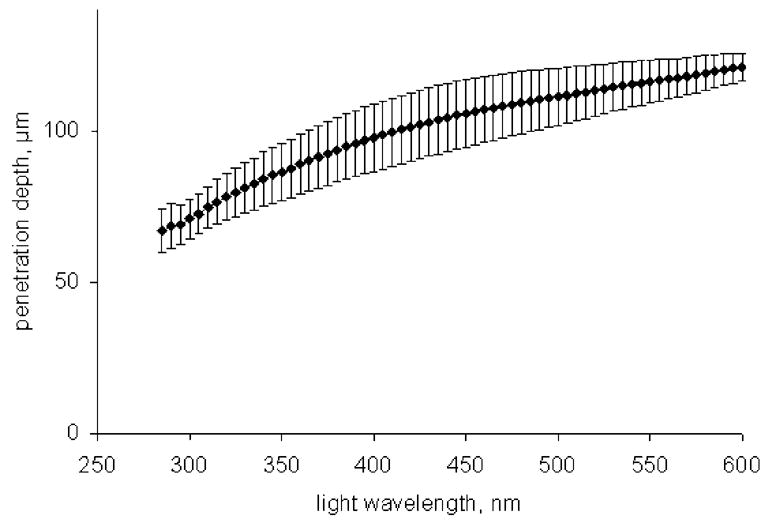
Penetration depth of tooth enamel as a function of the light wavelength; vertical error bars correspond to the standard deviation of five measured samples.
Our results suggest that removal of an enamel layer of similar thickness would significantly reduce the contribution of UV-generated EPR signal intensity to the cumulative dosimetric EPR signal used to assess the gamma-ray dose. For example, for the 1-mm enamel layer (typical thickness of enamel in front teeth), simple calculations suggest a 57 % to 81 % reduction of the UV contribution to the cumulative dosimetric signal if a 100-μm surface layer is removed.
Application of studied effects for dosimetry of front teeth
The technique developed in our work for separation of the UV equivalent dose from the true gamma-ray dose was tested on teeth from residents of the region of the Semipalatinsk Nuclear Test Site (Kazakhstan) who lived there during the period of atmospheric nuclear testing (1949–1962) (see Sholom et al. 2007). Eight front teeth (only buccal parts) were measured by this EPR technique. In order to obtain the maximal accuracy and reproducibility, every sample was recorded at 10 different angles with the total number of scans equal to 120. The spectra of an empty sample tube were recorded before and after the spectra of the sample with the same total number of scans. Spectra were treated according to procedure described in Sholom and Chumak (2003); intensities of DS and possible R1 signal were determined. The reproducibility of EPR signals evaluation with the above procedure was tested using measurements of some selected samples repeated three times, resulting in about ±10% (1 σ) variation for DS in the sample with cumulative dose of about 100 mGy and ±30% (1 σ) variation for the R1 signal in the sample with UV equivalent dose of about 300 mGy.
Only two samples from the eight samples studied demonstrated doses high enough to be potentially suitable for the dose separation procedure. The corresponding spectra are shown in Figs. 6a and 6b. For the spectra of Fig. 6a, the cumulative dose (which includes both UV equivalent and gamma dose components) was 296±15 mGy. For this spectrum, the R1 signal is evident (see the difference spectrum 3 in Fig. 6a). Using this signal, a UV equivalent dose was assessed to be 238±95 mGy. As a result, the gamma-ray dose for this person was estimated to be approximately 58±96 mGy. For another person with a higher cumulative dose (Fig. 6b, EPR dose 282 mGy), no significant R1 signal was detected in the EPR spectra (see corresponding spectrum 3), hence, the correction for UV equivalent dose was not required for that person.
Figure 6.
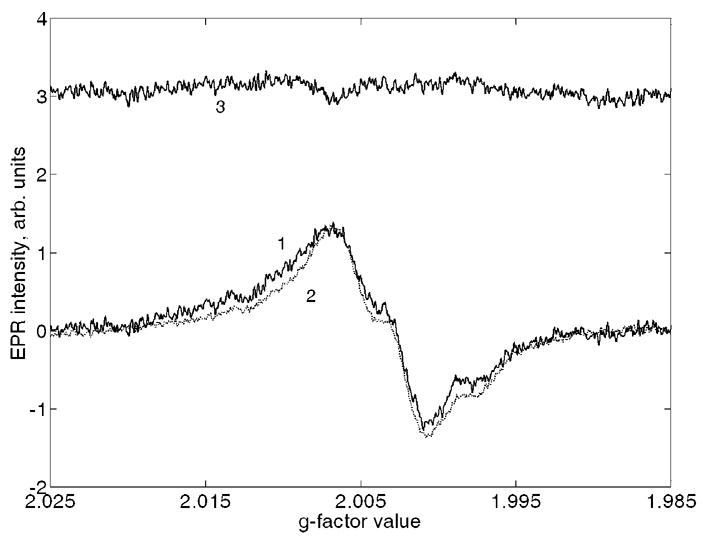
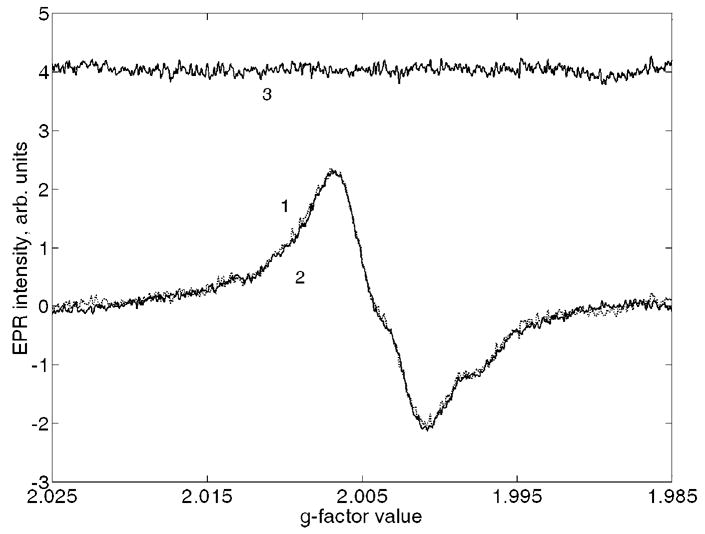
Spectra fitting for two front teeth with and without UV equivalent dose contribution (panels a and b, respectively): 1 is initial spectrum, 2 is the best fitting spectrum, and 3 is difference of 1 and 2.
An additional step in validating the technique discussed here was done using EPR measurements of the corresponding lingual parts of two teeth. The reconstructed cumulative doses were 117±46 mGy and 176±53 mGy for teeth in Figs. 6a and 6b, respectively; and because no R1 signals were detected in their EPR spectra, cumulative doses were considered as gamma-ray doses of samples. The first value agreed well with that obtained using the corresponding buccal part and the technique described here (58±96 mGy), the second one is slightly lower comparing to cumulative dose of corresponding buccal part (282±30 mGy). Two reasons may explain this discrepancy. First, there may be a contribution of some undetectable component of UV equivalent dose to the cumulative dose of the buccal part. The value of this component would be around 100 mGy, which is below the sensitivity limit of the discussed technique. Another explanation is the contribution of possible X-ray dental examinations, which, if present, could contribute much more to the buccal part comparing with the lingual one.
The dosimetric signals for remaining six front teeth were below the sensitivity of this technique as indicated by the absence of an R1 signal in their spectra.
CONCLUSIONS
UV light produces EPR signals (DS, R1, R2 and R3) that interfere with the assessment of gamma-ray doses by the traditional EPR analysis method. While UV-generated dosimetric signal overlaps with the gamma-ray dosimetric signal, the R1 (g=2.011) signal does not, and can be used to assess and subtract the UV contribution from the measured cumulative dose in front teeth. Both the dosimetric and R1 signal intensities increased linearly with UV equivalent dose in the equivalent dose range (0.7–4.2 Gy) studied.
Other methods (e.g., Vorona et al., 2007) to distinguish the UV contribution to the cumulative dose were concluded to be unsuitable for biodosimetry requirements. The microwave power saturation dependencies were the same for both UV and gamma exposed samples so their approach cannot be used for the separation of UV equivalent doses from gamma doses. The difference between angular EPR signal dependencies of gamma and UV exposed enamel plates was within the measurement uncertainty for doses < 10 Gy.
The values of the tooth enamel penetration depth were in the range of 60–120 μm for the UV wavelengths. 100-μm layer of enamel may be removed from surface of teeth in order to significantly reduce the UV equivalent dose contribution.
At the present time, UV equivalent and gamma doses may be separately assessed using UV-specific EPR signals. This technique was tested on two of eight front teeth from Semipalatinsk area inhabitants that demonstrated large enough doses that would allow application of our method. Another six samples had a total accumulated dose below 200 mGy and had no distinguishable markers of UV equivalent dose present in their EPR spectra. The accuracy of the proposed technique requires further verification.
Acknowledgments
This work was supported by the Intra-Agency agreement between the National Institute of Allergy and Infectious Diseases (NIAID) and the National Cancer Institute (NCI), NIAID agreement #Y2-A1-5077 and NCI agreement #Y3-CO-5117. Authors would like to thank to James Puhl, Joannie Chin, Eric Byrd, Chris White, Jason Garver and John Hettenhouser from NIST for kind assistance with gamma and UV irradiation of samples.
Footnotes
Certain commercial equipment, instruments, or materials are identified in this paper to foster understanding. Such identification does not imply recommendation or endorsement by the National Institute of Standards and Technology, nor does it imply that the materials or equipment identified are necessarily the best available for the purpose.
References
- Chumak V, Sholom S, Pasalkaya L. Application of high precision EPR dosimetry with teeth for reconstruction of doses to Chernobyl populations. Radiat Prot Dosim. 1999;84:515–520. [Google Scholar]
- El-Faramawy NA. Comparison of gamma- and UV-light-induced EPR spectra of enamel from deciduous molar teeth. Appl Radiat Isot. 2005;62:191–195. doi: 10.1016/j.apradiso.2004.08.011. [DOI] [PubMed] [Google Scholar]
- Fattibene P, Aragno D, Onori S. Effectiveness of chemical etching for background electron paramagnetic resonance signal reduction in tooth enamel. Health Phys. 1998;75(5):500–505. doi: 10.1097/00004032-199811000-00006. [DOI] [PubMed] [Google Scholar]
- International Atomic Energy Agency. Use of electron paramagnetic resonance dosimetry with tooth enamel for retrospective dose assessment. Vienna: IAEA; 2002. IAEA-TECDOC-1331. [Google Scholar]
- Ivannikov AI, Skvortzov VG, Stepanenko VF, Tikunov DD, Fedosov IM, Romanyukha AA, Wieser A. Wide-scale EPR retrospective dosimetry: results and problems. Radiat Prot Dosim. 1997;71:175–180. [Google Scholar]
- Jiao L, Takada J, Endo S, Tanaka K, Zhang W, Ivannikov A, Hoshi M. Effects of sunlight exposure on the human tooth enamel ESR spectra used for dose reconstruction. J Radiat Res (Tokyo) 2007;48:21–29. doi: 10.1269/jrr.0616. [DOI] [PubMed] [Google Scholar]
- Liidja G, Past J, Puskar J, Lippmaa E. Paramagnetic resonance in tooth enamel created by ultraviolet light. Appl Radiat Isot. 1996;47:785–788. doi: 10.1016/0969-8043(96)00036-x. [DOI] [PubMed] [Google Scholar]
- Nilsson J, Lund E, Lund A. The effect of UV-irradiation on the ESR-dosimetry of tooth enamel. Appl Radiat Isot. 2001;54:131–139. doi: 10.1016/s0969-8043(99)00275-4. [DOI] [PubMed] [Google Scholar]
- Sholom SV, Haskell EH, Hayes RB, Chumak VV, Kenner GH. Properties of light induced EPR signals in enamel and their possible interference with gamma-induced signals. Radiat Meas. 1998;29:113–118. [Google Scholar]
- Sholom SV, Chumak VV, Bakhanova EV. Assessment of contribution of confounding factors to cumulative dose determined by EPR of enamel. In: Kawamori A, Yamauchi J, Ohta H, editors. EPR in the 21st Centrury: Basics and Applications to Material, Life and Earth Sciences. Elsevier; 2002. pp. 628–633. [Google Scholar]
- Sholom SV, Chumak VV. Decomposition of spectra in EPR dosimetry using the matrix method. Radiat Meas. 2003;37:365–370. [Google Scholar]
- Sholom S, Desrosiers M, Bouville A, Luckyanov N, Chumak V, Simon SL. EPR tooth dosimetry of SNTS area inhabitants. Radiat Meas. 2007;42:1037–1040. doi: 10.1016/j.radmeas.2007.05.007. [DOI] [PMC free article] [PubMed] [Google Scholar]
- Vorona IP, Baran NP, Ishchenko SS, Rudko VV. Separation of the contributions from gamma-and UV-radiation to the EPR spectra of tooth enamel plates. Appl Radiat Isot. 2007;65:553–556. doi: 10.1016/j.apradiso.2006.12.001. [DOI] [PubMed] [Google Scholar]


