

Abstract
Purpose
To investigate the impact of different field strengths on determining plaque composition with an automatic classifier.
Materials and Methods
We applied a previously developed automatic classifier – the morphology enhanced probabilistic plaque segmentation (MEPPS) algorithm – to images from 20 subjects scanned at both 1.5T and 3T. Average areas per slice of lipid-rich core, intraplaque hemorrhage, calcification, and fibrous tissue were recorded for each subject and field strength.
Results
All measurements showed close agreement at the two field strengths, with correlation coefficients of 0.91, 0.93, 0.95, and 0.93, respectively. None of these measurements showed a statistically significant difference between field strengths in the average area per slice by a paired t-test, although calcification tended to be measured larger at 3T (p=0.09).
Conclusion
Automated classification results using an identical algorithm at 1.5T and 3T produced highly similar results, suggesting that with this acquisition protocol, 3T signal characteristics of the atherosclerotic plaque are sufficiently similar to 1.5T characteristics for MEPPS to provide equivalent performance.
Keywords: carotid artery, MRI, atherosclerosis, segmentation, field strength
INTRODUCTION
An emerging application for 3T MRI is vessel wall imaging. The improved signal-to-noise ratio (SNR) of high-field scanners (1) has tremendous potential in imaging of atherosclerotic plaque in the vessel wall, which requires high resolution and contrast to distinguish subtle differences between small regions of the vessel wall. Improved reproducibility may also result from the higher SNR and a study of normal subjects found excellent measurement reproducibility for wall volume and thickness at 3T (2). Increased SNR at 3T also holds promise for clinical use of MRI to identify high-risk carotid plaques through improvements in image quality and/or reduced scan time. However, most of the histological validation of in vivo vessel wall MRI has been conducted at 1.5T (3–12), which raises the question whether the results from 1.5T are applicable at 3T.
Initial studies have demonstrated that 1.5T and 3T scanners provide largely equivalent results for measurements of overall vessel wall morphology in the carotid artery. A study of 7 subjects found intraclass correlation coefficients (ICCs) for lumen area, wall area, and mean wall thickness in excess of 0.95 and no significant bias when comparing 1.5T and 3T scans of the same subject (1). This study did not, however, address bias in measurements of plaque components, but did suggest that alterations in tissue properties such as T1 and T2 relaxation times may substantially alter the contrast features of the plaques. A more comprehensive study of 20 subjects (13) evaluated manual interpretations of plaque components and found ICCs for measurements of necrotic cores, calcifications, and hemorrhage ranging from 0.62 to 0.92. However, because these analyses were performed manually, they did not address the extent to which the reviewers were able to compensate for subtle signal differences between field strengths.
In this investigation, we sought to investigate subtle changes in the contrast features of major plaque components at 3T as compared to 1.5T by comparing the performance of an automatic plaque classifier on subjects scanned at both field strengths. We utilized an automatic classifier known as the morphology enhanced probabilistic plaque segmentation (MEPPS) algorithm that was proposed by Liu et al. (14). MEPPS classifies plaque regions into necrotic core, calcification, loose fibrous matrix, and dense fibrous (including muscular) regions. Because MEPPS classifies hemorrhage and lipid-rich areas together as necrotic core, we added an additional classification step to further subdivide the necrotic core region into lipid-rich core, type I hemorrhage (intact red blood cells), and type II hemorrhage (lytic red blood cells) as defined by Takaya et al. (15). The resulting algorithm was then applied to images of carotid arteries from subjects scanned at both 1.5T and 3T. The relative bias and agreement between scans for all tissue types was assessed.
MATERIALS AND METHODS
MR Imaging
Twenty subjects (15 male) with an average age of 69.8±10.5 years and carotid artery stenosis between 16% and 79% by duplex ultrasound were imaged on both a 1.5T MR scanner (GE Signa, Milwaukee, WI) and a 3T MR scanner (Philips Achieva, Best, Netherlands). All subjects provided informed consent and the study was approved by the institutional review board. Both imaging sessions were conducted with fat-suppressed, multiple-contrast imaging protocols to obtain images with black-blood T1, T2, proton density, and contrast-enhanced T1 weightings plus bright-blood time-of-flight angiography. Contrast-enhanced T1-weighted images were acquired approximately 10 minutes after injection of 0.1 mmol/kg of a gadolinium contrast agent (Omniscan, GE healthcare, Milwaukee, WI) using the same protocol as the pre-contrast T1-weighted images.
Pre and post-contrast T1-weighted sequences used quadruple inversion recovery (QIR) blood suppression as proposed by Yarnykh et al. (16). T2-weighted and proton density images used a time-efficient, multi-slice double inversion recovery (MDIR) sequence also proposed by Yarnykh et al. (17). All inversion times were separately optimized for 1.5T and 3T field strengths. Other imaging parameters (Table 1) were selected to match the 3T protocol as closely as possible to the 1.5T protocol, with a few minor exceptions. The repetition time (TR) for T2-weighted and proton-density-weighted images was extended to 4000 ms at 3T to avoid partial T1-weighting due to the lengthening of T1 at higher field strength. Also, at 3T, the number of averages was reduced to 1, taking advantage of the greater SNR, which allowed us to extend coverage while reducing total scan time. Assuming a 1.5–1.8 fold increase in SNR at 3T as reported by Yarnykh et al. (1), and a 1.4-fold loss due to eliminating the 2 averages, we were left with a theoretical 1.1 to 1.3-fold gain in SNR, depending on contrast weighting. Image acquisition for both scanners utilized custom phased-array carotid surface coils based on the design of Hayes et al. (18). The coil used at 1.5T was acquired from a third-party vendor (Pathway MRI, Redmond, WA) and the 3T coil was manufactured in-house using the same circuit board and element configuration.
Table 1.
Imaging Parameters (listed as 1.5T/3T where different).
| T1W | T2W | PDW | TOF | |
|---|---|---|---|---|
| 2D or 3D | 2D | 2D | 2D | 3D |
| Sequencea | FSE/TSE | FSE/TSE | FSE/TSE | SPGR/T1-FFE |
| Blood Suppressionb | QIR | MDIR | MDIR | Veinous sat |
| TR (ms) | 800 | 3000/4000 | 3000/4000 | 23/20 |
| TE (ms) | 11.0/9.0 | 53.7/52.0 | 8.9/8.0 | 3.6/4.8 |
| Echo train | 10/11 | 12 | 12 | - |
| Flip Angle, deg | 90 | 90 | 90 | 25/20 |
| Averages | 2/1 | 2/1 | 2/1 | 2/1 |
| FOV (mm) | 160 × 120 | 160 × 120 | 160 × 120 | 160 × 120 |
| Matrix | 256 × 192 | 256 × 192 | 256 × 192 | 256 × 192 × 32 |
| Thickness (mm) | 2 | 2 | 2 | 2 |
| Slices | 12/16 | 12/16 | 12/16 | 16/24 |
| Scan Time (min) | 7/4 | 4/3 | 4/3 | 3/2 |
The following proprietary acronyms are used: FSE = fast spin echo (GE), TSE = turbo spin echo (Philips), SPGR = spoiled gradient recovery (GE), and T1-FFE = T1-weighted fast field-echo (Philips).
Image Analysis
For image analysis, we utilized the computer-aided system for cardiovascular disease evaluation (CASCADE) developed by Kerwin et al. for interactive identification of vessel boundaries and multiple-contrast image registration (19). Three reviewers, each with at least one year of carotid artery MRI experience, performed the analysis. For each examination, the location of the carotid artery bifurcation was determined in all contrast weightings and used as a landmark for longitudinal alignment. Then, the lumen and outer wall boundaries were identified using the semi-automated boundary detection tools of CASCADE applied to the T1-weighted image. Finally, the other contrast weightings were shifted to align with the T1W images using the automated registration tool of CASCADE. Manual corrections to the CASCADE results were applied as necessary, based on the experience of the reviewers. These corrections consisted of dragging control points that define the lumen and outer wall contours to produce better alignment with the perceived boundaries and in-plane shifting of the other contrast weightings to provide better registration with the boundaries drawn on T1W images. All analyses were performed independently on 1.5T and 3T data sets.
Automatic Classifier
The internal plaque components were then automatically classified using the MEPPS algorithm without any manual corrections. As described by Liu et al. (14), MEPPS segments carotid atherosclerotic plaque based on a probability model of morphological and MRI signal characteristics. The probability model was trained using histologically confirmed regions outlined in carotid endarterectomy subjects imaged prior to surgery at 1.5T. To negate the effects of scanner variability, coil placement, and artery depth on signal intensity, all images are normalized by the median intensity within a region of interest centered on the carotid artery after application of a coil correction algorithm. The outputs of the probability model are the posterior probabilities for each pixel to be each of the possible plaque tissue components. A competing active contour algorithm then determines optimal contours that outline the different tissue regions and maximize the total probability under a smoothness constraint.
The MEPPS algorithm subdivides the vessel wall into regions of necrotic core (including intraplaque hemorrhage), calcification, loose matrix, and dense fibrous regions. Given the emerging importance of intraplaque hemorrhage in relation to progression and complications (15,20–23), we performed an additional classification step to subdivide the necrotic core into regions that were lipid rich, that contained type I hemorrhage, and that contained type II hemorrhage. To accomplish this, a statistical model was developed to assign probabilities for the three new classifications within regions identified as necrotic core. The statistical model used the same framework as MEPPS and was trained using histologically confirmed 1.5T image results from 20 endarterectomy subjects.
To validate the performance of the extended MEPPS algorithm, the 1.5T imaging results from this study were also manually outlined by the same reviewers who identified the vessel boundaries. Regions of necrotic core, type I and II hemorrhage, calcification, and loose matrix were outlined using the manual drawing utility of CASCADE. Regions were identified based on the established criteria for multiple-contrast MRI of carotid atherosclerosis (3–7). The remainder of the plaque consists of a cellular, fibrous matrix that was termed “dense fibrous tissue.” The manual review results were compared to the MEPPS results.
Statistical Methods
For each artery, the average area per slice was computed for each detected component. Then, these measurements were compared for manual versus automated review at 1.5T and for automated review at 1.5T versus 3T. Use of a single average measurement per subject reduced the influence of differences in longitudinal coverage between subjects and eliminated the need to control for multiple measurements per subject. Bias was assessed by means of a paired t-test, with P<0.05 considered a significant level of bias. Bland-Altman analysis was also used to assess any size dependent bias in the measurements. Agreement of the quantitative measurements was assessed using Pearson’s correlation coefficient (R). The correspondence of the locations of detected areas was assessed by comparing the presence or absence of a tissue component in each slice using Cohen’s κ statistic. A value of κ greater than 0.6 was considered to indicate very good agreement.
All 6 tissue classifications – lipid-rich core, type I hemorrhage, type II hemorrhage, calcification, loose matrix, and dense fibrous – were compared. In addition, various tissue groupings were compared under the observation that tissues with similar characteristics may exhibit better detection performance as a group (24). Specifically, the groupings outlined in Table 2 were evaluated, in which both loose fibrous matrix and dense fibrous regions were grouped, both hemorrhage types were grouped, and all components of the necrotic core were grouped.
Table 2.
Classifications and sub-classifications of atherosclerotic plaque.
| Vessel Wall | |||||
|---|---|---|---|---|---|
| Fibrous Tissue | Necrotic Core | Calcification | |||
| Loose Matrix | Dense Fibrous | Intraplaque Hemorrhage | Lipid-rich Core | ||
| Type I | Type II | ||||
Location Comparison
In addition to the comparison of area measurements, a comparison of the 1.5T and 3T results was performed to validate the relative spatial locations of the segmented regions. For each artery, the necrotic core and calcified regions were rendered in three dimensions along with a maximum intensity projection (MIP) of the time-of-flight angiogram using the carotid plaque analysis software MRI-PlaqueView (VPDiagnostics, Seattle, WA). Correspondences between major plaque components were assessed as “very good” if the general sizes and locations were highly similar at both field strengths, “good” if the sizes and locations were similar but exhibited one or more notable differences, and “poor” if significant discrepancies existed in the sizes and locations of components.
RESULTS
A total of 225 locations were identified with images from all available contrast weightings and corresponding locations relative to the bifurcation in the 1.5T data set. Of these, 218 had corresponding locations at 3T. Typical imaging and MEPPS classification results at the two field strengths are provided in Figures 1 and 2.
Fig 1.
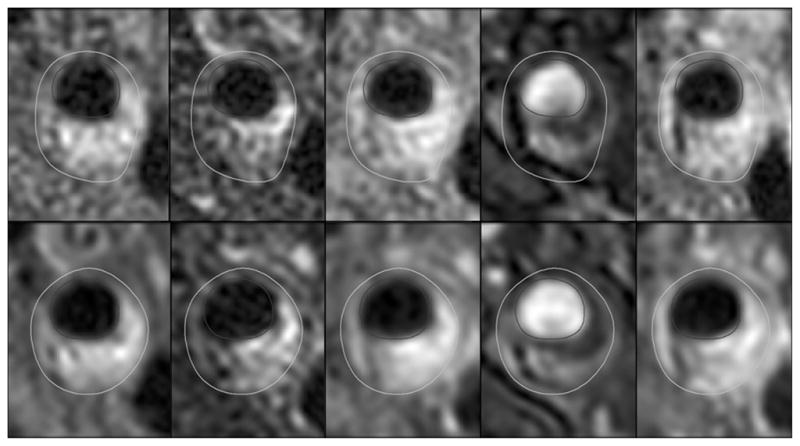
Example images from the same subject at 1.5T (top row) and 3T (bottom row). Contrast weightings are (from left to right) T1, T2, proton density, time-of-flight, and contrast-enhanced T1.
Fig. 2.
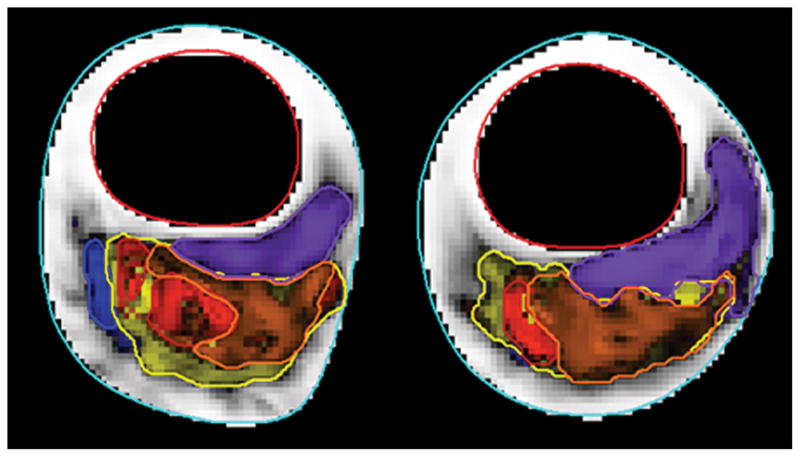
Automatic classification results for 1.5T (a) and 3T (b) images shown in Figure 1. Fibrous tissue is white, loose matrix purple, calcification blue, lipid core yellow, type I hemorrhage red and type II hemorrhage orange.
Validation
The results of MEPPS analysis compared to manual review are summarized in Table 3. In general, the MEPPS and manual review results show good agreement, with correlation coefficients for most tissues near 0.9 and κ above 0.6. Agreement was moderate for loose matrix and for types I and II hemorrhage, with R in the range 0.64–0.79 and κ in the range 0.37–0.49. If the classifications were limited to lipid-rich core, calcification, hemorrhage (types I and II combined), and fibrous tissue (including loose matrix), agreement was very good. Quantitative measurements of these four tissue areas exhibited correlation coefficients in the range 0.87–0.94. Manual and MEPPS reviews agreed on the presence or absence of lipid-rich core in 87% of locations, calcification in 90% of locations, and hemorrhage in 89% of locations. Corresponding κ values ranged from 0.61–0.74.
Table 3.
Comparison of results at 1.5T using manual versus automatic classification.
| Average Area Per Slice (mm2) | |||||
|---|---|---|---|---|---|
| Tissue | Manual | MEPPS | P | R | κ |
| Lipid Rich Core | 2.48 | 1.57 | 0.07 | 0.87 | 0.68 |
| Type I Hemorrhage | 0.22 | 0.63 | 0.08 | 0.64 | 0.37 |
| Type II Hemorrhage | 1.08 | 0.61 | 0.3 | 0.79 | 0.49 |
| Calcification | 1.71 | 0.94 | 0.03 | 0.89 | 0.74 |
| Loose Matrix | 0.68 | 1.19 | 0.02 | 0.68 | 0.40 |
| Dense Fibrous | 29.23 | 30.45 | 0.002 | 0.96 | * |
| Combined Regions | |||||
| All Hemorrhage | 1.29 | 1.25 | 0.9 | 0.92 | 0.61 |
| Necrotic Core | 3.77 | 2.82 | 0.07 | 0.93 | 0.72 |
| All Fibrous | 29.91 | 31.64 | <0.001 | 0.94 | * |
Cohen’s κ could not be computed for Fibrous regions because they were present in every slice
In terms of bias between MEPPS and manual review, marginally significant trends for MEPPS to produce smaller regions of calcification (P=0.03) and necrotic core (P=0.07) were observed. Together, these reduced areas led to a significantly larger areas being designated as the remaining fibrous tissue type (P<0.001). Overall, hemorrhage was not significantly different (P=0.9) between manual and MEPPS review, but a trend was observed for more hemorrhage area to be designated as type I by MEPPS and less area being designated as type II. Finally, significantly more area was attributed to loose matrix by MEPPS than by manual review. The reason was found to be a high incidence of locations with loose matrix detected by MEPPS that was not identified in manual review. This led to both the observed bias and relatively low agreement for loose matrix. When manual review identified loose matrix, the MEPPS result was found to produce similar measurements.
The observed bias between MEPPS and manual review shows that the two measurement techniques are not interchangeable. Despite the bias, however, the close agreement in terms of R and κ suggests that either technique will provide similar results in evaluations of lesion components, provided suitable correction factors are introduced when comparing manual and MEPPS results. The lack of a histological reference in this study prevents us from determining which review procedure is more accurate.
3T versus 1.5T
The results of MEPPS analysis at 1.5T and 3T are summarized in Table 4. With the exception of loose matrix, all tissue types exhibited strong agreement, with correlation coefficients in the range 0.87–0.98 and κ in the range 0.55– 0.77. Combining types I and II hemorrhage yielded a moderate improvement in κ from 0.59 and 0.55, respectively, to 0.65.
Table 4.
Comparison of results at 1.5T versus 3T for automatic classification.
| Average Area Per Slice (mm2) | |||||
|---|---|---|---|---|---|
| Tissue | 1.5T | 3T | P | R | κ |
| Lipid Rich Core | 1.61 | 2.17 | 0.3 | 0.91 | 0.68 |
| Type I Hemorrhage | 0.63 | 0.34 | 0.04 | 0.98 | 0.59 |
| Type II Hemorrhage | 0.63 | 0.89 | 0.03 | 0.91 | 0.55 |
| Calcification | 0.95 | 1.30 | 0.09 | 0.95 | 0.77 |
| Loose Matrix | 1.27 | 2.92 | 0.002 | 0.29 | 0.20 |
| Dense Fibrous | 30.64 | 28.48 | 0.001 | 0.89 | * |
| Combined Regions | |||||
| All Hemorrhage | 1.26 | 1.23 | 0.8 | 0.93 | 0.65 |
| Necrotic Core | 2.87 | 3.41 | 0.4 | 0.87 | 0.69 |
| All Fibrous | 31.91 | 31.39 | 0.3 | 0.93 | * |
Cohen’s κ could not be computed for Fibrous regions because they were present in every slice
In terms of bias, the total wall area as drawn by the reviewers could have been a source of bias in the component measurements. To test for this, the wall area measurements were compared and exhibited a non-significant (P=0.6) difference in means of 35.7 mm2 for 1.5T scans versus 36.1 mm2 for 3T. The mean values for lipid-rich core, hemorrhage, and fibrous tissues also showed no significant bias between 3T and 1.5T (P = 0.3 to 0.9); calcification showed a trend (P=0.09) to be larger at 3T than at 1.5T. Bland-Altman plots for each of these four tissue types (Figure 3) showed an apparent size-dependent bias in calcification, with results increasingly overestimated at 3T.
Fig. 3.


Bland-Altman plots showing mean difference (solid line) and limits of agreement (+/−1.96 standard deviations; dashed lines) comparing mean areas measured with an automatic classifier at 3T versus 1.5T in 20 carotid arteries.
Although total hemorrhage area showed no significant bias, when hemorrhage was subdivided into types I and II, significant biases were apparent. Specifically, type I was significantly reduced (P=0.04) at 3T and type II was significantly increased (P=0.03), suggesting that regions of type I hemorrhage are more likely to be classified as type II at 3T. Similarly, loose matrix regions identified by MEPPS at 3T were significantly larger than at 1.5T (P=0.002), at the expense of dense fibrous regions being smaller (P<0.001).
The 3D location comparison found generally good agreement in the spatial distribution of the calcified and necrotic components (Figure 4). Only 3 cases (15%) were classified as poor agreement. Four cases (20%) were classified as good and the remainder (65%) were classified as very good. The discrepancies most commonly noted were displacements in the location of calcified regions and differences in the longitudinal extent of necrotic regions. Some of these errors may have been an artifact of the somewhat coarse 2 mm sampling interval of the images in the longitudinal direction.
Fig. 4.

Paired three-dimensional renderings (MRI-PlaqueView, VPDiagnostics, Seattle, WA) of necrotic core (yellow) and calcifications (white) with time-of-flight angiograms. In each pair, the 1.5T result appears on the left and the 3T result on the right. Correspondences in the left column were judged to be “poor” because of a large calcification only present at 1.5T (top; arrow) or offsets in the location of calcifications (middle, bottom; arrows). Correspondences for the middle column were judged to be “good” with a minor increase in the extent of the necrotic core (arrows) noted at 1.5T (top) or 3T (middle, bottom). Correspondences in the right column were judged to be “very good” with large, nearly identical necrotic cores (top; arrows), focal plaques with calcification at the bifurcation (middle; arrows), and three plaque regions with similar components (bottom; arrows).
DISCUSSION
This investigation showed that an automatic classifier trained on 1.5T data from carotid plaque MRI yields highly similar results on images obtained at 3T for classification of lipid-rich core, hemorrhage, calcification, and fibrous tissue. Although some subtle differences did occur, measurements of the major plaque components were highly consistent. From this, we infer that signal characteristics for the plaque components investigated here are similar at the two field strengths.
One difference that was observed, with marginal statistical significance, was a tendency for calcifications to be larger at 3T. This can be explained by the fact that calcifications induce a signal void, in part through susceptibility effects on the surrounding tissue. At 3T, susceptibility effects are greater and therefore the areas appear larger. This same difference was previously observed when images were evaluated manually (13).
Another subtle difference that was found was a transfer of hemorrhage classifications from type I to type II. The primary difference between these types is lysing of the red blood cells, resulting in extracellular accumulation of blood degradation products of various stages containing paramagnetic ferric iron, such as methemoglobin, ferritin, and hemosiderin (25). The susceptibility effect of the deposited iron is known to result in a decrease of MR signal and is more pronounced at 3T as compared to 1.5T (26). We therefore speculate that an increased susceptibility effect at 3T results in subtle changes of plaque tissue contrast such that more hemorrhages are classified to the older stage of their natural evolution. This difference may actually be an advantage of 3T imaging if distinguishing hemorrhage types proves clinically relevant.
A final notable difference was that regions were classified as loose matrix much more often at 3T than at 1.5T. Visually, these areas corresponded to regions of high signal intensity on T2-weighted images adjacent to the lumen, particularly prevalent at locations with relatively little plaque burden. The source of these regions of high signal may be associated with fatty streaks, which are characterized by macrophage infiltration, matrix proteins, and foam cell accumulation (27). These active, cellular regions have increased extracellular water that may lead to elevated signals on T2-weighted images that are more apparent at 3T due to higher signal-to-noise ratios.
In addition to the comparison between 1.5T and 3T results, this study also was the first head-to-head comparison of the MEPPS algorithm against manual results in moderate carotid atherosclerotic disease at 1.5T. Previously, MEPPS had been validated against a histological gold standard in advanced carotid endarterectomy patients (14). Whether the MEPPS results translated to a population with more moderate disease that did not meet the criteria for endarterectomy was uncertain.
Strong associations between manual and MEPPS measurements were observed at 1.5T, although notable bias in the measurements was found, specifically yielding smaller area measurements for necrotic core and calcification. We speculate that this bias is due to the methods having different approaches to integrating multiple contrast data. In manual review, the presence of a region is generally determined by intensity characteristics on all images, but the region boundaries are drawn based on the apparent region in a single contrast weighting. In MEPPS, the presence of a region is also determined by the intensity characteristics on all images, but the region boundaries are determined by the common area on all contrast weightings having similar intensity characteristics. Because of residual misregistration effects, the common area will generally be smaller than the area of the region on any one image.
Nevertheless, the manual and MEPPS results were closely correlated, suggesting both techniques would identify similar trends in longitudinal studies of plaque progression/regression. Similarly, if volumes of certain plaque components above a certain threshold prove to be associated with risk, both techniques should be capable of detecting these plaques; only the threshold might require slight adjustment. MEPPS and manual review showed similar performance in detecting locations with or without lipid-rich core, calcification, or hemorrhage, as evidenced by κ values greater than 0.6 (very good agreement). Correlation coefficients for average areas of these tissues and fibrous tissue were between 0.87 and 0.94, indicating that linear regression could provide equations to correct the MEPPS results to match the manual results with high accuracy.
The validation results also complement the findings of Ronen et al., who found that using 3 principal classifications – necrotic core, calcification, and fibrous – would yield substantially better classifier performance than models with more components, based on an ex vivo model (24). Our study found that the same 3 classes could be distinguished in vivo with high accuracy, but also found that necrotic core could be further divided into lipid-rich core and hemorrhage without substantially degrading performance. This result might arise because our study utilized time-of-flight images that are especially helpful for identifying intraplaque hemorrhage (4).
On the other hand, similar to Ronen et al., we found that division of fibrous regions into loose matrix and dense fibrous tissue severely degraded classifier performance. Likewise, performance for classifying hemorrhage into types I and II was marginal. This is not surprising given that these tissues are consistently the most difficult to accurately detect. In the original MEPPS manuscript, loose matrix area measurements had substantially lower correlations with histology for both manual (R2 = 0.33) and MEPPS (R2 = 0.41) analyses than necrotic core or calcification (R2 > 0.7 for all) (9). As reported by Saam et al., hemorrhage, calcification, and necrotic cores all had detection accuracies with κ in excess of 0.7, whereas that for loose matrix was only 0.51 (3). Chu et al. reported κ as low as 0.4 for one reviewer in distinguishing types of hemorrhage at 1.5T (4). Additionally, the MEPPS algorithm for hemorrhage area measurement was previously tested and found to have a correlation with histology (R) of 0.90 but had marginal performance for dividing hemorrhage by type, with a correlation as low as 0.62 for type II hemorrhage (28). Thus, we attribute the inability to achieve consistent results for loose matrix and hemorrhage subtypes to an inherent inability of this imaging protocol to separate these tissues. Fortunately, there is no clear clinical significance of loose matrix and although hemorrhage has been significantly associated with progression (15) and complications (23), hemorrhage subtypes are of unknown importance. Therefore, the difficulty in identifying loose matrix and hemorrhage subtypes is not a major drawback of vessel wall MRI.
A limitation of this study is the lack of an ex vivo gold standard to determine absolute accuracy. Instead, we utilized a well-documented manual image review procedure, that has been extensively validated against ex vivo references (3–7). In Saam et al., measurements of the fractional area of necrotic core, hemorrhage, and calcification all exhibited correlations with histology of 0.66 to 0.75 (3). One possibility is that the increased SNR at 3T could further improve accuracy. Using this protocol, we previously reported an increase in contrast-to-noise ratio of 13% – 36% at 3T compared to 1.5T, depending on contrast weighting (13). Without a histological reference, however, we cannot further investigate whether this affects accuracy.
An additional limitation was the need for some manual correction of the lumen and wall boundaries in a majority of cases and of the registration results in a small number of cases. However, the main purpose of this study was to evaluate the performance of the MEPPS algorithm, which was subsequently applied without any manual input. Furthermore, proper identification and alignment of the vessel boundaries can be expected from any appropriately trained reader, whereas manual interpretation of subtle features associated with different plaque components is much more difficult to translate to general practice. Thus, our findings regarding MEPPS performance should translate to any site appropriately trained to identify the vessel boundaries and align the multiple-contrast images.
In conclusion, signal features of lipid-rich cores, hemorrhage, calcification, and fibrous regions at 3T are sufficiently similar to 1.5T that the MEPPS algorithm has similar performance at both field strengths, despite being trained only on 1.5T data. This implies that the image characteristics developed at 1.5T to evaluate these components of carotid atherosclerotic plaque can be applied at 3T. An important caveat is that this conclusion only applies when comparing closely matched protocols of multiple-contrast spin-echo and gradient echo time-of-flight image acquisitions. Substantial changes in the acquisition protocols would likely require additional training of the algorithm at either field strength. If histological validation is available, such training would remain advisable at 3T even without changes in the protocol to ensure the best performance is achieved at 3T. Further sub-classification of the plaque beyond the four principal components met with more limited success both in comparing manual and automated classification and in comparing 1.5T and 3T results. Significant differences were observed in hemorrhage subtypes and loose matrix areas between field strengths. This suggests that use of an automatic classification system should be limited to lipid-rich cores, hemorrhage, calcification, and fibrous regions for best performance across field strengths.
Acknowledgments
NIH (R01-HL056874, R44-HL070576, P01-HL072262, R01-HL073401), Pfizer
References
- 1.Yarnykh VL, Terashima M, Hayes CE, et al. Multicontrast black-blood MRI of carotid arteries: comparison between 1.5 and 3 tesla magnetic field strengths. J Magn Reson Imaging. 2006;23:691–698. doi: 10.1002/jmri.20562. [DOI] [PubMed] [Google Scholar]
- 2.Alizadeh Dehnavi R, Doornbos J, Tamsma JT, et al. Assessment of the carotid artery by MRI at 3T: a study on reproducibility. J Magn Reson Imaging. 2007;25:1035–1043. doi: 10.1002/jmri.20904. [DOI] [PubMed] [Google Scholar]
- 3.Saam T, Ferguson MS, Yarnykh VL, et al. Quantitative evaluation of carotid plaque composition by in vivo MRI. Arterioscler Throm Vasc Biol. 2005;25:234–239. doi: 10.1161/01.ATV.0000149867.61851.31. [DOI] [PubMed] [Google Scholar]
- 4.Chu B, Kampschulte A, Ferguson MS, et al. Hemorrhage in the atherosclerotic carotid plaque: A high-resolution MRI study. Stroke. 2004;35:1079–1084. doi: 10.1161/01.STR.0000125856.25309.86. [DOI] [PubMed] [Google Scholar]
- 5.Yuan C, Mitsumori LM, Ferguson MS, et al. In vivo accuracy of multispectral magnetic resonance imaging for identifying lipid-rich necrotic cores and intraplaque hemorrhage in advanced human carotid plaques. Circulation. 2001;104:2051–2056. doi: 10.1161/hc4201.097839. [DOI] [PubMed] [Google Scholar]
- 6.Mitsumori LM, Hatsukami TS, Ferguson MS, et al. In vivo accuracy of multisequence MR imaging for identifying unstable fibrous caps in advanced human carotid plaques. J Magn Reson Imaging. 2003;17:410–420. doi: 10.1002/jmri.10264. [DOI] [PubMed] [Google Scholar]
- 7.Cai J, Hatsukami TS, Ferguson MS, et al. In vivo quantitative measurement of intact fibrous cap and lipid-rich necrotic core size in atherosclerotic carotid plaque: comparison of high-resolution, contrast-enhanced magnetic resonance imaging and histology. Circulation. 2005;112:3437–3444. doi: 10.1161/CIRCULATIONAHA.104.528174. [DOI] [PubMed] [Google Scholar]
- 8.Moody AR, Murphy RE, Morgan PS, et al. Characterization of complicated carotid plaque with magnetic resonance direct thrombus imaging in patients with cerebral ischemia. Circulation. 2003;107:3047–3052. doi: 10.1161/01.CIR.0000074222.61572.44. [DOI] [PubMed] [Google Scholar]
- 9.Luo Y, Polissar N, Han C, et al. Accuracy and uniqueness of three in vivo measurements of atherosclerotic carotid plaque morphology with black blood MRI. Magn Reson Med. 2003;50:75–82. doi: 10.1002/mrm.10503. [DOI] [PubMed] [Google Scholar]
- 10.Cappendijk VC, Cleutjens KB, Heeneman S, et al. In vivo detection of hemorrhage in human atherosclerotic plaques with magnetic resonance imaging. J Magn Reson Imaging. 2004;20:105–110. doi: 10.1002/jmri.20060. [DOI] [PubMed] [Google Scholar]
- 11.Cappendijk VC, Cleutjens KB, Kessels AG, et al. Assessment of human atherosclerotic carotid plaque components with multisequence MR imaging: initial experience. Radiology. 2005;234:487–492. doi: 10.1148/radiol.2342032101. [DOI] [PubMed] [Google Scholar]
- 12.Trivedi RA, U-King-Im JM, Graves MJ, et al. MRI-derived measurements of fibrous-cap and lipid-core thickness: the potential for identifying vulnerable carotid plaques in vivo. Neuroradiology. 2004;46:738–743. doi: 10.1007/s00234-004-1247-6. [DOI] [PubMed] [Google Scholar]
- 13.Underhill H, Yarnykh VL, Hatsukami TS, et al. Carotid Plaque Morphology and Composition: Initial Comparison between 1.5 and 3.0. Tesla Magnetic Field Strengths Radiology. doi: 10.1148/radiol.2482071114. In press. [DOI] [PMC free article] [PubMed] [Google Scholar]
- 14.Liu F, Xu D, Ferguson MS, et al. Automated in vivo segmentation of carotid plaque MRI with Morphology-Enhanced probability maps. Magn Reson Med. 2006;55:659–668. doi: 10.1002/mrm.20814. [DOI] [PubMed] [Google Scholar]
- 15.Takaya N, Yuan C, Chu B, et al. Presence of intraplaque hemorrhage stimulates progression of carotid atherosclerotic plaques: a high-resolution magnetic resonance imaging study. Circulation. 2005;111:2768–2775. doi: 10.1161/CIRCULATIONAHA.104.504167. [DOI] [PubMed] [Google Scholar]
- 16.Yarnykh VL, Yuan C. T1-insensitive flow suppression using quadruple inversion-recovery. Magn Reson Med. 2002;48:899–905. doi: 10.1002/mrm.10292. [DOI] [PubMed] [Google Scholar]
- 17.Yarnykh VL, Yuan C. Multislice double inversion-recovery black-blood imaging with simultaneous slice reinversion. J Magn Reson Imaging. 2003;17:478–483. doi: 10.1002/jmri.10278. [DOI] [PubMed] [Google Scholar]
- 18.Hayes CE, Mathis CM, Yuan C. Surface coil phased arrays for high-resolution imaging of the carotid arteries. J Magn Reson Imaging. 1996;6:109–112. doi: 10.1002/jmri.1880060121. [DOI] [PubMed] [Google Scholar]
- 19.Kerwin W, Xu D, Liu F, et al. MRI of carotid atherosclerosis: Plaque analysis. Topics in Magnetic Resonance. 2007;18:371–378. doi: 10.1097/rmr.0b013e3181598d9d. [DOI] [PubMed] [Google Scholar]
- 20.Saam T, Cai J, Ma L, et al. Comparison of symptomatic and asymptomatic atherosclerotic carotid plaque features with in vivo MR imaging. Radiology. 2006;240:464–472. doi: 10.1148/radiol.2402050390. [DOI] [PMC free article] [PubMed] [Google Scholar]
- 21.Murphy RE, Moody AR, Morgan PS, et al. Prevalence of complicated carotid atheroma as detected by magnetic resonance direct thrombus imaging in patients with suspected carotid artery stenosis and previous acute cerebral ischemia. Circulation. 2003;107:3053–3058. doi: 10.1161/01.CIR.0000074204.92443.37. [DOI] [PubMed] [Google Scholar]
- 22.Yamada N, Higashi M, Otsubo R, et al. Association between signal hyperintensity on T1-weighted MR imaging of carotid plaques and ipsilateral ischemic events. AJNR Am J Neuroradiol. 2007;28:287–292. [PMC free article] [PubMed] [Google Scholar]
- 23.Takaya N, Yuan C, Chu B, et al. Association between carotid plaque characteristics and subsequent ischemic cerebrovascular events: a prospective assessment with MRI--initial results. Stroke. 2006;37:818–823. doi: 10.1161/01.STR.0000204638.91099.91. [DOI] [PubMed] [Google Scholar]
- 24.Ronen RR, Clarke SE, Hammond RR, Rutt BK. Carotid plaque classification: defining the certainty with which plaque components can be differentiated. Magn Reson Med. 2007;57:874–880. doi: 10.1002/mrm.21214. [DOI] [PubMed] [Google Scholar]
- 25.Virmani R, Kolodgie FD, Burke AP, et al. Atherosclerotic plaque progression and vulnerability to rupture: angiogenesis as a source of intraplaque hemorrhage. Arterioscler Thromb Vasc Biol. 2005;25:2054–2061. doi: 10.1161/01.ATV.0000178991.71605.18. [DOI] [PubMed] [Google Scholar]
- 26.Allkemper T, Schwindt W, Maintz D, Heindel W, Tombach B. Sensitivity of T2-weighted FSE sequences towards physiological iron depositions in normal brains at 1.5 and 3.0 T. Eur Radiol. 2004;14:1000–1004. doi: 10.1007/s00330-004-2241-4. [DOI] [PubMed] [Google Scholar]
- 27.Stary HC, Chandler AB, Glagov S, et al. A definition of initial, fatty streak, and intermediate lesions of atherosclerosis. A report from the Committee on Vascular Lesions of the Council on Arteriosclerosis, American Heart Association. Circulation. 1994;89:2462–2478. doi: 10.1161/01.cir.89.5.2462. [DOI] [PubMed] [Google Scholar]
- 28.Liu F, Ferguson M, Chu B, et al. Intra-plaque hemorrhage quantification using morphology-enhanced probabilistic plaque segmentation (MEPPS) for in vivo carotid MRI. J Cardiovasc Magn Reson. 2007;9:389–390. [Google Scholar]