Abstract
PURPOSE
We recently developed a malignancy-risk gene signature that was shown to identify histologically-normal tissues with a cancer-like profile. Because the signature was rich with proliferative genes, we postulated it might also be prognostic for existing breast cancers. We evaluated the malignancy risk gene signature to see its clinical association with cancer relapse/progression, and cancer prognosis using six independent external datasets.
EXPERIMENTAL DESIGN
Six independent external breast cancer datasets were collected and analyzed using the malignancy risk gene signature designed to assess normal breast tissues.
RESULTS
Evaluation of the signature in external datasets suggested a strong clinical association with cancer relapse/progression, and prognosis with minimal overlap of signature gene sets.
CONCLUSION
These results suggest a prognostic role for the malignancy risk gene signature in the assessment of existing cancer. Proliferative biology dominates not only the earliest stages of tumor development but also later stages of tumor progression and metastasis.
Introduction
Predicting breast cancer risk in histologically-benign breast tissue has always been a challenge that has been relegated to the pathologist who must judge the risk of breast cancer based on the presence of histological abnormalities such as atypical ductal hyperplasia (ADH) and lobular carcinoma in situ (LCIS). Unfortunately, many breast cancers do not seem to be preceded by these characteristic lesions, and even when present, these are not uniformly predictive of cancer risk. For this reason, we developed a malignancy risk signature that identified histologically-normal, but molecularly-abnormal breast tissues with a invasive ductal cancer-like gene expression profile. The signature was found to show increased prevalence of expression from histolgically-normal tissue to ductal carcinoma in situ (DCIS) to invasive ductal carcinoma (IDC). Moreover, the signature was composed of genes markedly enriched for cell cycle and proliferative gene functions. For this reason, we postulated that the signature might be prognostic for existing breast cancers.
In this study, we evaluated the malignancy risk gene signature to see its clinical association with cancer relapse/progression, and cancer prognosis using 7 independent external datasets. To accomplish this goal, we had to identify microarray datasets with curated longitudinal clinical endpoints. We were able to then test the proficiency of the malignancy risk gene signature in predicting outcomes such as recurrence and survival using these datasets. We were also able to determine the degree of overlap of the malignancy risk gene set with any published gene sets prognostic for similar clinical endpoints, finding surprisingly little overlap amongst genes.
There is a need to better stratify breast cancer patients in order to better apply potentially toxic therapies for best therapeutic outcome. It is rational to predict that the genes linked to identifying patients at risk for harboring breast cancer may be the same as those predicting the progression of cancer.
Materials and Methods
Malignancy Risk Signature
We previously identified a malignancy risk gene signature that is capable of discerning molecularly-abnormal breast tissues that appear histologically-normal (1). One hundred and seventeen genes (140 probe sets: Table 1 and Supplementary Table 1) composed the signature that was principally proliferative in function, indicating a role in the earliest stages of breast tumor development. Its clinical association with cancer risk was validated by RTPCR and evaluated in two independent datasets. This signature has a number of potential clinical applications such as judging risk of breast cancer development following routine breast biopsy, judging the need for adjuvant radiotherapy after lumpectomy, and determining the need for completion mastectomy following lumpectomy for the breast cancer patient.
Table 1.
A subset of malignancy-risk genes associated with cancer relapse/progression and metastasis*.
| Affy probe set id | Gene Symbol | Turashvili et al | Chanrion et al | Ma et al | van ‘t Veer et al | Wang et al | Huang et al | Gene Title |
|---|---|---|---|---|---|---|---|---|
| 222608_s_at | ANLN | Y | Y | Y | anillin, actin binding protein (scraps homolog, Drosophila) | |||
| 202095_s_at | BIRC5 | Y | Y | Y | Y | baculoviral IAP repeat-containing 5 (survivin) | ||
| 209642_at | BUB1 | Y | Y | Y | Y | Y | BUB1 budding uninhibited by benzimidazoles 1 homolog (yeast) | |
| 203755_at | BUB1B | Y | Y | Y | Y | BUB1 budding uninhibited by benzimidazoles 1 homolog beta (yeast) | ||
| 214710_s_at | CCNB1 | Y | Y | Y | cyclin B1 | |||
| 202705_at | CCNB2 | Y | Y | Y | Y | Y | cyclin B2 | |
| 205034_at | CCNE2 | Y | Y | Y | Y | cyclin E2 | ||
| 203213_at | CDC2 | Y | Y | Y | Y | Cell division cycle 2, G1 to S and G2 to M | ||
| 203214_x_at | CDC2 | Y | Y | Y | Y | cell division cycle 2, G1 to S and G2 to M | ||
| 210559_s_at | CDC2 | Y | Y | Y | Y | cell division cycle 2, G1 to S and G2 to M | ||
| 1555758_a_at | CDKN3 | Y | Y | Y | Y | Y | cyclin-dependent kinase inhibitor 3 (CDK2-associated dual specificity phosphatase) | |
| 209714_s_at | CDKN3 | Y | Y | Y | Y | Y | cyclin-dependent kinase inhibitor 3 (CDK2-associated dual specificity phosphatase) | |
| 204962_s_at | CENPA | Y | Y | Y | Y | Y | centromere protein A, 17kDa | |
| 207828_s_at | CENPF | Y | Y | Y | Y | centromere protein F, 350/400ka (mitosin) | ||
| 218542_at | CEP55 | Y | Y | Y | chromosome 10 open reading frame 3 | |||
| 218252_at | CKAP2 | Y | Y | cytoskeleton associated protein 2 | ||||
| 203764_at | DLG7 | Y | Y | discs, large homolog 7 (Drosophila) | ||||
| 203358_s_at | EZH2 | Y | Y | Y | enhancer of zeste homolog 2 (Drosophila) | |||
| 213911_s_at | H2AFZ | Y | Y | Y | H2A histone family, member Z | |||
| 202503_s_at | KIAA0101 | Y | Y | Y | Y | KIAA0101 | ||
| 204709_s_at | KIF23 | Y | Y | Y | kinesin family member 23 | |||
| 202107_s_at | MCM2 | Y | Y | Y | MCM2 minichromosome maintenance deficient 2, mitotin (S. cerevisiae) | |||
| 204825_at | MELK | Y | Y | maternal embryonic leucine zipper kinase | ||||
| 204641_at | NEK2 | Y | Y | Y | Y | NIMA (never in mitosis gene a)-related kinase 2 | ||
| 201577_at | NME1 | Y | Y | Y | Y | non-metastatic cells 1, protein (NM23A) expressed in | ||
| 218039_at | NUSAP1 | Y | Y | Y | nucleolar and spindle associated protein 1 | |||
| 219978_s_at | NUSAP1 | Y | Y | nucleolar and spindle associated protein 1 | ||||
| 222077_s_at | RACGAP1 | Y | Y | Y | Y | Y | Rac GTPase activating protein 1 | |
| 201890_at | RRM2 | Y | Y | Y | ribonucleotide reductase M2 polypeptide | |||
| 209773_s_at | RRM2 | Y | Y | Y | ribonucleotide reductase M2 polypeptide | |||
| 209218_at | SQLE | Y | Y | Y | Y | Y | squalene epoxidase | |
| 1554408_a_at | TK1 | Y | Y | Y | Y | thymidine kinase 1, soluble | ||
| 202338_at | TK1 | Y | Y | Y | Y | thymidine kinase 1, soluble | ||
| 201291_s_at | TOP2A | Y | Y | Y | Y | topoisomerase (DNA) II alpha 170kDa | ||
| 201292_at | TOP2A | Y | Y | Y | Y | topoisomerase (DNA) II alpha 170kDa | ||
| 204822_at | TTK | Y | Y | Y | TTK protein kinase | |||
| 204026_s_at | ZWINT | Y | Y | Y | Y | ZW10 interactor |
: “Y” symbol was used to indicate the association of each malignancy-risk gene with cancer relapse/progression (Chanrion et al or Ma et al), or metastasis (van ‘t Veer et al, Wang et al, or Huang et al).
Evaluation of clinical association
We assessed the prognostic potential of the malignancy-risk score on six external independent data sets characterized with carefully annotated clinical data and longitudinal endpoints. Because each data set had a different set of available genes based on a number of different microarray platforms, we used whatever genes were in common with the malignancy gene signature to evaluate each data set (essentially a subset of the original malignancy risk gene signature). For binary clinical outcome (e.g., cancer relapse or relapse-free), the malignancy risk score based on the 1st PCA was used for comparison in two ways: (1) the continuous risk score and (2) a dichotomized risk score using the median risk score as a cutoff to dichotomize patients into two risk groups: (high risk with score >median and low risk with score<median). Statistical analysis included logistic regression, response operating characteristic (ROC) curve, support vector machine (SVM), as well as the univariate analysis. For survival outcome (e.g., time to metastasis), we used the continuous malignancy risk score and the median-cutoff binary risk score for data analysis. The Cox proportional hazard model was used to analyze the continuous risk score and the univariate analysis. Log-rank test and KM survival curves were used to compare two risk groups from the binary risk score. Supervised principal components method (SuperPCA): (2) was used to compare performance of various PCAs. This method calculated a standardized Cox score for each gene to rank its relevance to survival. For a given threshold of the Cox score, a subset of genes was selected to generate the first three PCAs as covariates for survival analysis. For this study, cross-validation was performed to compare these three PCAs to examine if the 1st PCA is sufficient to represent the malignancy-risk score. For ordinal clinical variables (e.g., from ADH, ductal carcinoma in situ (DCIS), to IDC), the continuous malignancy-risk score was used to correlate with cancer severity using Pearson correlation to evaluate the trend of the malignancy-risk gene signature with cancer progression. Analysis of variance was used to test the differences among the groups with the Tukey method (3) to adjust for p value for pair-wise comparison. We also used SVM analysis to evaluate the prediction performance.
Results
We assessed the malignancy-risk score on six external independent datasets. Statistical procedures were described in Methods Section. These external datasets permitted the evaluation of a number of properties of the malignancy-risk signature including differentiation of normal versus IDC, cancer relapse, progression, and cancer prognosis. (Table 2) is the summary analysis results for these datasets.
Table 2.
Summary table of the six external datasets for the clinical association of the malignancy-risk gene signature.
| Dataset | Sample size (n) | Endpoint | Statistics method | Test statistics | p value |
|---|---|---|---|---|---|
| Cancer risk | |||||
| Turashvili et al.’s IDC study | 10 | IDC versus normal | random effect model | p=0.029 | |
| Cancer relapse/progression | |||||
| Chanrion et al’s Tamoxifen-Treated Primary Breast Cancer | 155 | relapse of primary breast cancer | Continuous risk score: | ||
| 1. logistic regression | coefficient=0.137 | p<0.0001 | |||
| 2. ROC | AUC=0.81 | p<0.0001 | |||
| 3. SVM | Accuracy rate=74% | ||||
| 4. two-sample t-test | p<0.0001 | ||||
| Binary risk score: | |||||
| logistic regression | OR=8.16 | <0.0001 | |||
| Ma et al’s breast cancer study | 61 | histological status (ADH, DCIS, IDC) | correlation analysis | r=0.50 (Pearson or Spearman) | <0.0001 |
| logistic regression | OR (DCIS)=2.28 (compared to ADH) | p=0.016 | |||
| logistic regression | OR (IDC)=3.31 (compared to ADH) | p=0.008 | |||
| Prognosis | |||||
| van ‘t Veer et al’s breast metastasis dataset | training=78 test=263 | time to metastasis | Continuous risk score | ||
| log-rank test | X2=11.8 (training set); X2=20.4 (test set) | p=0.0006 (training);p<0.0001 (test) | |||
| Binary risk score: | |||||
| log-rank test | X2=12.2 (training set); X2=22.4 (test set) | p=0.0005 (training);p<0.0001 (test) | |||
| Wang et al’s breast cancer relapse free survival study | 286 | metastasis-free survival | Continuous risk score: | ||
| log-rank test | X2=12.8 | p=0.0004 | |||
| Binary risk score: | |||||
| log-rank test | X2=12.6 | p=0.0004 | |||
| Huang et al’s breast lymph node study | 37 | lynph node (pos vs. neg) | Continuous risk score: | ||
| 1. logistic regression | coefficient=0.2 | p=0.0107 | |||
| 2. ROC | AUC=0.75 | p=0.0041 | |||
| 3. SVM | Accuracy rate=73% | ||||
| 4. two-sample t-test | p=0.004 | ||||
| Binary risk score: | |||||
| logistic regression | OR=7.29 | p=0.007 |
Malignancy-risk gene signature association with IDC
Turashvili et al.’s IDC study (4)
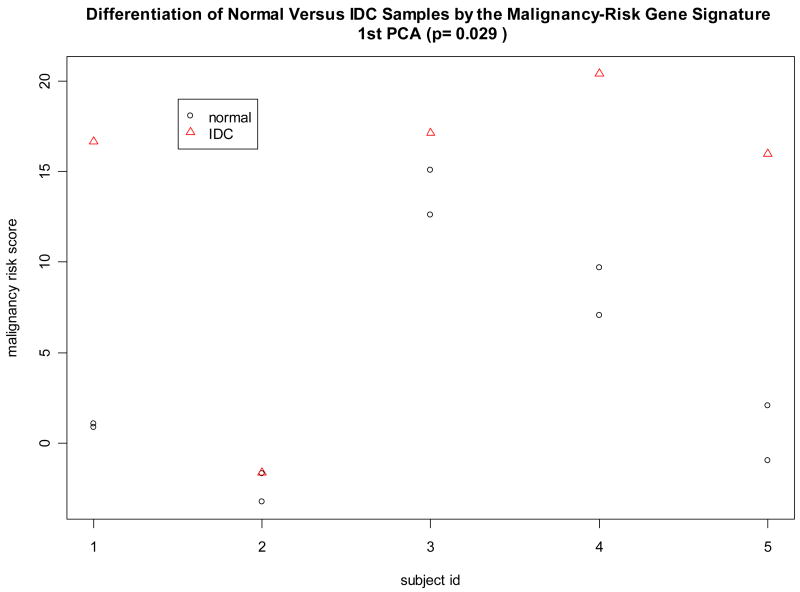
This study examined 5 IDC samples with 2 paired normal samples for each IDC (a total of 10 normal samples). Because this study used the same microarray platform (1), all malignancy-risk gene probe sets were available in this data set to calculate the malignancy risk score for the 5 IDCs and the associated 10 normal breast tissues. Since this was a matched design (paired normal with IDC), conditional logistic regression was initially used, but failed to converge due to strong separation of the risk score between the normal and IDC groups. For this reason, the random effect model was used to test a difference of the risk score between IDC versus normal tissues while adjusting for pairing information (i.e., subject variation). Data analysis showed the malignancy risk score was higher in IDC than in normal tissue within the same patient (p value=0.029) (Figure 1). Univariate analysis also yielded 25 malignancy-risk genes with p values<0.05 (Supplementary Figure 1). These data support a strong association of the malignancy risk score with IDC. Note that the use of other PCAs (the 2nd PCA and the 3rd PCA) to calculate the risk score did not show differentiation of the risk score between normal versus IDC samples (Supplementary Figure 1).
Figure 1. Classification of normal and IDC tissues in Turashvili et al’s study.
Cancer relapse/progression
Chanrion et al’s relapse study (5)
There were 155 patients (52 patients with relapse (R) and 103 patients who were relapse-free (RF)) who received adjuvant tamoxifen. The primary tumors from these patients were analyzed for expression profiles and a 36-gene signature was developed. In this study, we examined the malignancy-risk gene signature to see if it had comparable performance to the 36-gene signature to classify patients with relapse. The study used 70-mer oligonucleotide microarrays (22,656 genes) for expression profiles.
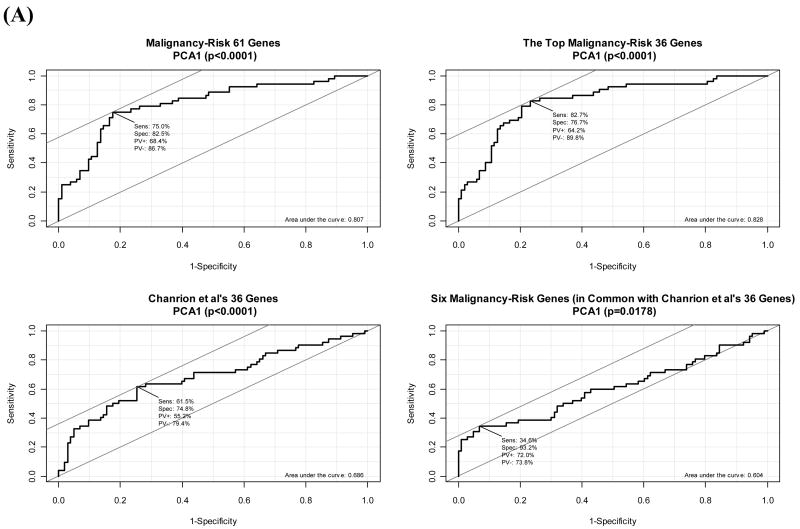
There were 61 genes in common with the platform for the malignancy risk gene signature. Among these 61 malignancy-risk genes, there were only six genes in common with the Chanrion et al’s 36-gene signature. We compared the malignancy-risk gene signature (61 genes in common), the top 36 malignancy-risk genes (based on univariate analysis), Chanrion et al’s 36-gene signature, and the six malignancy-risk genes (in common with the Chanrion et al’s 36-gene signature).
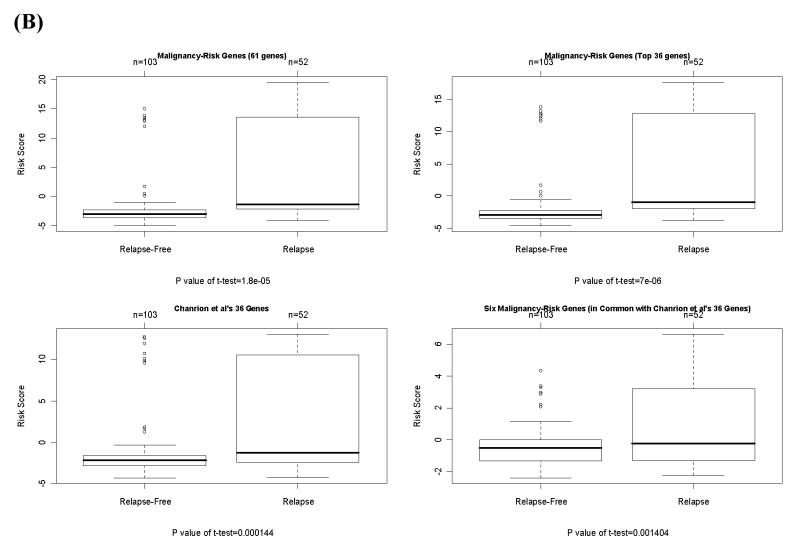
The four gene signatures showed a statistically significant association with the relapse of breast cancer in the logistic regression model (Table 2 and Supplementary Figure 2). The continuous risk score yielded a statistically significant coefficient estimate (0.14–0.35 with p<0.0005). The area under curve (AUC) for ROC curve ranged 0.60 to 0.83 with p<0.05 (Figure 2). The accuracy rate by SVM was similar, 72%–74% (Supplementary Figure 2). The two sample t-test also showed a statistically significant difference of risk score between relapse group versus relapse-free group (p≤0.005) (Figure 2). For the dichotomized risk score, the odds ratio (OR) ranged 2.99 to 11.67 with p<0.005 for the first three gene signatures. Evaluation of other PCAs in the malignancy-risk gene signature showed that inclusion of the 2nd PCA and the 3rd PCA in the model showed little improvement in AUC and accuracy rate (Supplementary Figure 2). In the univariate analysis based on two-sample t-test, there were 50 out of the 61 malignancy-risk genes (50/61=82%) with p<0.05 (in contrast to 60% genes with p<0.05 when using all the 22,656 genes; see Supplementary Figure 2).
Figure 2. Classification of relapse of tamoxifen-treated primary breast cancers.
(A) Comparison of ROC curve of the malignancy risk score among the four gene signatures. (B) Distribution of the malignancy-risk scores among the two groups, relapse and relapse-free.
Ma et al’s breast cancer study (6)
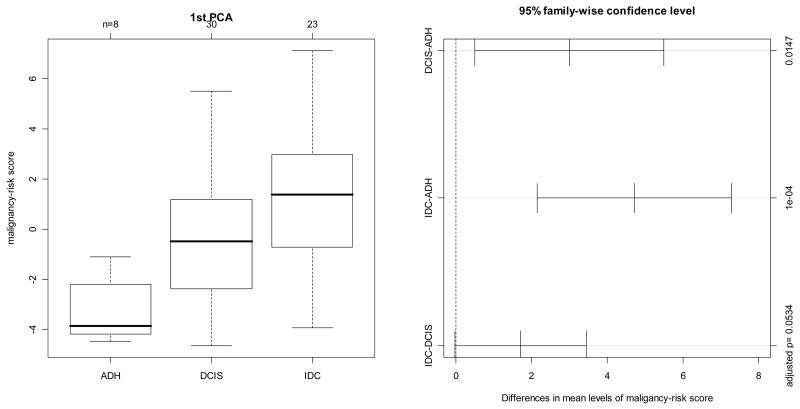
The study collected 8 ADH, 30 DCIS, and 23 IDC samples. There were 21 genes profiled in this study that were in common with the malignancy-risk gene signature, and were used to calculate the malignancy risk genes. Correlation analysis showed an increasing pattern of the risk score with cancer progression from ADH to IDC (Figure 3). Pearson or Spearman correlation coefficient was 0.5, with a significant p value<0.0001 by ranking the cancer status from 1 to 3 for ADH to IDC. Pair-wise comparison showed that the risk score was significantly different between IDC/DCIS and ADH (adjusted p value=0.0001, and 0.0147 for IDC and DCIS, respectively; Figure 3). Further analysis using logistics regression model (with the ADH group as the control group) demonstrated a strong association of the risk score with cancer status (OR=2.28 and 3.31 for DCIS and IDC with p value=0.016 and 0.008, respectively). In addition, we evaluated the prediction performance on the DCIS samples. A SVM classifier was built with an accuracy rate of 81% by leave-one-out-cross-validation. The classifier predicted most of the 30 DCIS samples to be in the IDC category (26/30) and a few DCIS cases favoring to ADH group (4/30) (Supplementary Figure 3). We also compared the malignancy risk score generated by PCA1 (1st PCA) versus other PCAs (2nd PCA and 3rd PCA). In contrast to PCA1 showing a cancer progression pattern, the 2nd PCA and the 3rd PCA did not demonstrate cancer progression from ADH to IDC (Supplementary Figure 3). Univariate analysis by Pearson correlation yielded 16 malignancy-risk genes with a p value <0.05 (Supplementary Figure 3).
Figure 3. Cancer progression in Ma et al’s study by comparison of the malignancy-risk score among AHD, DCIS, and IDC.
The first panel displayed distribution of the malignancy-risk score among the three groups: ADH, DCIS, and IDC. The 2nd panel was 95% confidence interval of pair-wise comparison for the risk score among the three groups with adjusted p value in the right-hand side’s y axis.
Cancer Prognosis
van ‘t Veer et al’s breast metastasis dataset (7)
This study collected one training set (a total of 78 breast cancer patient samples) and one test set (n= 295 patients, including 32 patients from the training set), with the time to metastasis as the clinical outcome, to develop a 70 gene signature. In our study, we used the training set (n=78) and the test set which excluded the 32 patients from the training set (n=263) to examine if the malignancy-risk genes could predict metastasis.
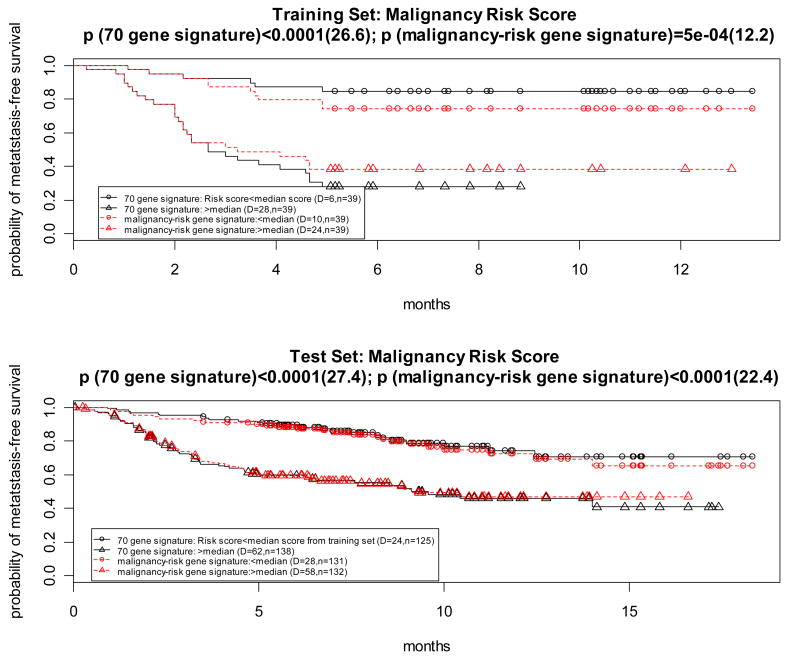
There were 117 features that could be utilized to test with the malignancy-risk gene signature. Among them, there were 7 genes in common (Supplementary Figure 4) between the reported 70 gene signature and the malignancy risk gene signature. We compared performance of survival analysis for the 3 gene signatures (malignancy-risk signature, 70 gene signature, and 7 genes in common) based on the malignancy risk score. For the dichotomized risk score, we used median of the risk score as cutoff to dichotomize the 78 patients (training set) into two risk groups. The median cutoff of the risk score from the training set was also used to dichotomize the patients into two risk groups for the test set (n=263). Log-rank test and KM survival curves were used to compare the two risk groups for both datasets (training and test sets). The risk score was calculated in the same way for the 70 gene signature and 7 common genes, respectively.
The three gene signatures showed a statistical association with metastasis in both training and test sets (Table 2). For example, the three gene signatures performed well to separate survival curves of the two risk groups (Figure 4 and Supplementary Figure 4) for both datasets (training and test sets). The 70 gene signature performed the best because the signature was derived from the dataset (Figure 4). However, the performance for the malignancy-risk signature was comparable to the 70 gene signature, especially in the test set (χ2=12.2 with p=0.0005 for the training data; and χ2=22.4 with p<0.0001 for the test data). Even when limited to the 7 genes in common, it also had a comparable performance (Supplementary Figure 4). For comparison of various PCAs, analysis by SuperPCA showed that the model with the 1st PCA outperformed the other two models (2 PCAs and 3 PCAs), suggesting the 1st PCA was sufficient to represent the malignancy-risk score (Supplementary Figure 4). Univariate analysis by the Cox proportional hazards model showed 48 malignancy-risk genes with a p value<0.05 in both training and test sets (Supplementary Figure 4).
Figure 4. Prognostic feature in van ‘t Veer et al’s breast metastasis dataset.
Wang et al’s breast cancer relapse free survival study (8)
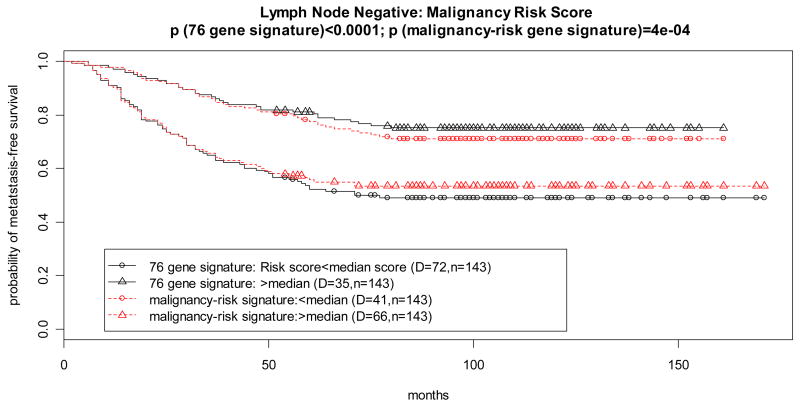
The dataset includes 286 lymph-node negative breast patients with metastasis-free survival as clinical endpoint. A 76 gene signature was derived from this dataset (7) to predict distant metastasis. There were 102 probe sets (from the ~20K probe sets) in common with the malignancy risk gene signature. There were only 4 genes in common (Supplementary Table 1 and Supplementary Figure 5) between the 76 gene signature and the malignancy risk gene signature. We compared the 3 gene signatures (malignancy-risk signature, 76 gene signature, and 4 genes in common) based on the malignancy risk score.
Results
The three gene signatures performed well to show their statistically significant association with breast cancer relapse free survival either in the continuous risk score or in the dichotomized risk score (Table 2 and Supplementary Figure 5). For example, survival curves of the two risk groups were well separated (Figure 5 and Supplementary Figure 5) for the dichotomized risk score. The 76 gene signature performed the best because the signature was derived from this dataset. However, the performance for the malignancy-risk signature (χ2=12.6; p=0.0004) was almost comparable to the 76 gene signature. Even for the 4 genes in common, it also had a comparable performance (Supplementary Figure 5). For comparison of various PCAs, analysis by SuperPCA showed that a cross-validation curve by the 1st PCA reached above the statistically significant level (Supplementary Figure 5). While inclusion of the 2nd PCA and the 3rd PCA in the model also showed statistical significance, most was contributed by the 1st PCA (Supplementary Figure 5). Univariate analysis yielded 64 malignancy-risk genes (of the 102 genes) with p value <0.05 (Supplementary Figure 5).
Figure 5. Prognostic feature in breast cancer relapse free survival.
Huang et al’s breast lymph node study (9)
This breast cancer microarray data included 18 patients with positive lymph node (LN) and 19 patients with negative LN. There were 112 probe sets from this dataset in common with the IDC-like normal gene signature. The malignancy risk score was generated using the 1st PCA from the 112 probe sets. Results: Logistic regression model showed both a statistically significant association of the malignancy risk score with the LN status (Table 2). The continuous risk score yielded a statistically significant coefficient estimate, 0.20, with p=0.0107. The area under curve (AUC) for ROC curve was 0.75 (Figure 6). For the dichotomized risk score, the odds ratio was 7.29 with p=0.007 and an accuracy rate of 73%. SVM gave the same accuracy rate (Supplementary Figure 6). Similarly, two sample t-test showed a statistically significant difference of risk score between positive LN versus negative LN (p= 0.004) (Figure 6). In addition, we included the 2nd PCA and the 3rd PCA in the model for analysis. Results showed little improvement in AUC, but had some improvement in accuracy rate for the first 3 PCAs (from 73% to 84%) (Supplementary Figure 6). Univariate analysis by two-sample t-test showed 34 probe sets (34/122=30%) with p<0.05 (Note that three genes, CDC2, NME1, and TOP2A, had three probe sets per gene with p<0.05) Supplementary Table 1 and Supplementary Figure 6). In contrast, there were only 7% genes (912 out of 12625 probe sets) with p<0.05 when using all probe sets. Fisher exact test showed a highly statistical significance (p<0.0001), indicating that it is unlikely by chance to have such large proportion of significant genes (30%).
Figure 6. Evaluation of the malignancy-risk gene signature for breast lymph node development in Huang’s breast study.
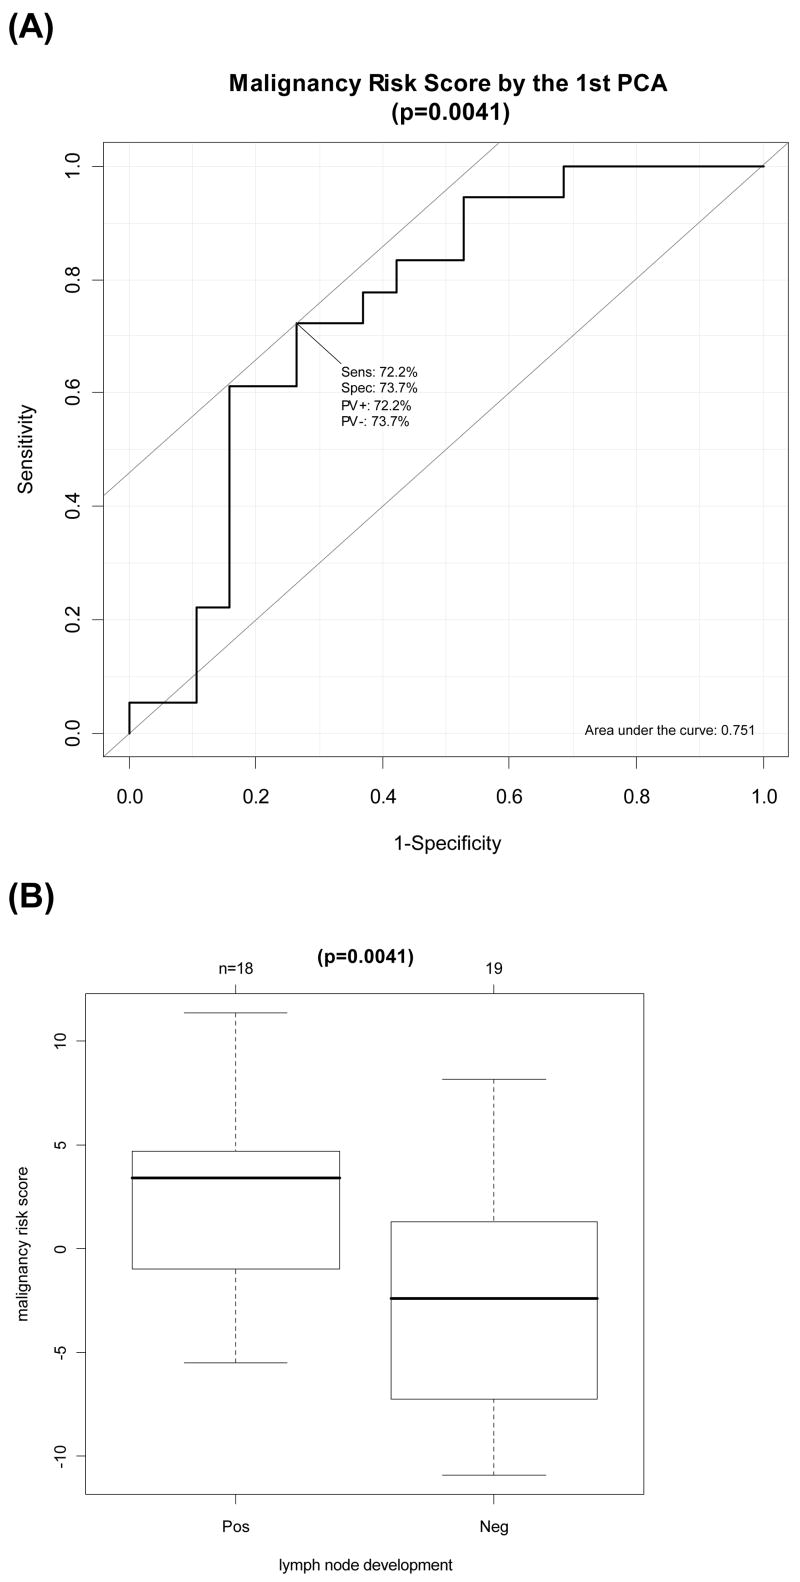
(A) Area Under Curve (AUC) Calculation for Response Operating Characteristic Curve for the first PCA (p=0.0041). (B) Difference of the malignancy risk score between positive LN versus negative LN (p=0.0041).
Discussion
While the malignancy-risk gene signature may be principally useful to assess cancer risk, we explored its property in a broader scope. Evaluation on the six external independent datasets demonstrated the clinical relevance of the malignancy-risk gene signature not only to cancer risk, but also to cancer relapse/progression, and prognosis.
In the Turashvili et al. study (3), we verified that the malignancy-risk genes identified in the ‘IDC-like’ normal tissues were highly associated with invasive ductal carcinomas (IDC). Our results showed that the malignancy-risk gene signature was able to differentiate the IDC and normal tissues not linked to cancer, confirming the malignancy-risk genes as a subset of IDC tumor associated genes.
In the Chanrion et al’s study (5), we tested the malignancy-risk gene signature for its prediction ability on primary breast cancer relapse. Evaluation results showed that the malignancy-risk gene signature had comparable performance to the Chanrion et al’s 36-gene signature to classify patients with cancer relapse. Interestingly, there were only six malignancy-risk genes in common with the 36-gene signature. In contrast, many significant malignancy-risk genes not in the 36-gene signature were proliferative genes (e.g., BUB1B, CCNB1, MCM2, and TOP2A).
We tested the malignancy risk gene signature on Ma et al’s data (6) to evaluate its clinical relevance to cancer progression. We considered cancer risk as a continuous spectrum with normal tissue in the lower end and IDC tissue at the higher end. Since ADH and DCIS have been shown as precursors of IDC, we ascertained whether the malignancy risk gene signature exhibited a progressive trend from normal to IDC with ADH and DCIS as intermediate stages in the cancer risk spectrum. The existence of a strong trend with these features would provide a compelling evidence for the application of this signature on early prevention of cancer development. Results showed an increasing pattern of the malignancy-risk score with cancer progression from ADH to IDC. There were 16 malignancy-risk genes with an increasing expression pattern from ADH to IDC. Perhaps not surprisingly, the majority of these genes are known to be involved in the cell cycle. Since these genes were highly associated with cell proliferation and exhibited expression changes that were proportional to disease stage, these genes might be risk genes (precursor genes) useful in predicting cancer development and recurrence.
The last validation assessment of the malignancy-risk gene signature was to test its prognostic feature. Since patients with high cancer risk are likely to develop metastasis, the malignancy-risk genes may play a key role for cancer development. Validation results of the three datasets (van ‘t Veer et al’s breast metastasis study (7), Wang et al’s breast cancer relapse free survival study (8), Huang et al’s breast lymph node study (9)) supported the hypothesis. The malignancy-risk gene signature performed well to show the statistically significant association with metastasis and lymph node development. The performance was comparable to the van ‘t Veer et al’s and Wang et al’s gene signatures. Again, there were only a few malignancy-risk genes in common with the two gene signatures.
In summary, we have developed a gene signature that has value in predicting both risk of cancer development as well as risk of cancer progression and metastasis. The signature hinges on genes with proliferative function, suggesting that the cell cycle plays a role both early and late in the spectrum of cancer.
Supplementary Material
Classification of normal and IDC tissues in Turashvili et al’s study. (A) Differentiation of normal versus IDC samples by the malignancy risk gene signature (B) Malignancy-risk genes with p value. (C) Comparison of the 2nd PCA and the 3rd PCA
Relapse of tamoxifen-treated primary breast cancers. (A) ROC curve of the malignancy risk score (1st PCA) (B) SVM classification the malignancy risk score (1st PCA) (C) Distribution of malignancy-risk score (1st PCA) among the two groups, relapse and relapse-free with two sample t-test). (D) ROC curve of malignancy-risk genes for the first two PCAs and the first three PCAs (E) SVM classification of the malignancy-risk genes for the first two PCAs (PCAs=2) and the first three PCAs (PCAs=3) (F) Univariate analysis for the four malignancy-risk genes in common with the Chanrion et al’s 36 gene signature (G) Summary of statistical analysis results (H) Gene list with p<0.05
External evaluation for cancer progression in Ma et al’s study (A) malignancy-risk genes with p value<0.05 (B) Comparison of the malignancy-risk score among AHD, DCIS and IDC (C) SVM classification of DCIS samples (D) Comparison of various PCAs
Evaluation to assess prognostic feature in van’t Veer et al’s breast metastasis dataset (A) Univariate Cox proportional hazards model for the 7 genes in common with the malignancy-risk signature (B) Summary of performance of the three gene signatures (C) Summary of the first three PCAs in the Cox proportional hazards model for the malignancy-risk genes (117) by the superPCA method (D) Malignancy-risk genes with p value<0.05 in both training and test sets using univariate Cox proportional hazards model (E) Comparison of the malignancy-risk gene signature and the Van’t veer’s 70 gene signature (F) Performance of the 4 malignancy-risk genes in common with the Van’t veer’s 70 genes (G) Comparison of various PCA using superPCA method
Evaluation to assess prognostic feature in breast cancer relapse free survival (GEO: GSE2034) (A) Univariate Cox proportional hazards model for the four malignancy-risk genes in common with Wang et al’s 76-gene signature (B) Summary of performance of the three gene signatures (C) Summary of the first three PCAs in the Cox proportional hazards model for the malignancy-risk genes (102) by the super PCA method (D) Univariate Cox proportional hazards model for the 102 malignancy-risk genes with p value <0.05 (E) Comparison of the malignancy-risk gene signature and the Wang et al’s 76 gene signature (F) Performance of the 4 genes (in common with the malignancy-risk gene signature and the Wang et al’s 76 gene signature) (G) Comparison of various PCAs by SuperPCA method
Evaluation for breast lymph node development in Huang’s breast study (A) Gene list (34 probe sets) with p value <0.05 (B) Area Under Curve (AUC) Calculation for Response Operating Characteristic Curve for the first PCA (C) SVM classification of positive lymph node by the 1st PCA (D) Difference of the malignancy risk score between positive LN versus negative LN (E) Area under Curve (AUC) Calculation for Response Operating Characteristic Curve for the first two PCAs and the first three PCAs (F) SVM classification of positive lymph node by the 1st two PCAs and the 1st three PCAs
Malignancy-risk gene list.
Acknowledgments
This work was supported by grants from the National Institutes of Health (RO1CA 098522, R01CA112215, and P30CA76292). We thank Magaly Mendez for assistance in manuscript preparation. The authors gratefully acknowledge the helpful comments by anonymous referees.
References
- 1.Chen D-T, Nasir A, Culhane A, Venkataramu C, Fulp W, Rubio R, et al. Proliferative genes dominate malignancy-risk signature in histologically normal breast tissue. Breast Cancer Research Treatment. 2009 doi: 10.1007/s10549-009-0344-y. [DOI] [PMC free article] [PubMed] [Google Scholar]
- 2.Bair E, Tibshirani R. Semi-supervised methods to predict patient survival from gene expression data. PLoS Biol. 2004;2(4):E108. doi: 10.1371/journal.pbio.0020108. [DOI] [PMC free article] [PubMed] [Google Scholar]
- 3.Miller RG. Simultaneous Statistical Inference. Springer; 1981. [Google Scholar]
- 4.Turashvili G, Bouchal J, Baumforth K, Wei W, Dziechciarkova M, Ehrmann J, et al. Novel markers for differentiation of lobular and ductal invasive breast carcinomas by laser microdissection and microarray analysis. Bmc Cancer. 2007:7. doi: 10.1186/1471-2407-7-55. [DOI] [PMC free article] [PubMed] [Google Scholar]
- 5.Chanrion M, Negre V, Fontaine H, Salvetat N, Bibeau F, Mac Grogan G, et al. A gene expression signature that can predict the recurrence of tamoxifen-treated primary breast cancer. Clin Cancer Res. 2008;14(6):1744–52. doi: 10.1158/1078-0432.CCR-07-1833. [DOI] [PMC free article] [PubMed] [Google Scholar]
- 6.Ma XJ, Salunga R, Tuggle JT, Gaudet J, Enright E, McQuary P, et al. Gene expression profiles of human breast cancer progression. Proceedings of the National Academy of Sciences of the United States of America. 2003;100(10):5974–5979. doi: 10.1073/pnas.0931261100. [DOI] [PMC free article] [PubMed] [Google Scholar]
- 7.van de Vijver MJ, He YD, van ‘t Veer LJ, Dai H, Hart AAM, Voskuil DW, et al. A gene-expression signature as a predictor of survival in breast cancer. New England Journal of Medicine. 2002;347(25):1999–2009. doi: 10.1056/NEJMoa021967. [DOI] [PubMed] [Google Scholar]
- 8.Wang Y, Klijn JG, Zhang Y, Sieuwerts AM, Look MP, Yang F, et al. Gene-expression profiles to predict distant metastasis of lymph-node-negative primary breast cancer. Lancet. 2005;365(9460):671–9. doi: 10.1016/S0140-6736(05)17947-1. [DOI] [PubMed] [Google Scholar]
- 9.Huang E, Cheng SH, Dressman H, Pittman J, Tsou MH, Horng CF, et al. Gene expression predictors of breast cancer outcomes. Lancet. 2003;361(9369):1590–6. doi: 10.1016/S0140-6736(03)13308-9. [DOI] [PubMed] [Google Scholar]
Associated Data
This section collects any data citations, data availability statements, or supplementary materials included in this article.
Supplementary Materials
Classification of normal and IDC tissues in Turashvili et al’s study. (A) Differentiation of normal versus IDC samples by the malignancy risk gene signature (B) Malignancy-risk genes with p value. (C) Comparison of the 2nd PCA and the 3rd PCA
Relapse of tamoxifen-treated primary breast cancers. (A) ROC curve of the malignancy risk score (1st PCA) (B) SVM classification the malignancy risk score (1st PCA) (C) Distribution of malignancy-risk score (1st PCA) among the two groups, relapse and relapse-free with two sample t-test). (D) ROC curve of malignancy-risk genes for the first two PCAs and the first three PCAs (E) SVM classification of the malignancy-risk genes for the first two PCAs (PCAs=2) and the first three PCAs (PCAs=3) (F) Univariate analysis for the four malignancy-risk genes in common with the Chanrion et al’s 36 gene signature (G) Summary of statistical analysis results (H) Gene list with p<0.05
External evaluation for cancer progression in Ma et al’s study (A) malignancy-risk genes with p value<0.05 (B) Comparison of the malignancy-risk score among AHD, DCIS and IDC (C) SVM classification of DCIS samples (D) Comparison of various PCAs
Evaluation to assess prognostic feature in van’t Veer et al’s breast metastasis dataset (A) Univariate Cox proportional hazards model for the 7 genes in common with the malignancy-risk signature (B) Summary of performance of the three gene signatures (C) Summary of the first three PCAs in the Cox proportional hazards model for the malignancy-risk genes (117) by the superPCA method (D) Malignancy-risk genes with p value<0.05 in both training and test sets using univariate Cox proportional hazards model (E) Comparison of the malignancy-risk gene signature and the Van’t veer’s 70 gene signature (F) Performance of the 4 malignancy-risk genes in common with the Van’t veer’s 70 genes (G) Comparison of various PCA using superPCA method
Evaluation to assess prognostic feature in breast cancer relapse free survival (GEO: GSE2034) (A) Univariate Cox proportional hazards model for the four malignancy-risk genes in common with Wang et al’s 76-gene signature (B) Summary of performance of the three gene signatures (C) Summary of the first three PCAs in the Cox proportional hazards model for the malignancy-risk genes (102) by the super PCA method (D) Univariate Cox proportional hazards model for the 102 malignancy-risk genes with p value <0.05 (E) Comparison of the malignancy-risk gene signature and the Wang et al’s 76 gene signature (F) Performance of the 4 genes (in common with the malignancy-risk gene signature and the Wang et al’s 76 gene signature) (G) Comparison of various PCAs by SuperPCA method
Evaluation for breast lymph node development in Huang’s breast study (A) Gene list (34 probe sets) with p value <0.05 (B) Area Under Curve (AUC) Calculation for Response Operating Characteristic Curve for the first PCA (C) SVM classification of positive lymph node by the 1st PCA (D) Difference of the malignancy risk score between positive LN versus negative LN (E) Area under Curve (AUC) Calculation for Response Operating Characteristic Curve for the first two PCAs and the first three PCAs (F) SVM classification of positive lymph node by the 1st two PCAs and the 1st three PCAs
Malignancy-risk gene list.


