

Abstract
We present a metabolically regulated model of cardiac active force generation with which we investigate the effects of ischemia on maximum force production. Our model, based on a model of cross-bridge kinetics that was developed by others, reproduces many of the observed effects of MgATP, MgADP, Pi, and H+ on force development while retaining the force/length/Ca2+ properties of the original model. We introduce three new parameters to account for the competitive binding of H+ to the Ca2+ binding site on troponin C and the binding of MgADP within the cross-bridge cycle. These parameters, along with the Pi and H+ regulatory steps within the cross-bridge cycle, were constrained using data from the literature and validated using a range of metabolic and sinusoidal length perturbation protocols. The placement of the MgADP binding step between two strongly-bound and force-generating states leads to the emergence of an unexpected effect on the force-MgADP curve, where the trend of the relationship (positive or negative) depends on the concentrations of the other metabolites and [H+]. The model is used to investigate the sensitivity of maximum force production to changes in metabolite concentrations during the development of ischemia.
Introduction
For the heart to fulfill its function as a pump, its musculature must cyclically develop force, shorten, and relax. This cycle is achieved by the expenditure of metabolic energy via pathways, the end-products of which are inhibitory to the cycle. Such inhibition becomes particularly crucial during periods of hypoxia or ischemia when the reduction in supply of adenosine triphosphate (ATP) from mitochondrial oxidative phosphorylation, and the attendant accumulation of inorganic phosphate (Pi), adenosine diphosphate (ADP), and protons may interfere with the cyclic interactions between actin monomers and myosin heads protruding from the thick filaments (1).
Our aim is to develop a thermodynamically consistent and metabolite-sensitive model of cardiac cross-bridge cycling to explore the influence of these metabolites on force production under physiological and ischemic conditions. There are a number of criteria that such a model must meet. The cycling action of cross-bridges is driven by the free energy released from the hydrolysis of ATP into ADP and Pi (i.e., free energy transduction). Firstly, therefore, the model must incorporate a free energy-transducing thermodynamic cycle, with pathways that allow it to be driven in both forward and backward directions (2). This excludes fading-memory models that do not explicitly represent the cross-bridge cycle (3,4). Secondly, the model must be thermodynamically consistent as defined by Hill (5), where a constraint is introduced to relate the rate constants of the model to the free energy of ATP hydrolysis. Thirdly, the model must explicitly incorporate the regulatory effects of MgATP and its hydrolysis products, MgADP, Pi, and H+. Sliding-filament models, derived from the seminal work of Huxley (6), are based on strain-dependent distributions of cross-bridge populations, and have been extended to include metabolite interactions (7). However, the explicit representation of a spatial dimension (cross-bridge strain) requires the solution of partial differential equations (PDEs), which renders them computationally expensive and not ideal for integrating into cell or tissue models. More recently, mean-field models have been proposed that ignore the microscopic details of cross-bridge population distributions and, instead, ascribe the behavior of the entire cross-bridge population to an average cross-bridge cycle, removing the need for PDEs.
In this study, we extend the recent mean-field model by Rice et al. (8) such that it conforms to the criteria listed above. The Rice et al. (8) model describes Ca2+ activation and cross-bridge cycling kinetics and can reproduce a range of myofilament behavior including length- and temperature-dependent effects. This model provides a foundation onto which a biochemical scheme of ATP hydrolysis is integrated to develop a thermodynamically consistent and metabolite-sensitive model of cross-bridge cycling kinetics (which we denote as the Extended Model). The Extended Model introduces three new parameters that are fitted using cardiac data from the literature and validated against a range of metabolic and sinusoidal length change protocols. The model is then used to investigate the effects of changing metabolite concentrations, observed after the onset of ischemia, on the development of active force.
Methods
A schematic of the four-state model by Rice et al. (8) is shown in Fig. 1 A. Rice et al. parameterized their model for rat cardiac tissue, and include a parameter xbmodspecies (which multiplies all rate constants) to adjust to different species. Consistent with our previous studies (9–11), we develop a model parameterized for guinea pig myocardium, setting xbmodspecies = 0.2, effectively slowing the kinetics by fivefold from rat, following the findings of Palmer and Kentish (12). We parameterize and validate against guinea pig data where possible.
Figure 1.
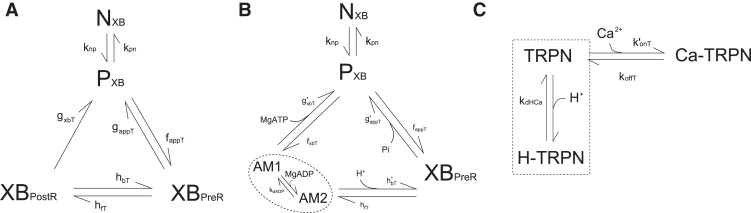
(A) Original model from Rice et al. (8). (B) The original model is modified to include metabolite dependence (i.e., Extended Model). AM1 and AM2 are two strongly-bound rapid-equilibrium states (dotted ellipse). The rate constants g′appT, g′xbT, and h′bT are true first-order rate constants that are independent of metabolite concentrations whereas gappT, gxbT, and hbT from the original model are pseudo-first-order rate constants that are assumed to be implicit functions of MgATP, MgADP, Pi, and H+ (see text for details.) (C) Schematic of the competitive binding of H+ to the Ca2+ binding site on troponin C. TRPN and H-TRPN are assumed to be in rapid-equilibrium (dotted rectangle). The on-rate for Ca2+ binding, k′onT, is modified to include the H+ regulation.
The original model implicitly assumes that cross-bridge cycling is irreversible by omitting a reverse step between states PXB and XBpostR. To account for the full (reversible) thermodynamic cycle we add a reverse transition step, fxbT (Fig. 1 B), to allow transitions from state P back to state XBpostR, representing the release of MgATP as the myosin-head transitions from a weakly attached state back to a strongly attached state. The value of fxbT is determined by the thermodynamic constraint that links the rate constants in the cycle to the hydrolysis of MgATP (5),
| (1) |
where αi+ and αi− are the pseudo first-order forward and backward rate constants for state i and
| (2) |
where ΔG0ATP is the standard free energy of MgATP hydrolysis and H+ is the proton released during ATP hydrolysis, which we label the metabolic proton. (The equation for fxbT is given in the Appendix.)
Metabolite dependencies are incorporated into the transition rates between steps of the cycle using mass-action kinetics. We will assume that normal physiological metabolic conditions are given by MgATP = 5 mM, MgADP = 36 μM, Pi = 2 mM, and pH = 7.15, and that the parameters and outputs from Rice et al. (8) correspond to these conditions.
MgATP
The binding of MgATP in striated muscle detaches the cross-bridge from the strongly-bound state after execution of the power stroke (13–16). Measurements of isometric force have shown a descending trend with increasing concentrations of MgATP, consistent with the dissociation of strongly-bound cross-bridges (17,18). In the Extended Model (Fig. 1 B), the MgATP binding step is therefore placed in the transition from state XBPostR to state PXB (gxbT), during which the strongly-bound cross-bridge becomes detached. It is also assumed that hydrolysis of ATP occurs at this step. The Rice et al. (8) parameter for the transition, gxbT, is adjusted to account for physiological MgATP concentrations using the formulation
| (3) |
where g′xbT represents the true first-order rate constant, MgATP′ is the physiological MgATP concentration, and gxbT is the pseudo-first order rate constant from the Rice et al. (8) model. Following mass-action kinetics, the MgATP-dependent transition rate from state XBPostR to state PXB is therefore given by
| (4) |
Under normal metabolic conditions, when [MgATP] = MgATP′, this gives g′xbT = gxbT. This formulation is applied to the other metabolite dependencies described below. The equation for this transition rate is not yet complete as g′xbT is also modified by MgADP (see below).
Inorganic phosphate
Biochemical and mechanical experiments in both skeletal (17,18) and cardiac muscle (19,20) have demonstrated that increasing [Pi] leads to a decrease in isometric force. Under isometric conditions, the sole force-producing state in the model in the literature (21,22) is XBPostR, whereas XBpreR remains as a strongly-bound state that can contribute to cross-bridge stiffness. The binding of Pi can therefore be placed at either hbT or gappT, because either will drive the cross-bridge cycle away from XBPostR and decrease isometric force with increasing [Pi]. We find that placing the Pi-binding step at gappT produces a better quantitative fit to the data (see below). The adjustment of the original rate constant to account for [Pi] is given by
| (5) |
where the parameters are defined equivalently to those in Eq. 3.
pH
Changes in pH have been shown to affect the force-Ca curve in two distinct ways: A decrease of pH leads to a decrease in the Ca2+ sensitivity as well as a decrease in the maximum force generated at saturating levels of Ca2+ (23,24). To incorporate these effects, we include two distinct mechanisms of sensitivity to pH. We assume that the decrease in Ca2+ sensitivity with decreasing pH is due to the competitive binding of H+ to the single Ca2+ binding site on troponin C (Fig. 1 C) (25,26), modeled as a rapid equilibrium reaction identically for both populations of troponin with dissociation constant kdHCa and cooperativity m. This modifies the rate constant for the binding of Ca2+ to troponin C,
| (6) |
where k′onT is the new apparent rate constant for Ca2+ binding, konT is the original Ca2+ binding rate constant, and H′ is the reference proton concentration. The apparent rate constant for Ca2+ binding affects the transition rates responsible for activation of the cross-bridge cycle (kpnT and knpT). The two parameters that govern the mechanism of competitive H+ binding, kdHCa and m, are determined using data from the literature (see below).
The inclusion of competitive H+ binding can account for the shift in Ca2+ sensitivity but cannot reproduce the change in maximum tension at saturating Ca2+ concentration. This effect can be incorporated by assigning one of the (reverse) rate constants in the cross-bridge cycle (Fig. 1 A) to be associated with the release of the metabolic H+ (a by-product of the ATP hydrolysis reaction; see Eq. 2). The two positions at which this reaction could occur are hbT and gappT, as both can lead to a decrease in force with an increase in H+ concentration. We locate H+ release at the reverse isomerization step, hbT, because this produces a drop in force of a magnitude that is in better agreement with the data (see below). The adjustment of the rate constant to account for the physiological H+ concentration is given by
| (7) |
where the parameters are defined equivalently to those in Eq. 3. The H+-dependent transition from XBPostR to XBPreR is therefore given by
| (8) |
Note that the equation for this transition rate is not yet complete, as h′bT is also modified by MgADP (see below).
MgADP
Mechanical measurements have shown that MgADP binds to attached cross-bridges (27–30) that remain attached after the binding event (31). Increasing MgADP concentrations also leads to an increase in steady-state isometric force development in both skeletal (17,32) and cardiac (21,33) muscle preparations. The only transition between strongly-bound states in the four-state Rice et al. (8) model where the MgADP binding event could be placed is from XBpostR to XBpreR. This, however, leads to a decrease in isometric force development because XBpreR is a lower-force state than XBpostR. The four-state model therefore contains an insufficient number of states to represent the binding of MgADP. Hence, we expand state XBPostR into two force-producing substates, AM1 and AM2, to create a five-state model (Fig. 1 B), where we assume that the two substates contribute equally to total force and sum to produce the same force as state XBpostR, and MgADP is assumed to bind to state AM1. This five-state construction is equivalent to the four-state model when binding and unbinding of MgADP is rapid (states AM1 and AM2 are in rapid equilibrium). We model the MgADP binding step with a single parameter representing the MgADP dissociation constant, kdADP. This modifies the rates of transitions leaving state XBPostR, i.e., g′xbT and h′bT, by
and
respectively, where MgADP′ is the normal physiological MgADP concentration and the dissociation constant kdADP is constrained by fitting the model to isometric force data (see below). Incorporating Eq. 4, the complete MgATP and MgADP-dependent transition from XBPostR to PXB is given by
| (9) |
By incorporating Eq. 8, the complete H+ and MgADP-dependent transition from XBPostR to XBPreR is determined as
| (10) |
A full description of the model formulation and equations that have been modified from Rice et al. (8) is given in the Appendix and the Supporting Material, and a detailed description of all model parameters is given in the Supporting Material.
Parameter estimation and model selection
Previous studies have suggested that placement of the Pi-binding step at either gappT or hbT provides plausible explanations for the isometric force-Pi data (19,20,34). We found that the Extended Model best fits the data when the Pi binding step is placed at gappT (Fig. 2 A). There is also evidence demonstrating a decrease in stiffness with increased [Pi], which is consistent with the binding of Pi causing the dissociation of cross-bridge attachment (3,35). This leaves the binding location of the metabolic H+ along with the three new parameters, kdADP, kdHCa, and m, to be determined.
Figure 2.
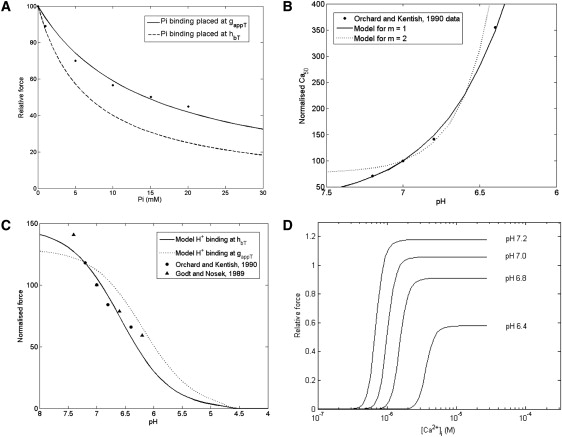
(A) Comparing the effect of modeling the Pi binding step at either gappT or hbT on the force-Pi curve. The data points are from rabbit papillary muscle (21). Other conditions in the simulations: [MgATP] = 5 mM, [MgADP] = 36.3 μM, pH = 7.15, [Ca2+]i = 200 μM (maximum activation), SL = 2.2 μM, and T = 22°C. (B) Best fit of the relative Ca2+ sensitivities (Ca50) of the Extended Model to data from Orchard and Kentish (24), at m = 1 (kdHCa = 2 × 10⁻⁵ mM) and at m = 2 (kdHCa = 1.8 × 10⁻⁴ mM2). The Ca50 values on the y axis are normalized to the Ca50 at pH = 7. (C) Model simulation of maximum steady-state force (under saturated Ca2+ conditions) as a function of pH. The model simulations correspond to the placement of the metabolic H+ release step at either gappT or hbT in the cross-bridge cycle. The simulations are normalized to force at pH 7.2 (see Fig. S1 in Supporting Material for original data). (D) Model simulation of steady-state force-Ca curves as a function of pH. Other conditions in the simulations of panels B–D: SL = 2.1 μM; T = 30°C. Note that metabolite concentrations are set to their reference values.
Experiments in cardiac muscle preparations have measured an increase in isometric force of ∼10–15% when [MgADP] is increased from zero to saturating concentrations in the millimolar range (21). We constrain the MgADP dissociation constant, kdADP, to give a 13% increase in isometric force when [MgADP] is increased from 0 to 3 mM (21). This produces a kdADP value of 4 μM, which compares well with those measured by Johnson and Adams (36) (14 μm at 23°C and 5 μm at 15°C) and with Kardami et al. (37) (8 μm at 5°C) (which were obtained from bovine cardiac preparations using independent assaying methodologies).
To determine the parameters governing the competitive binding of H+ to the Ca2+ binding sites on troponin C, we use the guinea pig force-Ca data of Orchard and Kentish (24). For reasons considered in the Discussion, the slopes of the force-Ca data are relatively flat (n = 2) when compared to the curves produced by the Rice et al. (8) model (n = 7). Therefore, we fit the relative change in Ca2+ sensitivity (Ca50) brought about by changes in H+ concentration. Fig. 2 B shows the result of fitting the Extended Model to the normalized data from Orchard and Kentish (24). The Ca50 values for the data set have been normalized to the Ca50 at pH = 7. The best fit to the data is obtained at m = 1 and kdHCa = 2 × 10⁻⁵ mM. For increasing values of m, the curve becomes more concave and does not fit the data as well. The value of 1 for the cooperativity constant, m, can be interpreted as the binding of a single H+ to the Ca2+ binding site and, in this model, is favored over the binding of two or more H+.
Fig. 2 C shows model simulations when the metabolic H+ is released at either gappT or hbT (Fig. 1 B). Both simulations are qualitatively consistent with the data inasmuch as a decrease of pH leads to a decrease in maximum steady-state force. However, quantitatively, the placement of the H+ release step at hbT produces better agreement with the data from Orchard and Kentish (24) (guinea pig trabeculae) and Godt and Nosek (21) (rabbit papillary). Fig. 2 D shows the overall effect of pH on the force-Ca curve, giving the expected decrease in Ca2+ sensitivity and maximum force with decreasing pH, comparable to experimental data from Orchard and Kentish (24) (shown in the Supporting Material—but exhibiting a much steeper slope, because the experimental data of Orchard and Kentish (24) are from skinned preparations).
Results
Force redevelopment and MgATP
The Extended Model was used to predict the effect of varying MgATP concentration on the isometric force response and the rate of tension redevelopment after a sudden length change (Fig. 3 A). An increase in MgATP concentration leads to a decrease in the normalized force, because this favors the detachment of strongly-bound cross-bridges (g′xbT) and thereby reduces the proportion of cross-bridges in the strongly-bound state. The model simulations show that the force-MgATP curve is sensitive to low levels of MgADP concentration, because decrease of MgADP represents a reduction in the competition for the strongly-bound state AM1 that results in a large drop in force with increasing MgATP. The data-set from Ebus et al. (18) lies within the family of curves simulated by the model at low to physiological MgADP concentrations. Fig. 3, B and C, shows the force redevelopment after the imposition of a sudden length change, which is assumed to detach almost all the strongly-bound cross bridges thus reducing the developed force to zero, at three different MgATP concentrations. Rapid detachment of cross-bridges is simulated (at time t = 300 ms) by decreasing 1000-fold the forward transition rates, fappT and hfT, and increasing 1000-fold the backward rate constants, g′appT and h′bT, for a period of 5 ms. Fig. 3 B shows that the steady-state force increases with decreasing MgATP concentration, consistent with Fig. 3 A, whereas Fig. 3 C shows that the rate of tension redevelopment decreases with decreasing MgATP concentration. These predictions are consistent with the results of Ebus et al. (18) (Fig. 3 D), who also demonstrated a decrease in rate of tension redevelopment with decreasing MgATP concentrations.
Figure 3.
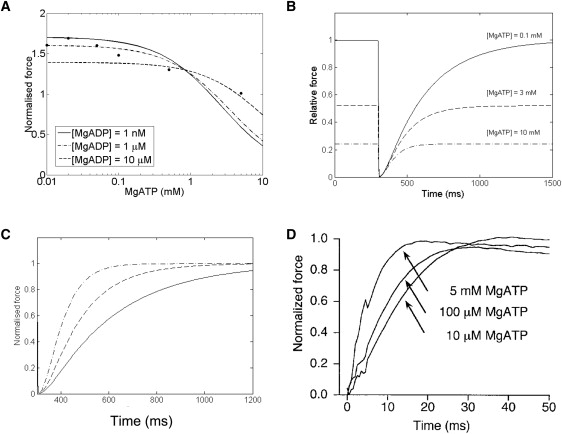
(A) Model simulations of isometric force as a function of MgATP concentration at different MgADP concentrations. The data points are from rat ventricular tissue (18) for which MgADP concentration is not specified and therefore assumed to be low/zero. The simulated curves are normalized to the maximum force from the data. Other conditions in the simulation: [Pi] = 0 mM, pH = 7, [Ca2+] = 200 μM, SL = 2.1 μM, and T = 20°C. (B) Model simulations of the time course of isometric force recovery after a sudden length change as a function of MgATP concentration. The change in length is applied at 300 ms (see text for details). The curves are normalized to the maximum force at [MgATP] = 0.1 mM. Other conditions are: [MgADP] = 1 μM, [Pi] = 2 mM, pH = 7, [Ca2+] = 200 μM, SL = 2.1 μM, and T = 20°C. (C) Same simulation as panel B, except that each curve has been normalized to its own maximum force so that the rate of force redevelopment at different MgATP concentrations can be compared to data shown in panel D. (D) Experimental data reproduced with permission from Fig. 5A of Ebus et al. (18).
Sinusoidal length perturbations
Kawai et al. (3) used sinusoidal length perturbation over a range of frequencies to determine the complex stiffness of cardiac muscle at different MgATP and Pi concentrations (in ferret myocardium). We imposed a sinusoidal length change with an amplitude of 0.25% of L0, the imposed sarcomere length (2.28 μm) in the Extended Model, including both passive and active components of tension. Fig. 4 shows the two components of complex stiffness, dynamic modulus (Fig. 4 A) and phase shift (Fig. 4 B), as a function of perturbation frequency at different Pi concentrations, compared with the experimental data from Kawai et al. (3). (Similar plots showing the comparison between model and data for dynamic modulus and phase shift at different MgATP concentrations can be found in the accompanying Supporting Material, and provide further validation of the dependence of cross-bridge cycling on MgATP.)
Figure 4.
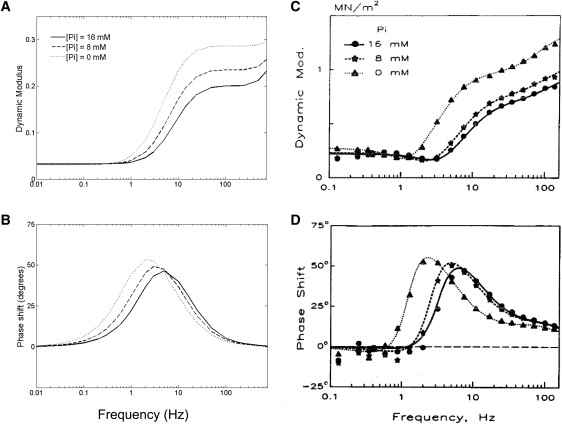
Two measures of complex stiffness: dynamic modulus (A) and phase shift (B), calculated for the model as a function of perturbation frequency and [Pi]. (C and D) Experimental data from ferret cardiac muscle (reproduced with permission from Wolters Kluwer Health, from Kawai et al. (3)). Dynamic modulus is calculated as the amplitude of the normalized force oscillation in response to a sinusoidal length change protocol with an amplitude of 0.25% L0 (where L0 is set at 2.28 μm). Other conditions in the simulations: [MgATP] = 5 mM, pH = 7.15, [Ca2+] = 200 μM, and T = 20°C. We also assume [MgADP] = 0, as there was no mention of its presence in the experimental protocol described by Kawai et al. (3).
Our simulations reproduce, qualitatively and semiquantitatively, features observed in the experimental data. Both demonstrate that with increasing frequency the dynamic modulus increases, whereas the phase shift increases toward a peak before decreasing. Dynamic modulus is a measure of muscle stiffness, which is directly proportional to force and is therefore a function of the fraction of cross-bridges in the strongly-bound state and their mean distortions. In the model, stiffness increases with frequency because the average distortion of the strongly-bound cross-bridges increases before they can detach.
The response to a change in [Pi] (and in [MgATP]; see Supporting Material) is very similar to the experimental observations. Stiffness decreases with increasing [Pi] (Fig. 4 A), whereas the peaks of the phase shifts move to a lower frequency. Increasing [Pi] (or [MgATP]) leads to a decrease in stiffness at a given stimulation frequency because it favors detachment of cross-bridges (reducing the proportion in the strongly-bound state, and hence, stiffness). An increase in [Pi] favors detachment of cross-bridges (from XBPreR) in the anti-clockwise direction, whereas an increase in [MgATP] favors detachment (from XBPostR) in the clockwise direction.
Force development during ischemia: sensitivity analysis
A key motivation for our study was to investigate the effects of changing metabolite concentrations during ischemia on the development of active force. Befroy et al. (38) measured [PCr], [ATP], and pH, and developed pressure, during 20 min of zero-flow global ischemia in perfused guinea pig hearts. These data were used by Terkildsen et al. (10) to calculate the time courses for [ADP] (using the creatine kinase equilibrium constant) and [Pi] (assuming conservation of the total phosphate pool). These time courses are shown in the first column of Fig. 5 (rows A–D), with the corresponding isometric force at maximum Ca2+ activation ([Ca2+] = 200 μM; row E) calculated from the model. The simulation shows force decreasing rapidly to ∼10% of its preischemic value after ∼10 min, consistent with the pressure measurements from Befroy et al. (38) and Allen and Orchard (1).
Figure 5.
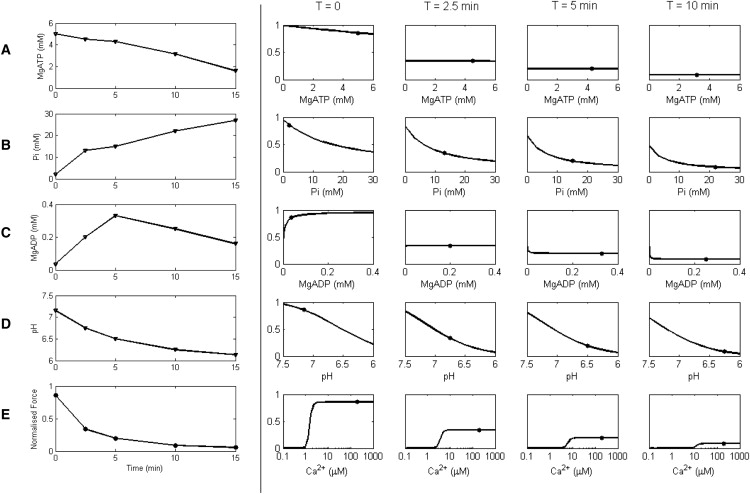
Production of force during ischemia. Imposed ischemic time courses for metabolites, pH, and simulated force are shown in the first column. The time courses for the change in (A) [MgATP], (B) [Pi], (C) [MgADP], and (D) pH are redrawn at five distinct time points (T = 0, 2.5, 5, 10, and 15 min) from Befroy et al. (38) and Terkildsen et al. (10). These time courses are then used to simulate the isometric force response (row E). The other four columns show the sensitivity of maximal force to [MgATP], [Pi], [MgADP], pH, and [Ca2+] at four different time points during ischemia. The y axis of each plot shows normalized force. Each column illustrates a particular time point after the onset of ischemia. (Solid circles) Force and respective metabolite, pH, or Ca2+ level at that time point. (Curves) Effect on force (sensitivity) of changing values of [MgATP], [Pi], [MgADP], pH, or [Ca2+] (rows A–E), while keeping the others constant. For plots A–D, [Ca2+] is held at 200 μM to achieve maximum force. Other conditions in the simulations: SL = 2.2 μM and T = 25°C.
To investigate the relative effects of the metabolites and pH on the maximum force during ischemia, we performed a sensitivity analysis at times T = 0 (normoxic conditions), and T = 2.5, 5, and 10 min after the onset of ischemia. Each curve shows the change in maximum force (y axis) as one metabolite is varied (x axis), whereas the others are held at their respective values for that time point (shown as solid circles on the sensitivity curves). For example, row B shows the negative inotropic effect of increasing [Pi] on force when [MgATP], [Pi], and pH are kept constant, whereas row C shows an initially positive effect of [MgADP] on force, with a small but negative effect on force after a few minutes of ischemia. Row E shows the effect of calcium on force at each time point post-onset of ischemia, showing that the calcium level required to achieve the diminishing maximal force also increases during the progression of ischemia.
These results indicate that the maximum force is most sensitive to changes in [Pi] and pH (the curves for [Pi] and pH have steepest gradient over the physiological range). The initial rapid decrease in maximum force after the onset of ischemia is primarily caused by increasing [Pi] and decreasing pH. We note, however, that these effects are not additive due to the nonlinear dependencies among variables in the model. Force is not strongly sensitive to MgATP or MgADP. At T = 0, increasing [MgATP] leads to a decrease in force, whereas after T = 2.5 min, force becomes insensitive to [MgATP]. For [MgADP], at T = 0 force increases with increasing [MgADP], becoming almost insensitive at T = 2.5 min, and starts to decrease after T = 5 min. These changes in the sensitivity to [MgATP] and [MgADP] over the time course of ischemia are due to the changing [Pi] and pH levels. The switch from increasing to decreasing sensitivity to [MgADP] is a consequence of the MgADP-binding step occurring between two strongly-bound states. The shift to the right (higher Ca) in the force-Ca curve (Row E) demonstrates the reduction of sensitivity to Ca2+ during ischemia. This is brought about primarily by the increased inhibition of Ca2+ binding to troponin C, due to falling pH (Fig. 2 D).
Discussion
The position of the MgATP and MgADP binding steps within the cross-bridge cycle are well constrained by data from the literature. MgATP was assumed to bind at gxbT because this transition detaches a strongly-bound cross-bridge, consistent with experimental observations (7,18). Experimental observations have also shown that the cross-bridge head remains strongly attached after the MgADP binding event, and that increasing [MgADP] leads to an increase in isometric force (21,31,33), which leads us to introduce a new state into the original cross-bridge scheme from Rice et al. (8). The binding positions for Pi and the metabolic H+ in the cross-bridge cycle are not as well characterized in the literature. Data indicate that an increase in the concentrations of either Pi or H+ will lead to a decrease in isometric force (21–24). This qualitative behavior can be satisfied by placing either of these binding events at gappT or hbT (Fig. 1), and we have determined a scheme that gives the best fit to experimental data (Fig. 2, A and C). Pi binding at gappt is further supported by the sinusoidal length perturbation simulations in Fig. 4 that reproduce the qualitative, and many of the quantitative, aspects of the experimental data. (MgATP binding is also further supported by these simulations—see Supporting Material.) These simulations demonstrate the recruitment and distortional stiffnesses identified by Campbell et al. (39), who analytically derived the frequency response of the Razumova et al. (40) model—a precursor to the Rice et al. (8) model. The distortional stiffness rises with increasing frequency because the cross-bridges are stretched further before they can detach, whereas the recruitment stiffness is a function of the fractional occupancies of the strongly-bound cross-bridge states (XBPreR and XBPostR). Increasing either [MgATP] or [Pi] leads to a decrease in the fractional occupancy of these strongly-bound states, resulting in a decrease in stiffness, as is observed in the experimental data of Kawai et al. (3).
Decreasing pH, as occurs during ischemia, has been shown to affect the force-Ca curves in two distinct ways, shifting the force-Ca curve to the right (reducing Ca2+ sensitivity) (23–26,41), and decreasing the maximum force at saturating Ca2+ (23,24). We have shown that competitive binding of H+ for the Ca2+-binding site on troponin C can account for the pH-dependent shift in Ca50 and that the release of the ATP hydrolysis-derived proton directly affects kinetics of the cross-bridge cycle, leading to a decrease in maximum force with decreasing pH. Together, these mechanisms can reproduce the experimentally observed steady-state pH-dependent force-Ca curves (Fig. 2 D). This is consistent with the study by Crampin and Smith (9), who also used two distinct mechanisms to capture the pH-dependent force-Ca data, but did so by using a phenomenological model for force generation. Our model also suggests that only one H+ binds to the Ca2+ binding site and that the release of the metabolic H+ occurs during the power-stroke and after the release of Pi.
Model limitations
This model of Ca2+ activation and cross-bridge kinetics is a mean-field representation of cooperative spatial interactions between regulatory proteins and cross-bridge action. Rather than explicitly describing these spatial interactions, which would require computationally intensive PDEs, the model achieves this by using a mean value to represent the population as a whole and, in doing so, can be described using a set of ordinary differential equations. The gains, in terms of computational efficiency, of this approach are offset by the limitations imposed on modeling the feedback behavior. Rice et al. (42) have shown that mean-field models generate hysteresis artifacts not seen in real muscle when global feedback on Ca2+-binding affinity is incorporated, i.e., allowing strongly-bound cross-bridges to influence explicitly the affinity of Ca2+ binding. Nevertheless, feedback mechanisms onto the Ca2+ affinity for troponin C are necessary for simulating observed phenomena such as ADP-contraction (33,43,44) and spontaneous oscillatory contractions (45,46). These phenomena have been successfully simulated using models with different feedback mechanisms, although it must be pointed out that these models are designed to study these specific phenomena only and cannot simulate other behavior such as force-Ca relations (33,46).
Inversion of the force-MgADP relationship
One of the unexpected outcomes from this modeling study is the dependence of the force-MgADP relationship on the other metabolites: MgATP, Pi, and H+. Fig. 3 A shows a reversal point at [MgATP] = 0.9 mM where the MgADP-dependent curves intersect. At this point, isometric force is insensitive to the MgADP concentration. For [MgATP] < 0.9 mM, an increase in MgADP concentration leads to a decrease in force, whereas for [MgATP] > 0.9 mM, increasing MgADP increases force. Varying [MgADP] and [Pi] will shift the position of this reversal point. This effect is not limited to MgATP, because the trend of the force-MgADP curve also depends on [H+] and all the other parameters in the cross-bridge cycle. This reversal behavior is unique to the MgADP binding step, as the sensitivity of force to [MgATP], [Pi], and [H+] will exhibit only a unidirectional response. This emergent feature of the model appears consistent with data showing a biphasic force-MgADP curve that initially increases with increasing MgADP before inverting and decreasing as MgADP is further increased (Fig. 5 from Shimizu et al. (43)). Our model is able to reproduce this biphasic behavior qualitatively if we assume that [Pi] is increasing commensurate with [MgADP] (see Fig. S2 in Supporting Material). The increasing [Pi] tilts the balance of XBPostR toward AM2 such that further increases in [MgADP] will increase the fraction of cross-bridges in state XBPreR (which is a non-force-generating state under isometric conditions). The mechanism underlying this behavior is centered around the placement of the MgADP binding step between the two strongly-bound substates that make up XBPostR (AM1 and AM2). The direction of the force-MgADP relationship depends on the balance between the competition for these two states. An analysis of this reversal point and the conditions under which it occurs is provided in the Supporting Material.
Reversibility
In our model of the cross-bridge cycle, the value of fxbT is calculated to be minute. The small magnitude of this reverse rate constant restricts the cross-bridge from cycling backward to any appreciable extent. Despite this, it is obligatory to include fxbT to ensure that the cycle is thermodynamically consistent. Simulation of muscle stretch under conditions where the free energy was artificially set to be positive produced a very small reversal flux. This is consistent with many studies in the literature that have attempted, but failed, to generate ATP through the application of external work (47–50). Our model shows that the cross-bridge cycle can reverse, albeit at a very low rate, and this is primarily due to the kinetics of the cross-bridge cycle.
Implications for ischemia
Our simulation of ischemia shows an exponential-like decrease in force that falls to ∼10% after 10 min of ischemia (Fig. 5). These results are consistent with the experimental data of Befroy et al. (38) from perfused guinea pig hearts. We have isolated the effects of the metabolic changes on the cross-bridge cycle from effects of changing Ca2+ levels by setting a high [Ca2+]. By considering each of the metabolite time courses separately, the sensitivity analysis suggests that [Pi] and pH are the primary contributors to the rapid fall in maximum tension during ischemia (Fig. 5). However, the metabolic changes that occur during ischemia also have direct effects on SERCA and the Na-pump, whereas falling pH directly inhibits the ryanodine receptors and indirectly leads to a rise in intracellular [Na+] (see (9) and references therein). Inhibition of SERCA and elevation of intracellular [Na+] will contribute to a rise in the diastolic Ca2+ concentration and the amplitude of the Ca2+ transient although the force production decreases. Row E of Fig. 5 shows that an increase in [Ca2+] cannot restore the loss of contractile strength brought about by the rise in [Pi] and fall in pH. Furthermore, the fall in pH greatly reduces the sensitivity of the force-Ca response, pushing the Ca50 past 10 μM after 10 min of ischemia.
The model developed here incorporates metabolite dependence into a model of cooperative activation and cross-bridge kinetics, which can reproduce a range of important metabolite/force/length/Ca2+ characteristics. The model is constructed using ordinary differential equations, making it ideal for integrating into whole-cell models of excitation-contraction. The simulations of ischemia in this study were carried out by imposing the time course of metabolic changes onto our model. The next step is to integrate this cross-bridge model into a cellular framework and to couple it to a model of mitochondrial oxidative phosphorylation, such that the metabolic time courses are driven by the mitochondria which, in turn, drive the cross-bridge model. Along with published models of the cardiac Na-pump (2,10) and SERCA (11), this metabolite-sensitive model of the cross-bridge cycle provides a platform on which to develop a whole-cell model of cardiac electrophysiology and Ca2+ dynamics that is capable of simulating the effects of compromised energetics during ischemia.
The model is available in the CellML repository at http://models.cellml.org/workspace/tran_2009. A MATLAB (The MathWorks, Natick, MA) version of the code is also available from the authors. Full details and further analysis of the model are available in the Supporting Material.
Acknowledgments
The authors thank John Jeremy Rice for helpful discussions during the preparation of this manuscript.
This work was supported by a Top Achiever Doctoral Scholarship from the Tertiary Education Commission, New Zealand (to K.T).; Royal Society of New Zealand, Marsden Fund No. 06-UoA-123 (to D.S.L. and N.P.S.); National Institute of Biomedical Imaging and Bioengineering grant No. EB-005825 (to E.J.C. and N.P.S.); and Engineering and Physical Sciences Research Council grant No. EP/G007521 (to N.P.S.). This publication is based on work (by E.J.C.) that was supported in part by award No. KUK-C1-013-04, made by King Abdullah University of Science and Technology.
Appendix
All parameters in the Extended Model are as given in Rice et al. (8), except xbmodspecies = 0.2, as described above. Three new parameters are introduced: kdHCa = 2 × 10⁻⁵ mM, m = 1, and kdADP = 4 μM.
The following ordinary differential equations describing the cross-bridge kinetics are modified from Eqs. 14–17 from Rice et al. (8):
where the values α1+ = fappT, α2+ = hfT, α1− = [Pi] × g′appT, α3− = fxbT, and α2−, α3+ are defined by Eqs. 9 and 10, respectively. The values fappT and hfT, are rate constants from Rice et al. (8) and g′xbT, g′appT, and h′bT are defined in Eqs. 3, 5, and 7, respectively. The fxbT is calculated using the constraint from Eq. 1,
| (11) |
where kMgATP = 15,400 mM2 is the equilibrium constant for the ATP hydrolysis reaction and is defined as
ΔG0 = 10.3 KJ mol−1 is the standard free energy change, taking into account [H+] in the hydrolysis reaction (Eq. 2), R is the universal gas constant, and T = 298 K.
The differential equations governing the rate of change of the mean distortions, Eqs. 29 and 30 of Rice et al. (8), are also modified:
Addition of fxbT modifies Eqs. 31 and 32 of Rice et al. (8), used to calculate the steady-state occupancies of XBPreR and XBPostR:
Equations 33 and 34 in Rice et al. (8), used to normalize the force output, become
In the Extended Model, the normalizing force is therefore determined by the force at the reference physiological metabolite levels under optimal conditions (see (8) for details). The value fxb is defined similarly to Eq.11, except that the base value of the rate constant is used, i.e., fapp instead of fappT.
Supporting Material
References
- 1.Allen D.G., Orchard C.H. Myocardial contractile function during ischemia and hypoxia. Circ. Res. 1987;60:153–168. doi: 10.1161/01.res.60.2.153. [DOI] [PubMed] [Google Scholar]
- 2.Smith N.P., Crampin E.J. Development of models of active ion transport for whole-cell modeling: cardiac sodium-potassium pump as a case study. Prog. Biophys. Mol. Biol. 2004;85:387–405. doi: 10.1016/j.pbiomolbio.2004.01.010. [DOI] [PubMed] [Google Scholar]
- 3.Kawai M., Saeki Y., Zhao Y. Crossbridge scheme and the kinetic constants of elementary steps deduced from chemically skinned papillary and trabecular muscles of the ferret. Circ. Res. 1993;73:35–50. doi: 10.1161/01.res.73.1.35. [DOI] [PubMed] [Google Scholar]
- 4.Hunter P.J., McCulloch A.D., ter Keurs H.E. Modeling the mechanical properties of cardiac muscle. Prog. Biophys. Mol. Biol. 1998;69:289–331. doi: 10.1016/s0079-6107(98)00013-3. [DOI] [PubMed] [Google Scholar]
- 5.Hill T.L. Springer-Verlag; New York: 1989. Free Energy Transduction and Biochemical Cycle Kinetics. [Google Scholar]
- 6.Huxley A.F. Muscle structure and theories of contraction. Prog. Biophys. Mol. Biol. 1957;7:255–318. [PubMed] [Google Scholar]
- 7.Pate E., Cooke R. A model of crossbridge action: the effects of ATP, ADP and Pi. J. Muscle Res. Cell Motil. 1989;10:181–196. doi: 10.1007/BF01739809. [DOI] [PubMed] [Google Scholar]
- 8.Rice J.J., Wang F., de Tombe P.P. Approximate model of cooperative activation and crossbridge cycling in cardiac muscle using ordinary differential equations. Biophys. J. 2008;95:2368–2390. doi: 10.1529/biophysj.107.119487. [DOI] [PMC free article] [PubMed] [Google Scholar]
- 9.Crampin E.J., Smith N.P. A dynamic model of excitation-contraction coupling during acidosis in cardiac ventricular myocytes. Biophys. J. 2006;90:3074–3090. doi: 10.1529/biophysj.105.070557. [DOI] [PMC free article] [PubMed] [Google Scholar]
- 10.Terkildsen J.R., Crampin E.J., Smith N.P. The balance between inactivation and activation of the Na+-K+ pump underlies the triphasic accumulation of extracellular K+ during myocardial ischemia. Am. J. Physiol. 2007;293:H3036–H3045. doi: 10.1152/ajpheart.00771.2007. [DOI] [PubMed] [Google Scholar]
- 11.Tran K., Smith N.P., Crampin E.J. A thermodynamic model of the cardiac sarcoplasmic/endoplasmic Ca(2+) (SERCA) pump. Biophys. J. 2009;96:2029–2042. doi: 10.1016/j.bpj.2008.11.045. [DOI] [PMC free article] [PubMed] [Google Scholar]
- 12.Palmer S., Kentish J.C. Roles of Ca2+ and crossbridge kinetics in determining the maximum rates of Ca2+ activation and relaxation in rat and guinea pig skinned trabeculae. Circ. Res. 1998;83:179–186. doi: 10.1161/01.res.83.2.179. [DOI] [PubMed] [Google Scholar]
- 13.Lymn R.W., Taylor E.W. Mechanism of adenosine triphosphate hydrolysis by actomyosin. Biochemistry. 1971;10:4617–4624. doi: 10.1021/bi00801a004. [DOI] [PubMed] [Google Scholar]
- 14.Goldman Y.E. Kinetics of the actomyosin ATPase in muscle fibers. Annu. Rev. Physiol. 1987;49:637–654. doi: 10.1146/annurev.ph.49.030187.003225. [DOI] [PubMed] [Google Scholar]
- 15.Cooke R. Actomyosin interaction in striated muscle. Physiol. Rev. 1997;77:671–697. doi: 10.1152/physrev.1997.77.3.671. [DOI] [PubMed] [Google Scholar]
- 16.Bers D.M. 2nd Ed. Kluwer Academic Publishers; Dordrecht, The Netherlands: 2001. Excitation-Contraction Coupling and Cardiac Contractile Force. [Google Scholar]
- 17.Cooke R., Pate E. The effects of ADP and phosphate on the contraction of muscle fibers. Biophys. J. 1985;48:789–798. doi: 10.1016/S0006-3495(85)83837-6. [DOI] [PMC free article] [PubMed] [Google Scholar]
- 18.Ebus J.P., Papp Z., Stienen G.J. Effects of MgATP on ATP utilization and force under normal and simulated ischemic conditions in rat cardiac trabeculae. Pflugers Arch. 2001;443:102–111. doi: 10.1007/s004240100667. [DOI] [PubMed] [Google Scholar]
- 19.Hibberd M.G., Dantzig J.A., Goldman Y.E. Phosphate release and force generation in skeletal muscle fibers. Science. 1985;228:1317–1319. doi: 10.1126/science.3159090. [DOI] [PubMed] [Google Scholar]
- 20.Dantzig J.A., Lacktis J.W., Goldman Y.E. Mechanical transients initiated by photolysis of caged-Pi during active skeletal-muscle contractions. Biophys. J. 1987;51:A3. [Google Scholar]
- 21.Godt R.E., Nosek T.M. Changes of intracellular milieu with fatigue or hypoxia depress contraction of skinned rabbit skeletal and cardiac muscle. J. Physiol. 1989;412:155–180. doi: 10.1113/jphysiol.1989.sp017609. [DOI] [PMC free article] [PubMed] [Google Scholar]
- 22.Kentish J.C. The effects of inorganic phosphate and creatine phosphate on force production in skinned muscles from rat ventricle. J. Physiol. 1986;370:585–604. doi: 10.1113/jphysiol.1986.sp015952. [DOI] [PMC free article] [PubMed] [Google Scholar]
- 23.Fabiato A., Fabiato F. Effects of pH on the myofilaments and the sarcoplasmic reticulum of skinned cells from cardiac and skeletal muscles. J. Physiol. 1978;276:233–255. doi: 10.1113/jphysiol.1978.sp012231. [DOI] [PMC free article] [PubMed] [Google Scholar]
- 24.Orchard C.H., Kentish J.C. Effects of changes of pH on the contractile function of cardiac muscle. Am. J. Physiol. 1990;258:C967–C981. doi: 10.1152/ajpcell.1990.258.6.C967. [DOI] [PubMed] [Google Scholar]
- 25.Blanchard E.M., Solaro R.J. Inhibition of the activation and troponin calcium binding of dog cardiac myofibrils by acidic pH. Circ. Res. 1984;55:382–391. doi: 10.1161/01.res.55.3.382. [DOI] [PubMed] [Google Scholar]
- 26.Solaro R.J., el-Saleh S.C., Kentish J.C. Ca2+, pH and the regulation of cardiac myofilament force and ATPase activity. Mol. Cell. Biochem. 1989;89:163–167. doi: 10.1007/BF00220770. [DOI] [PubMed] [Google Scholar]
- 27.Rodger C.D., Tregear R.T. Letter: Crossbridge angle when ADP is bound to myosin. J. Mol. Biol. 1974;86:495–497. doi: 10.1016/0022-2836(74)90033-3. [DOI] [PubMed] [Google Scholar]
- 28.Schoenberg M., Eisenberg E. ADP binding to myosin cross-bridges and its effect on the cross-bridge detachment rate constants. J. Gen. Physiol. 1987;89:905–920. doi: 10.1085/jgp.89.6.905. [DOI] [PMC free article] [PubMed] [Google Scholar]
- 29.Xu S., Gu J., Yu L.C. Structural changes in rigor (nucleotide-free) cross-bridges induced by the addition of MgADP. Biophys. J. 1998;74:A363. [Google Scholar]
- 30.Dantzig J.A., Hibberd M.G., Goldman Y.E. Cross-bridge kinetics in the presence of MgADP investigated by photolysis of caged ATP in rabbit psoas muscle fibers. J. Physiol. 1991;432:639–680. doi: 10.1113/jphysiol.1991.sp018405. [DOI] [PMC free article] [PubMed] [Google Scholar]
- 31.Takezawa Y., Kim D.S., Wakabayashi K. Backward movements of cross-bridges by application of stretch and by binding of MgADP to skeletal muscle fibers in the rigor state as studied by x-ray diffraction. Biophys. J. 1999;76:1770–1783. doi: 10.1016/S0006-3495(99)77338-8. [DOI] [PMC free article] [PubMed] [Google Scholar]
- 32.Karatzaferi C., Myburgh K.H., Cooke R. Effect of an ADP analog on isometric force and ATPase activity of active muscle fibers. Am. J. Physiol. Cell Physiol. 2003;284:C816–C825. doi: 10.1152/ajpcell.00291.2002. [DOI] [PubMed] [Google Scholar]
- 33.Fukuda N., Fujita H., Ishiwata S. Regulatory roles of MgADP and calcium in tension development of skinned cardiac muscle. J. Muscle Res. Cell Motil. 1998;19:909–921. doi: 10.1023/a:1005437517287. [DOI] [PubMed] [Google Scholar]
- 34.Kentish J.C. Combined inhibitory actions of acidosis and phosphate on maximum force production in rat skinned cardiac muscle. Pflugers Arch. 1991;419:310–318. doi: 10.1007/BF00371112. [DOI] [PubMed] [Google Scholar]
- 35.Mekhfi H., Ventura-Clapier R. Dependence upon high-energy phosphates of the effects of inorganic phosphate on contractile properties in chemically skinned rat cardiac fibers. Pflugers Arch. 1988;411:378–385. doi: 10.1007/BF00587716. [DOI] [PubMed] [Google Scholar]
- 36.Johnson R.E., Adams P.H. ADP binds similarly to rigor muscle myofibrils and to actomyosin-subfragment one. FEBS Lett. 1984;174:11–14. doi: 10.1016/0014-5793(84)81067-4. [DOI] [PubMed] [Google Scholar]
- 37.Kardami E., De Bruin S., Gratzer W. Interaction of ADP with skeletal and cardiac myosin and their active fragments observed by proton release. Eur. J. Biochem. 1979;97:547–552. doi: 10.1111/j.1432-1033.1979.tb13143.x. [DOI] [PubMed] [Google Scholar]
- 38.Befroy D.E., Powell T., Clarke K. Osmotic shock: modulation of contractile function, pHi, and ischemic damage in perfused guinea pig heart. Am. J. Physiol. 1999;276:H1236–H1244. doi: 10.1152/ajpheart.1999.276.4.H1236. [DOI] [PubMed] [Google Scholar]
- 39.Campbell K.B., Razumova M.V., Slinker B.K. Nonlinear myofilament regulatory processes affect frequency-dependent muscle fiber stiffness. Biophys. J. 2001;81:2278–2296. doi: 10.1016/S0006-3495(01)75875-4. [DOI] [PMC free article] [PubMed] [Google Scholar]
- 40.Razumova M.V., Bukatina A.E., Campbell K.B. Stiffness-distortion sarcomere model for muscle simulation. J. Appl. Physiol. 1999;87:1861–1876. doi: 10.1152/jappl.1999.87.5.1861. [DOI] [PubMed] [Google Scholar]
- 41.Solaro R.J., Lee J.A., Allen D.G. Effects of acidosis on ventricular muscle from adult and neonatal rats. Circ. Res. 1988;63:779–787. doi: 10.1161/01.res.63.4.779. [DOI] [PubMed] [Google Scholar]
- 42.Rice J.J., Tu Y., De Tombe P.P. Spatially-compressed cardiac myofilament models generate hysteresis that is not found in real muscle. Pac. Symp. Biocomput. 2008;2008:366–377. [PubMed] [Google Scholar]
- 43.Shimizu H., Fujita T., Ishiwata S. Regulation of tension development by MgADP and Pi without Ca2+. Role in spontaneous tension oscillation of skeletal muscle. Biophys. J. 1992;61:1087–1098. doi: 10.1016/S0006-3495(92)81918-5. [DOI] [PMC free article] [PubMed] [Google Scholar]
- 44.Fukuda N., Kajiwara H., Kurihara S. Effects of MgADP on length dependence of tension generation in skinned rat cardiac muscle. Circ. Res. 2000;86:E1–E6. doi: 10.1161/01.res.86.1.e1. [DOI] [PubMed] [Google Scholar]
- 45.Fukuda N., Fujita H., Ishiwata S. Spontaneous tension oscillation in skinned bovine cardiac muscle. Pflugers Arch. 1996;433:1–8. doi: 10.1007/s004240050241. [DOI] [PubMed] [Google Scholar]
- 46.Smith D.A., Stephenson D.G. The mechanism of spontaneous oscillatory contractions in skeletal muscle. Biophys. J. 2009;96:3682–3691. doi: 10.1016/j.bpj.2009.01.039. [DOI] [PMC free article] [PubMed] [Google Scholar]
- 47.Curtin N.A., Davies R.E. Chemical and mechanical changes during stretching of activated frog skeletal-muscle. Cold Spring Harb. Symp. Quant. Biol. 1973;37:619–626. [Google Scholar]
- 48.Infante A.A., Klaupiks D., Davies R.E. Adenosine triphosphate: changes in muscles doing negative work. Science. 1964;144:1577–1578. doi: 10.1126/science.144.3626.1577. [DOI] [PubMed] [Google Scholar]
- 49.Curtin N.A., Drobnis D.D., Davies R.E. Very low ATP usage with very high tension in activated muscles during a slow stretch. Fed. Proc. 1969;28:A711. [Google Scholar]
- 50.Linari M., Woledge R.C., Curtin N.A. Energy storage during stretch of active single fibers from frog skeletal muscle. J. Physiol. 2003;548:461–474. doi: 10.1113/jphysiol.2002.032185. [DOI] [PMC free article] [PubMed] [Google Scholar]
Associated Data
This section collects any data citations, data availability statements, or supplementary materials included in this article.