

Abstract
The ability to characterize biological dynamics is important for understanding the integrated molecular processes that underlie normal and abnormal cellular states. The availability of metabolomic data, in addition to new developments in the formal description of dynamic states of networks, has enabled a new data integration approach for building large-scale kinetic networks. We show that dynamic network models can be constructed in a scalable manner using metabolomic data mapped onto stoichiometric models, resulting in mass action stoichiometric simulation (MASS) models. Enzymes and their various functional states are represented explicitly as compounds, or nodes in a stoichiometric network, within this formalism. Analyses and simulations of MASS models explicitly show that regulatory enzymes can control dynamic states of networks in part by binding numerous metabolites at multiple sites. Thus, network functional states are reflected in the fractional states of a regulatory enzyme, such as the fraction of the total enzyme concentration that is in a catalytically active versus inactive state. The feasible construction of MASS models represents a practical means to increase the size, scope, and predictive capabilities of dynamic network models in cell and molecular biology.
Introduction
In silico models of biochemical reaction networks represent an important effort in systems biology and related fields. Stoichiometric reconstructions of large networks can be interrogated by means of constraint-based reconstruction and analysis (COBRA), methods (1–3). COBRA methods are widely used and have proved to be valuable in addressing a broad range of biological problems (4–7). In contrast, investigators have found it difficult to generate large-scale dynamic models of network functions, primarily due to the limited availability of kinetic constants and related information.
Biological processes are inherently dynamic, particularly in higher-order organisms that exhibit a broad timescale hierarchy in their dynamic responses. Dynamic characterization of cellular processes is particularly relevant for these organisms because of pathophysiological processes that can, for example, disrupt the normal sequence of reactions in metabolism (1,2). Before we can gain a mechanistic understanding of normal and abnormal biological process, we will need to develop dynamic models on a large or even genomic scale. Kinetic models are traditionally built using rate laws for all of the enzymes accounted for in the network, under in vitro conditions. There are many challenges associated with this process, ranging from scalability (i.e., challenges associated with establishing hundreds of rate laws) to fundamental concerns about how well the in vitro function represents the in vivo one (3).
Thus, the field continues to be faced with the challenge of constructing large-scale dynamic models. In this work, we developed a stepwise process that enables the construction of large-scale models using mass action kinetics built on reconstructed networks. This approach incorporates the direct, stoichiometric representation of regulatory enzymes, as well as omic (metabolomic, fluxomic, and proteomic) data when such information is available. This initial in silico assessment entails the definition of the model-building process and its stepwise implementation to construct a metabolic network model that explicitly accounts for the regulatory enzymes, and all their bound states, as components in the network. The result is a data-driven process for constructing mass action stoichiometric simulation (MASS) models that are based on mapping top-down omics data onto bottom-up network reconstructions. The formulation of the problem and steps for construction are executed in such a way as to make them amenable to COBRA methods for future development and analysis.
Methods
Following the mass action rate law formulation, for a reaction given by
the resulting net rate law is
| (1) |
with the equilibrium constant
| (2) |
For the regulated reactions in the network, the enzymes are explicit species and combined with each metabolite (see Fig. 2).
Figure 2.

Map of the MASS model plus mechanisms for five enzymes. Each enzyme reaction scheme was added and tested before incorporation into the full network. The bottom-right corner of the figure shows the stoichiometric matrix for the mass action model, Srbc. To construct the regulated model, a single column (HK in the figure) becomes expanded to an additional stoichiometric matrix, Shk, corresponding to the reaction mechanism for HK. Thus, for each regulated enzyme reaction, a single column in the stoichiometric matrix became multiple columns, and corresponding rows were added to the matrix as well to account for the new reaction intermediates. This modularity is illustrated for HK in the bottom right-hand side of the figure. Srbc represents the stoichiometric matrix for the mass action network (in the center of the figure). The first column (corresponding to HK) becomes expanded into a new substoichiometric matrix, Shk. Shk represents a “subnetwork”, reflected in the illustrated reaction scheme. This process was carried out for all of the enzymes in the network, and they were then all integrated with Srbc to produce a final stoichiometric matrix for the regulated red cell. The reaction scheme for HK is as described by Mulquiney and Kuchel (29). hkE represents the unbound, free form of the enzyme. The individual steps and interactions account for the catalytic steps in PFK in addition to the allosteric interactions. The reaction scheme for the Rapoport-Leubering shunt is carried out by the same enzyme (27). The reaction schemes for G6PDH are as described by Mulquiney and Kuchel (29). g6pdER represents the active enzyme. The reaction schemes for AK are as described by Hawkins and Bagnara (36). akE represents the enzyme in the catalytic state, and akET represents the tense or inactive form of the enzyme. See the Supporting Material for full metabolite abbreviations.
Steps for modular model construction
Substituting flux rate expressions (1) and equilibrium constants (2) into the steady-state mass balances,
| (3) |
where S is the m × n stoichiometric matrix, and v is the flux vector of length n, allows one to solve for the n forward rate constants ki+. With the rate constants and equilibrium constants in hand, in addition to steady-state concentrations, the gradient matrix can be defined. The gradient matrix G is given by dv/dx. Decomposition into the dual Jacobian matrices (4) is given by
| (4) |
| (5) |
for the concentration Jacobian, Jx, and
| (6) |
| (7) |
for the flux Jacobian, Jv. These calculations were carried out for each of the submodels that were developed in the studies described here. The regulated cell model also included magnesium complexing with ATP, ADP, AMP, and 2,3DPG (5).
Models were constructed and tested in Mathematica (Wolfram Research, Champaign, IL). Simulations were also carried out in Mathematica. Dynamic simulations were conducted by numerical integration of the equations:
| (8) |
where x is a vector of metabolite and protein concentrations, S is the stoichiometric matrix, and v is a vector of rate expressions (e.g., see Eq. 1). Since the protein concentrations were much smaller than the concentrations of the metabolites, simulations were carried out using normalized enzyme concentrations to reduce the stiffness of the system of differential equations. The stoichiometric matrix, equilibrium constants, and steady-state flux and concentrations are available in the Supporting Material.
The addition of regulated enzyme subnetworks was carried out in a systematic, modular process. Depending on the type of available experimental data, the procedure in Fig. 1 (bottom panel) had to be modified. For example, as described in the Results, association and dissociation constants for steps in the catalytic scheme of phosphofructokinase (PFK) were not available and an approximation had to be used. The analytical results were tested for a range of choices for the model, from 1000 to 10,000,000. Since all of these models exhibited similar findings (e.g., dominance of enzyme-bound complexes in the modal matrix), an intermediate set of rate constants (100,000) was chosen. Since a particular flux state was under consideration, there were no problems with alternative flux distributions in the network when solving for the rate constants.
Figure 1.

Data-driven kinetic model construction through the integration of disparate data types. Top panel: Conceptual integration of various data. Stoichiometric network models in combination with equilibrium constants for the reactions in the network and metabolomic data can be used to solve the steady-state mass balance equations for kinetic rate constants. These constants, using bilinear kinetics, can then be used to define the dual Jacobian matrices. Bottom panel: The steps involved in constructing kinetic models, and challenges/quality control (QC) issues associated with each step. The main QC issue associated with each step is highlighted on the right side of the equations for an m×n network with stoichiometric matrix rank r. Failure of the QC step results in the need for iterative revisions of the model, which may be accomplished by, e.g., adjusting flux/metabolite measurements or equilibrium constant approximations based on experimental errors.
During the simulations, the enzyme and bound-enzyme variables were normalized as fractions of total enzyme moieties, and then the enzyme rate constant was redefined. This allowed the stiffness of the ordinary differential equations to be significantly reduced. The studies with the global pooled phase planes were carried out through perturbation of the initial conditions. The system was then integrated out to >1000 h to specify the steady state. Thirty digits of precision were maintained during these calculations.
Comparative studies between the mass action and regulated model were carried out by application of pulsed functions. For the energy load and redox load cases alike, the system was ensured to be at a steady state by using steady-state initial conditions and integrated out to 5 h. For the energy load case, at the 5 h time point a single rectangular pulse was applied with magnitude 4 mM/h for 1 h. For the redox load case, at the 5 h time point the NADPH flux was drained at a rate give by 100∗NADPH mM/h and the NADP was increased at this rate (to maintain the conservation of the NADP moiety) for 5 h.
Results
Concept of a MASS model
Recent findings regarding the underlying properties and characteristics of dynamic states of biochemical networks (4) suggest that a direct, in vivo, data-driven approach can be developed to construct large-scale kinetic network models, using stoichiometric network reconstructions (6–8) as the scaffold. Three data types are mapped onto the stoichiometric scaffold: 1), fluxomic data on network inputs and outputs, and any internal reactions; 2), in vivo metabolomic data (of increasing availability (9–11); and 3), information about the equilibrium constants (Keq) for each reaction, which can be incorporated to relate the forward and the reverse rate constants for reactions.
Combining these three data types within a stoichiometric network reconstruction allows for the estimation of condition-specific rate constants on a network-wide basis that satisfy the steady-state conditions. These rate constants can then be used to formulate a dynamic description of the network that can be interrogated by available analytical and simulation-based methods. The flow of data and information underlying the formulation of MASS models is illustrated in Fig. 1 (top panel), which may be viewed as a middle-out analysis process (12).
Formulation of MASS models
The detailed approach for implementing this model formulation process is outlined in Fig. 1 (bottom panel). The steps for constructing such models are as follows:
-
1.
Specify a particular steady-state flux distribution.
-
2.
Identify the metabolite concentrations at the particular steady state. Some of these values will have to be estimated or approximated, because not all of the measurements are available.
-
3.
Approximate the equilibrium constants.
-
4.
Solve n linear equations for the forward rate constants.
The rate constants can then be used to formulate the MASS models, characterizing the dynamics of a network about a particular steady state for which data were available. For situations in which all of the concentrations are unknown, or if one wants to trace the effects of particular metabolites on multiple rate constants rather than n linear equations, one can solve m equations resulting from the steady-state mass conservation relationship (S · v = 0). This leads to the k-cone (13), and the computation will result in multiple alternative solutions.
Large-scale kinetic models of network dynamics are characterized by their stoichiometric (S) and gradient (G) matrices. The former results from the network reconstruction process (6,8), and the latter contains the kinetic constants and some of the steady-state concentration information (4). The fundamental subspaces of these matrices are important in their characterization. For instance, the null and left null spaces of S give information about pathways and pools (14).
The possibility of forming MASS models opens up a promising new dimension in the formulation of large-scale kinetic models, and we explore that process in this study. Three levels of application of the process outlined above are considered: First, we apply it to a single unregulated pathway and compare the results with an existing detailed kinetic model; second, we treat a whole-cell model based on stoichiometry of the metabolic reactions alone; and third, we incorporate a stoichiometric description of the key regulatory enzymes in the whole-cell model. In going through this three-step process, we are particularly interested in 1), developing data-based models that are amenable to analytical as well as simulation-based methods; 2), determining whether the new models exhibit timescale separation; 3), determining whether the new models are hierarchically structured, by aggregate pool formation of the variables and comparison with the corresponding results from the classical kinetic model building process; and 4), assessing the effects of the explicit inclusion of regulatory enzymes and all their bound states.
Implementation of the MASS model formulation process for a single pathway
To illustrate the initial feasibility of MASS models, the process outlined in Fig. 1 (bottom panel) was applied to the classical glycolytic pathway. The dimensions of the S and G matrices (see Jamshidi and Palsson (4) for details on the properties of these matrices) and their corresponding subspaces are shown in Table S1. This model is for a single pathway; hence, the single dimension of the right null space is expected to represent its linear nature.
The dynamics of glycolysis are consistent with observations from previous studies (4) in which the well-known examples of pool formation between hexose phosphates (HP) and phosphoglycerates (PG). For the glycolytic pathway, the successive aggregation of chemical moieties (i.e., HP and PG) culminates, on the slowest timescale, in the formation of a physiologically meaningful pool that represents the sum of high-energy phosphate bonds found in the glycolytic intermediates (i.e., their ATP equivalents). The last row of the modal matrix for the flux Jacobian (see the Supporting Material) shows that this pool is moved by hexokinase (HK) as the input and ATPase as the output, reflecting the catabolism of glucose to generate ATP.
We performed a general sensitivity analysis to assess the effects of changes in metabolite concentrations. Variations in the metabolite concentrations (data not shown) by a factor of 0.5–2 were carried out for each metabolite individually in the network. The relative composition of the intermediate modes (the weights on the different metabolites) varied by up to a factor of 2. However, the slowest, physiological mode (HK as the input and ATPase as the output) in the flux Jacobian was consistently the dominant ultimate mode. The timescale of this mode varied by up to a factor of 3 (from ∼15 min to 1 h).
Scalability of the approach to networks
Since the approach outlined in Fig. 1 was successful for a small pathway model, we next addressed its scalability. The MASS model approach was applied to a whole-cell model of human red blood cell metabolism (15). Steady-state fluxes and metabolite concentrations (16) reported in the literature were used in conjunction with equilibrium constants reported in the literature (5,17) and known uptake and secretion rates. The procedure outlined in Fig. 1 (bottom panel) was applied.
A map of the red cell metabolic network is shown in Fig. 2, and the dimensions of the network along with the sizes of the subspaces of S and G are shown in Table S1. Three conserved pools of metabolites are found in the left null space of S (18): 1), the stoichiometric sum of all of the phosphate-containing compounds; 2), the NAD moiety; and 3), the NADP moiety. The amount of glutathione in the network is also conserved; however, since the dimeric form is not included as a dynamic variable in the network, it does not appear in the left null space of S. The size of the right null space of S increases significantly over the single pathway model, i.e., by eight dimensions. The null space of S contains pathway vectors (14), and the increase in dimension reflects the various alternate pathways that can occur from the Rappoport-Leubering shunt, the pentose-phosphate pathway, and the connections between the nonoxidative branches of the pentose phosphate pathway and the nucleotide salvage pathways.
The characteristics of the Jacobian matrix (J = SG) can be characterized by the modal matrix (M−1) that results from the diagonalization of J: J = MΛM−1 (19–22). These characteristics include a time-hierarchical structure with fast reactions corresponding to isomerization reactions and slower ones reflecting the more physiological behaviors of the network, such as phosphate group transfers. There is a good timescale separation in this network (∼20 ms–5 h), although the slowest and fastest modes of the traditional in vitro kinetic rate law-based red cell model are larger (16,23). These slower timescales in the kinetic model resulted from potassium leak channels (24,25), which were not included in the network presented here. The compositions of the very fast motions are similar to those seen for the red cell (e.g., isomerization between glycolytic intermediates, hexose sugars, pentose sugars, etc.). With this implementation, although the diphosphoglycerates move on the slower modes in the network, they are still faster than expected (on the order of 5 min as opposed to 10 h).
Construction of a regulated stoichiometric model of the human erythrocyte
The much simpler MASS model thus contains the essential features of the traditionally built red cell model. The former does not contain regulatory effects, whereas the latter does. We now add the regulatory effects to the MASS model, demonstrating its ability to combine the states of low-molecular-weight metabolites with macromolecules. Fundamentally, all interactions between metabolites and enzymes are bilinear reactions, including regulatory effects (26). The interactions between a low-molecular-weight metabolite (M) and a protein (P) are of the form
where M:P is the bound state. Binding events can be serial for multimeric enzymes, and all such interactions can be stoichiometrically defined.
Many of the association and dissociation constants for the steps involved in catalysis by regulatory enzymes in the red cell have been characterized (27–31). The above MASS model for the red blood cell metabolic network was expanded to include key regulatory enzymes of the red cell in a stoichiometric format. The incorporation of the bilinear interactions to mechanistically describe small metabolite regulation of the enzymes resulted in a dramatic increase in the size of the network (Table S1). Given the complexity and increase in size, the addition of each regulated enzyme into the network was carried out in a systematic, modular manner. Thus, the schemes in Fig. 1 were applied sequentially for each individual enzyme. After the stoichiometric description of each regulatory enzyme was completed, the enzyme was integrated into the whole network model, which is a simple and scalable task for even the largest stoichiometric metabolic models that are presently available (6,8,32,33). Five enzymes were included, as described below:
Hexokinase (HK). The mechanism for unordered substrate binding for HK, and the association and dissociation constants were used as described by Mulquiney and Kuchel (29); the individual steps are illustrated in Fig. 2. The total amount of enzyme is conserved (appearing in the left null space) and was set at 24 nM as described by Mulquiney and Kuchel (29). The net flux for the reaction was fixed according to the steady-state flux for the mass action model. The regulatory interactions by 2,3DPG and G6P do not carry net fluxes, so their equilibrium concentrations were calculated. The remaining sets of intermediate concentrations were then calculated.
Phosphofructokinase (PFK). PFK is a tetramer and has four binding sites for its allosteric regulators (34). Although such interactions have been described using the well-known Hill equation, they can more appropriately be directly described as a set of sequential bilinear interactions. Association and dissociation constants for the regulated steps for PFK in the red blood cell were not available; hence, an approximation of 100,000 was made for most of the steps, with the exception of the catalytic transition, which was assumed to be much slower. The total concentration of enzyme was 33 nM according to Albe et al. (35).
Diphosphoglyceromutase (DPGM) and diphosphoglycerol phosphatase (DPGase). The enzymatic activities of DPGM and DPGase are carried out by the same enzyme, whose enzymatic steps were described according to Mulquiney and Kuchel (29). As with HK, the majority of the association and dissociations steps were measured (29). A similar procedure was carried out to calculate the concentrations of the enzyme-metabolite intermediates.
Glucose-6 phosphate dehydrogenase (G6PDH) and adenosine kinase (AK). The reactions for G6PDH were implemented as described by Mulquiney and Kuchel (29) and solved in a manner analogous to that used for HK. The reaction scheme for AK is outlined in Fig. 2, as described by Hawkins and Bagnara (36). The magnesium equilibrium reactions with 2,3DPG and the adenosine phosphates were implemented as described by Joshi and Palsson (5).
A summary of the dimensions and sizes of the subspaces for the stoichiometric and gradient matrices for the regulated red cell metabolic MASS model is provided in Table S1. Note that this network is more than twice as large as the unregulated version due to the many different states of the regulated enzymes. Enzyme-catalyzed mechanisms were introduced into this model for five enzymes, and the size of the left null space increased from three to 10. The size of the left null space grew by seven dimensions due to the addition enzymes as reactants (five enzymes (note that PFK has an inactive and active form) plus the conservation of total magnesium). The right null space increased by three as a result of the nonsequential mechanism of some of the regulated enzymes, such as HK.
It is challenging to interpret the dynamic characteristics found in the modal matrix (M−1) for larger networks, and involved algorithmic approaches are needed to elucidate the structure (2). As noted above, this difficulty is due to the increased size of the networks and the noninteger entries in G, which tends to be an ill-conditioned matrix. The structure of the modal matrix for the regulated network (see the Supporting Material) reveals a few key features:
The timescale separation has increased from the nonregulated model, with motions ranging from less than microseconds to 10 h.
The slow modes are dominated by the metabolite-bound forms of the regulated enzymes.
In particular, the reactions that have a larger number of intermediate complexes play a more dominant role, especially on the slower timescales.
The movement of 2,3DPG (enzyme-bound forms) has moved to the slowest timescales.
In short, the structure of the modal matrix of the MASS model that includes the four regulatory enzymes and its features closely approximates that of the full traditional red cell kinetic model. This result has encouraging and interesting implications, since the starting point was a basic model of glycolysis that was expanded to a model of red cell metabolism, which then incorporated regulatory interactions in a mechanistic manner. A key result from the regulated MASS model of red cell metabolism suggests that regulatory enzymes are able to exert their influence over the rest of the network because of their ability to bind more than one substrate and to exist in multiple states (active and inactive).
Dynamic phase-plane diagrams of enzyme states
Dynamic simulations were carried out with the regulated cell scale model in response to instantaneous ATP depletion (Fig. 3 and the Supporting Material) or NADPH depletion (Supporting Material). Phase-plane diagrams plot the trajectory of two dynamic variables chronologically, from an initial state to a final state. These diagrams are useful for characterizing the dynamic relationships between components within a network. One can use the shape of a trajectory to classify the dependence of two variables, i.e., by identifying conservation relationships, equilibration between metabolites/fluxes after a particular timescale, dynamically independent metabolites or fluxes, or periodic motion around a steady state. Tiled phase-plane diagrams have been used for the global assessment of network dynamics, and have proved useful for characterizing global dynamic properties and identifying aggregate pool formation of metabolites hierarchically from very fast to slow timescales (2,25). As an illustration of the highly involved interactions that occur within components of the network, Fig. 3 shows the tiled phase planes for the 21 reactions involving PFK. Some of the fluxes are highly correlated (predominantly linear interactions, such as those between PFK14 and PFK16), whereas others exhibit independent motions along different timescales (e.g., “L-shaped” trajectories, such as those between PFK3 and PFK15). Thus, the stoichiometric representation of regulated reactions forms subnetworks within the larger metabolic network.
Figure 3.
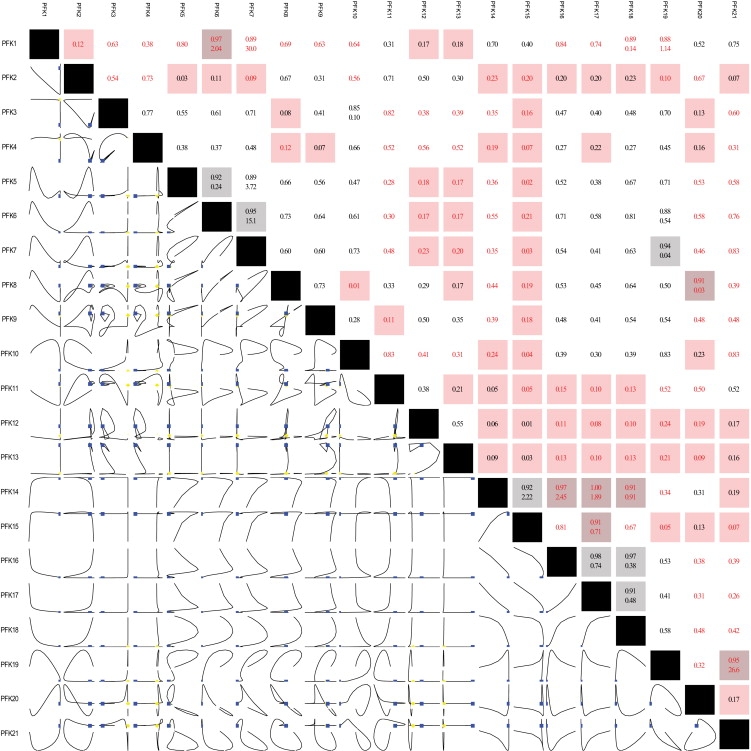
Tiled phase-plane diagram for all of the fluxes involving the enzyme PFK for the cell in response to a transient, instantaneous decrease in ATP by 60%. The lower-left triangle depicts the trajectories of the corresponding variables. The upper-right triangle shows the correlation coefficient over the simulated time course for the two corresponding entries (when the correlation coefficient is >0.85, the slope of the line appears below it). Note that not all of the steps are correlated with one another. Indeed, the net flux through the enzyme is actually a subnetwork in and of itself. The catalytic step is PFK3. PFK14–PFK17 reflect ATP binding to the tense form of the enzyme, and PFK18–PFK21 represent Mg binding to the tense form of the enzyme. Correlations among some of the fluxes are observed, such as the sequential binding of multiple ATP molecules to the enzyme. Other fluxes (e.g., PFK15 and PFK18) move dynamically independently from the other PFK fluxes.
The NADHP/NADP ratio, G6PD enzyme ratio, and flux through the G6PD reaction are all highly correlated under both simulation conditions (Fig. S1 and Fig. S2), suggesting that either of these measurements can be used to infer the states of the others. Correlations among many of the other variables appear to vary under different conditions.
Unregulated versus regulated model responses to perturbations
To investigate the systemic responses to a pulsed energy and redox load, prolonged loads on ATP and NADPH were applied independently to the two models. When the responses of the unregulated and regulated models to the same perturbation are compared, it is immediately evident that the regulated model exhibits a significantly more damped response to the energy and redox loads than the unregulated model. This difference is particularly noticeable when one compares the changes in the energy charge (Fig. 4, top panel) and NADPH redox state (Fig. 4 bottom panel) of the models.
Figure 4.

Network responses to pulsed energy loads. The energy charge (ATP + 0.5∗ADP/(ATP + ADP + AMP)) (43) is shown as a function of time during a rectangular pulse load on ATP lasting from t = 5 to t = 6 h (magnitude 4 mM/h). Network responses to pulsed redox loads, and the changes in glutathione and NADPH/(NADPH + NADP) as a function of time when the cell is exposed to a first-order load on NADPH (100∗NADPH) from t = 5 to t = 10 h are also shown.
Given the changes in energy and redox states under these simulation conditions, we next explored the “enzyme states”. Instead of considering only bound versus unbound enzymes, one can calculate the fraction of activated and inactivated enzymes for some of the regulated reactions in the network. Enzymes are present in much smaller concentrations than the metabolites they act upon, and thus their absolute concentration is not as important as their fraction in different states, i.e., percent phosphorylated versus unphosphorylated. Enzyme-state, phase-plane diagrams showing how the state of enzymes changes during a time-course trajectory for the regulated network corresponding to the simulations in Fig. 4 are provided in Fig. S3 and Fig. S4 for the energy and redox loads, respectively. Anticorrelated motions between bound and unbound forms of enzymes are observed, as expected.
The responses of regulated enzymes differ depending on the type of perturbation the cell is exposed to. In response to an energy load, PFK moves between multiple different states, whereas G6PDH moves along two dynamically independent motions. Conversely, in response to a redox load, G6PDH moves between different states before returning to the original state. Relatively small changes (<5%) in enzyme states appear to influence larger changes in the flux dynamics. Three-dimensional enzyme-state plots are shown for HK and AK in Fig. 5 for the pulsed energy and redox loads. The percent changes over the course of the simulations from the activated state do not exceed ∼2%, whereas the changes in the energy charge and redox charge are ∼5%.
Figure 5.

Enzyme-state plots for HK and AK under energy (left panel) and redox (right panel) perturbations from the simulations in Fig. 4. The majority of the enzyme is in the inactivated state; however, in response to either load, the amount in the inactivated state decreases and the amount in the activated state increases to increase the flux through glycolysis or the pentose pathway.
In the network, HK acts before the split between the oxidative branch of the pentose phosphate pathway and glycolysis; hence, it is not surprising that in response to energy or redox loads, the percent in the activated state increases, and the fraction of the enzyme in the inactivated state decreases. Although the changes in the fractional state in AK are small, there is a shift in the balance between the inactive/active fractions with respect to the total percent bound/unbound when the energy load is applied. Such changes are not seen with the redox load, and reflect the difference between a direct demand/depletion of energy that drives the increased glycolytic flux (and decreased pentose pathway flux) as opposed to an increased redox load that also drives an opposite change (decreased glycolytic and increased pentose pathway flux). Hence, these changes reflect the different types of responses by the network to different perturbations.
MASS versus classically built kinetic models
The traditional approach to building kinetic models of metabolic networks basically involves the scaling of enzyme kinetics to the treatment of multiple enzymes that function simultaneously. These models are biophysical in nature. Advancements in biology (experimentation and modeling) are now technology-driven, and MASS models represent a class of models that can be built by utilizing omics data. In vivo MASS models provide an alternative to the traditional in vitro kinetic models. Both can account for regulation and exhibit biological properties, such as timescale decomposition, but MASS models have the added benefits of incorporating in vivo data, scalability (which is dependent on the continued development of metabolomic data throughput), and direct representation of the regulatory interactions. Some of the advantages and disadvantages of the two approaches are detailed in Table 1. Each approach presents challenges related to data measurement errors and incompleteness; however, the mathematical formulation, algorithmic construction, and omic data reliance of MASS models make these models more amenable to constraint-based analysis methods.
Table 1.
Comparison between traditional kinetic models and MASS models
| Traditional models | MASS models | |
|---|---|---|
| Condition specificity | None (global); aim to account for many details, including temperature and pH dependence. | Tailored; all condition-dependent factors/parameters are lumped into condition-specific constants. |
| Protein activity resolution | Implicit through quasi stead-state and quasiequilibrium assumptions; details about protein-protein interactions and intermediates are often masked. | Explicit stoichiometric mass action representation; allows direct integration as well as interrogation of proteomic and metabolomic data from an integrated network perspective. |
| Model building and formulation | Case-by-case treatment of enzymes and their kinetics | Algorithmic approach based on omics data. |
| Mathematical characteristics | Hyperbolic equations | Bilinear equations |
| Scalability | Poor due to the case-by-case treatment of additional enzymes. | Easy, but has a larger number of variables. |
| Data errors (rate constants) | Stymied by the recognized differences between in vitro and in vivo kinetics. | Calculated from concentrations and subject to errors in these measurements. Assessment of experimental errors explicit. |
| Data completeness | Limited by inability to characterize all enzymes in vivo and measure all metabolites in vivo. | Limited by the coverage of omics data sets. Procedures to deal with incomplete measurements need to be developed. |
| Validation | Mature, well developed; pros and cons relatively well known. | In the early stages of development, and more experience is needed. |
Discussion
A long-standing challenge in computational systems biology has been the construction of kinetic models with multiple simultaneous enzymatic functions. Historically, investigators have addressed this problem by formulating rate laws for each enzyme in the system and then linking them together to construct dynamic mass balance equations. This approach reflects a piecewise construction based on enzymatic rate laws.
Herein we represent an alternative approach for the construction of large-scale kinetic models using an omics, data driven approach. The network reconstruction, which represents a grand-scale data integration and curation process that can subsequently be represented as a stoichiometric model for the computation of function states (8,14,33), is used as a scaffold. If the reconstructed network can be observed in an in vivo setting, and fluxomic, metabolomic, and proteomic data can be obtained, then a mass action kinetic representation of the stoichiometric network can be built upon this scaffold to formulate a dynamic model of network functions (see Fig. 1). Thus, this process represents an integrative, direct, data-driven approach for constructing dynamic network models.
There are pros and cons to this construction process, as well as the traditional model construction process, as highlighted in Table 1. Whereas the traditional approach for model construction has the benefit of being more mature and developed, the MASS model approach 1), capitalizes on increasingly available in vivo data; 2), enables explicit representation of enzyme function and allosteric regulation; and 3), is amenable to constraint-based analysis approaches. MASS model simulations allow direct evaluation of the fractional activity states of regulatory enzymes, because they explicitly show what fraction of the enzyme is free, or is in an inhibited or active state, etc. Simulations using regulated MASS models suggest that the inclusion of these enzymes leads to more robust control and maintenance of metabolic energy and redox charge states in response to perturbations. Pursuant to this characteristic, enzyme-state diagrams were shown to be useful in reflecting overall network states. These simulations support efforts to measure and characterize the phosphoproteome as a means to summarize not just local, but also global cellular functional states. For instance, it has become clear in cancer research (37) that the malfunction of classical kinases in core metabolic pathways is key to understanding oncogenesis and developing future cancer therapies.
An increasing number of groups have made advances in recent years to overcome the challenges posed by a dearth of reliable and direct kinetic information and to aid in the formulation and analysis of kinetic models of biochemical reaction networks using different approaches (13,38–40). Experimental error can have significant effects on calculations of flux states in stoichiometric networks (41). Methods have been developed to analyze metabolic networks by accounting for these variations, notably by sampling the steady-state flux solution space (42). This concept is general and can be applied to the sampling of kinetic parameter spaces as well (13,40). Most recently, Tran et al. (40) have made further advances in this area, and such methods will be applicable for MASS models as well for addressing the challenge of data incompleteness.
As described here, the process required to build large-scale kinetic models is a data-driven one, and in many respects is a continuation of the successful story of the construction and use of stoichiometric models (6,14,33) achieved by mapping condition-dependent omics data onto stoichiometric models. Problems such as data error and incompleteness will always present a challenge in the field of biology; however, the scalability and flexibility of MASS models, in addition to their reliance on high-throughput, in vivo data, suggest that these models can be built on large and even genomic scales. We expect that the implementation of MASS models in the near term will help define the practical issues associated with their use, as well as the advantages they bring to the field.
Supporting Material
References
- 1.Scriver C. McGraw-Hill Professional; New York: 2000. The Metabolic and Molecular Bases of Inherited Disease. [Google Scholar]
- 2.Jamshidi N., Palsson B.O. Top-down analysis of temporal hierarchy in biochemical reaction networks. PLOS Comput. Biol. 2008;4:e1000177–e1000186. doi: 10.1371/journal.pcbi.1000177. [DOI] [PMC free article] [PubMed] [Google Scholar]
- 3.Teusink B., Passarge J., Snoep J.L. Can yeast glycolysis be understood in terms of in vitro kinetics of the constituent enzymes? Testing biochemistry. Eur. J. Biochem. 2000;267:5313–5329. doi: 10.1046/j.1432-1327.2000.01527.x. [DOI] [PubMed] [Google Scholar]
- 4.Jamshidi N., Palsson B.O. Formulating genome-scale kinetic models in the post-genome era. Mol. Syst. Biol. 2008;4:171–182. doi: 10.1038/msb.2008.8. [DOI] [PMC free article] [PubMed] [Google Scholar]
- 5.Joshi A., Palsson B.O. Metabolic dynamics in the human red cell. Part III—Metabolic reaction rates. J. Theor. Biol. 1990;142:41–68. doi: 10.1016/s0022-5193(05)80012-8. [DOI] [PubMed] [Google Scholar]
- 6.Feist A.M., Herrgård M.J., Palsson B.Ø. Reconstruction of biochemical networks in microorganisms. Nat. Rev. Microbiol. 2009;7:129–143. doi: 10.1038/nrmicro1949. [DOI] [PMC free article] [PubMed] [Google Scholar]
- 7.Feist A.M., Palsson B.O. The growing scope of applications of genome-scale metabolic reconstructions using Escherichia coli. Nat. Biotechnol. 2008;26:659–667. doi: 10.1038/nbt1401. [DOI] [PMC free article] [PubMed] [Google Scholar]
- 8.Reed J.L., Famili I., Palsson B.O. Towards multidimensional genome annotation. Nat. Rev. Genet. 2006;7:130–141. doi: 10.1038/nrg1769. [DOI] [PubMed] [Google Scholar]
- 9.Ishii N., Nakahigashi K., Tomita M. Multiple high-throughput analyses monitor the response of E. coli to perturbations. Science. 2007;316:593–597. doi: 10.1126/science.1132067. [DOI] [PubMed] [Google Scholar]
- 10.Smith C.A., O'Maille G., Siuzdak G. METLIN: a metabolite mass spectral database. Ther. Drug Monit. 2005;27:747–751. doi: 10.1097/01.ftd.0000179845.53213.39. [DOI] [PubMed] [Google Scholar]
- 11.Wishart D.S., Tzur D., Querengesser L. HMDB: the Human Metabolome Database. Nucleic Acids Res. 2007;35(Database issue):D521–D526. doi: 10.1093/nar/gkl923. [DOI] [PMC free article] [PubMed] [Google Scholar]
- 12.Brenner S., Noble D., Dolmetsch R. John Wiley; Chichester, UK: 2001. Understanding complex systems: top-down, bottom-up or middle-out? [Google Scholar]
- 13.Famili I., Mahadevan R., Palsson B.O. k-Cone analysis: determining all candidate values for kinetic parameters on a network scale. Biophys. J. 2005;88:1616–1625. doi: 10.1529/biophysj.104.050385. [DOI] [PMC free article] [PubMed] [Google Scholar]
- 14.Palsson B.O. Cambridge University Press; New York: 2006. Systems Biology: Determining the Capabilities of Reconstructed Networks. [Google Scholar]
- 15.Joshi A., Palsson B.O. Metabolic dynamics in the human red cell. Part I—A comprehensive kinetic model. J. Theor. Biol. 1989;141:515–528. doi: 10.1016/s0022-5193(89)80233-4. [DOI] [PubMed] [Google Scholar]
- 16.Joshi A., Palsson B.O. Metabolic dynamics in the human red cell. Part IV—Data prediction and some model computations. J. Theor. Biol. 1990;142:69–85. doi: 10.1016/s0022-5193(05)80013-x. [DOI] [PubMed] [Google Scholar]
- 17.Reich J., Selkov E. Academic Press; New York: 1981. Energy Metabolism of the Cell: A Theoretical Treatise. [Google Scholar]
- 18.Famili I., Palsson B.O. The convex basis of the left null space of the stoichiometric matrix leads to the definition of metabolically meaningful pools. Biophys. J. 2003;85:16–26. doi: 10.1016/S0006-3495(03)74450-6. [DOI] [PMC free article] [PubMed] [Google Scholar]
- 19.Heinrich R., Sonntag I. Dynamics of non-linear biochemical systems and the evolutionary significance of time hierarchy. Biosystems. 1982;15:301–316. doi: 10.1016/0303-2647(82)90045-4. [DOI] [PubMed] [Google Scholar]
- 20.Okino M.S., Mavrovouniotis M.L. Simplification of mathematical models of chemical reaction systems. Chem. Rev. 1998;98:391–408. doi: 10.1021/cr950223l. [DOI] [PubMed] [Google Scholar]
- 21.Palsson B.O., Jamier R., Lightfoot E.N. Mathematical modelling of dynamics and control in metabolic networks. II. Simple dimeric enzymes. J. Theor. Biol. 1984;111:303–321. doi: 10.1016/s0022-5193(84)80212-x. [DOI] [PubMed] [Google Scholar]
- 22.Palsson B.O., Joshi A., Ozturk S.S. Reducing complexity in metabolic networks: making metabolic meshes manageable. Fed. Proc. 1987;46:2485–2489. [PubMed] [Google Scholar]
- 23.Jamshidi N., Edwards J.S., Palsson B.O. Dynamic simulation of the human red blood cell metabolic network. Bioinformatics. 2001;17:286–287. doi: 10.1093/bioinformatics/17.3.286. [DOI] [PubMed] [Google Scholar]
- 24.Jamshidi N., Palsson B.O. Systems biology of the human red blood cell. Blood Cells Mol. Dis. 2006;36:239–247. doi: 10.1016/j.bcmd.2006.01.006. [DOI] [PubMed] [Google Scholar]
- 25.Kauffman K.J., Pajerowski J.D., Edwards J.S. Description and analysis of metabolic connectivity and dynamics in the human red blood cell. Biophys. J. 2002;83:646–662. doi: 10.1016/S0006-3495(02)75198-9. [DOI] [PMC free article] [PubMed] [Google Scholar]
- 26.Segel I. John Wiley & Sons; New York: 1975. Enzyme Kinetics. [Google Scholar]
- 27.Mulquiney P.J., Bubb W.A., Kuchel P.W. Model of 2,3-bisphosphoglycerate metabolism in the human erythrocyte based on detailed enzyme kinetic equations: in vivo kinetic characterization of 2,3-bisphosphoglycerate synthase/phosphatase using 13C and 31P NMR. Biochem. J. 1999;342:567–580. [PMC free article] [PubMed] [Google Scholar]
- 28.Mulquiney P.J., Kuchel P.W. Model of the pH-dependence of the concentrations of complexes involving metabolites, haemoglobin and magnesium ions in the human erythrocyte. Eur. J. Biochem. 1997;245:71–83. doi: 10.1111/j.1432-1033.1997.00071.x. [DOI] [PubMed] [Google Scholar]
- 29.Mulquiney P.J., Kuchel P.W. Model of 2,3-bisphosphoglycerate metabolism in the human erythrocyte based on detailed enzyme kinetic equations: equations and parameter refinement. Biochem. J. 1999;342:581–596. [PMC free article] [PubMed] [Google Scholar]
- 30.Schauer M., Heinrich R., Rapoport S.M. Mathematical modelling of glycolysis and adenine nucleotide metabolism of human erythrocytes. I. Reaction-kinetic statements, analysis of in vivo state and determination of starting conditions for in vitro experiments. Acta Biol. Med. Ger. 1981;40:1659–1682. [PubMed] [Google Scholar]
- 31.Sigman D.S., Boyer P.D. Academic Press; San Diego: 1990. The Enzymes: Mechanisms of Catalysis. [Google Scholar]
- 32.Duarte N.C., Becker S.A., Palsson B.Ø. Global reconstruction of the human metabolic network based on genomic and bibliomic data. Proc. Natl. Acad. Sci. USA. 2007;104:1777–1782. doi: 10.1073/pnas.0610772104. [DOI] [PMC free article] [PubMed] [Google Scholar]
- 33.Durot M., Bourguignon P.Y., Schachter V. Genome-scale models of bacterial metabolism: reconstruction and applications. FEMS Microbiol. Rev. 2009;33:164–190. doi: 10.1111/j.1574-6976.2008.00146.x. [DOI] [PMC free article] [PubMed] [Google Scholar]
- 34.Voet D., Voet J.G. J. Wiley & Sons; Hoboken, NJ: 2004. Biochemistry. [Google Scholar]
- 35.Albe K.R., Butler M.H., Wright B.E. Cellular concentrations of enzymes and their substrates. J. Theor. Biol. 1990;143:163–195. doi: 10.1016/s0022-5193(05)80266-8. [DOI] [PubMed] [Google Scholar]
- 36.Hawkins C.F., Bagnara A.S. Adenosine kinase from human erythrocytes: kinetic studies and characterization of adenosine binding sites. Biochemistry. 1987;26:1982–1987. doi: 10.1021/bi00381a030. [DOI] [PubMed] [Google Scholar]
- 37.Vander Heiden M.G., Cantley L.C., Thompson C.B. Understanding the Warburg effect: the metabolic requirements of cell proliferation. Science. 2009;324:1029–1033. doi: 10.1126/science.1160809. [DOI] [PMC free article] [PubMed] [Google Scholar]
- 38.Bulik S., Grimbs S., Holzhütter H.G. Kinetic hybrid models composed of mechanistic and simplified enzymatic rate laws—a promising method for speeding up the kinetic modelling of complex metabolic networks. FEBS J. 2009;276:410–424. doi: 10.1111/j.1742-4658.2008.06784.x. [DOI] [PubMed] [Google Scholar]
- 39.Smallbone K., Simeonidis E., Kell D.B. Something from nothing: bridging the gap between constraint-based and kinetic modelling. FEBS J. 2007;274:5576–5585. doi: 10.1111/j.1742-4658.2007.06076.x. [DOI] [PubMed] [Google Scholar]
- 40.Tran L.M., Rizk M.L., Liao J.C. Ensemble modeling of metabolic networks. Biophys. J. 2008;95:5606–5617. doi: 10.1529/biophysj.108.135442. [DOI] [PMC free article] [PubMed] [Google Scholar]
- 41.Savinell J.M., Palsson B.O. Optimal selection of metabolic fluxes for in vivo measurement. II. Application to Escherichia coli and hybridoma cell metabolism. J. Theor. Biol. 1992;155:215–242. doi: 10.1016/s0022-5193(05)80596-x. [DOI] [PubMed] [Google Scholar]
- 42.Schellenberger J., Palsson B.O. Use of randomized sampling for analysis of metabolic networks. J. Biol. Chem. 2009;284:5457–5461. doi: 10.1074/jbc.R800048200. [DOI] [PubMed] [Google Scholar]
- 43.Atkinson D.E. The energy charge of the adenylate pool as a regulatory parameter. Interaction with feedback modifiers. Biochemistry. 1968;7:4030–4034. doi: 10.1021/bi00851a033. [DOI] [PubMed] [Google Scholar]
Associated Data
This section collects any data citations, data availability statements, or supplementary materials included in this article.