

Abstract
The measurement of tissue and cell oxygenation is important for understanding cell metabolism. We have addressed this problem with a novel optical technique, called triplet imaging, that exploits oxygen-induced triplet lifetime changes and is compatible with a variety of fluorophores. A modulated excitation of varying pulse widths allows the extraction of the lifetime of the essentially dark triplet state using a high-fluorescence signal intensity. This enables the monitoring of fast kinetics of oxygen concentration in living cells combined with high temporal and spatial resolution. First, the oxygen-dependent triplet-state quenching of tetramethylrhodamine is validated and then calibrated in an L-ascorbic acid titration experiment demonstrating the linear relation between triplet lifetime and oxygen concentration according to the Stern-Volmer equation. Second, the method is applied to a biological cell system, employing as reporter a cytosolic fusion protein of β-galactosidase with SNAP-tag labeled with tetramethylrhodamine. Oxygen consumption in single smooth muscle cells A7r5 during an [Arg8]-vasopressin-induced contraction is measured. The results indicate a consumption leading to an intracellular oxygen concentration that decays monoexponentially with time. The proposed method has the potential to become a new tool for investigating oxygen metabolism at the single cell and the subcellular level.
Introduction
Oxygen is a key molecule involved in almost every energy cycle within a cell (1) and is responsible for regulating signaling pathways. Measurement techniques addressing partial oxygen pressure () or even directly the concentration of oxygen [O2] in vivo are of great interest because they provide us with information for deeper and more complete understanding of cell metabolism (2).
Many methods exist for local oxygen sensing at the cell level. In 1972, Knopp and co-workers (3,4) attempted to demonstrate intracellular oxygen levels using fluorescence intensity quenching. However, it was only 15 years later that a technique emerged which could overcome the previous limitations, leading to more reliable measurements by using lifetime quenching of various phosphorescence-emitting probes. Meanwhile, many probes based on luminescence and phosphorescence quenching have been proposed (5–9). A newer approach toward highly localized sensing has been proposed by Finikova and co-workers in 2008 (10,11) by using two-photon excited phosphorescence probes. Alternatively, Koo et al. (12) proposed insertion of specifically engineered probes (encapsulated by biologically localized embedding with a diameter of 120 nm into the cells) that resulted in highly sensitive and specific nanosensors for dissolved oxygen based on phosphorescence quenching. Alternative probes for dissolved oxygen measurements include: 1), colorimetric probes (13); 2), methods based on fluorescence lifetime measurements of the very long-living fluorophore RTDP (14,15); and 3), endogenous protoporphyrin IX probes that emit a characteristic delayed fluorescence signal (16,17). The third type of alternative probe has been employed recently in vivo (18) to measure the mitochondrial oxygen tension of the heart, bringing this noninvasive technique closer to clinical application.
However, most of these techniques are based on low-intensity signals—making it difficult for investigators to achieve, simultaneously, both high spatial resolution at the cellular level and high speed for monitoring oxygen kinetics. Such low-intensity-signal techniques only allow for nonlocalized ensemble measurements or spatially resolved time-averaged signals. Here, we present a spatio-temporally resolved oxygen measurement at the single-cell level, based on a fluorescence signal. This method is compatible with almost any fluorophore having a (nonradiative) triplet state that is quenched by diffusing oxygen, and it can be used with many of the different labeling protocols available.
Our experimental concept is based on a modulated excitation leading to a variation of their triplet state population. The method has been initially validated and published as a spectroscopic method by Sandén et al. (19). Recently, the same team showed the first images based on triplet lifetimes taken with a laser-scanning microscope (20). Although this approach is easy to implement, the method is still limited due to long acquisition times; i.e., ∼3 min are required to make a single image recording. Here we present a wide-field approach that allows triplet lifetime acquisition within 2 s, which is well suited for monitoring oxygen metabolism cycles in living cells that typically span some seconds (e.g., ∼40 s).
In a calibration experiment, the method's ability to monitor changes in oxygen concentration with the standard fluorophore tetramethylrhodamine (TMR) was demonstrated. We employed L-ascorbic acid to remove dissolved oxygen in discrete steps while monitoring the triplet lifetime.
The technique was then applied to measure the oxygen consumption of a smooth muscle cell upon induced contraction. Previous studies on oxygen consumption by Hogan (21,22) used phosphorescence lifetime analysis by which the oxygen kinetics at a tissue level were determined during the contraction of muscle fibers of Xenopus laevis. The same group also indirectly measured oxygen uptake kinetics at the cell level by employing a sealed chamber and measuring the extracellular oxygen concentration (23). In contrast to this earlier work on oxygen kinetics employing extracellular phosphorescence lifetime measurements in a sealed chamber, our method provides spatio-temporal resolution at the intracellular and subcellular level.
In accordance with these previously measured kinetics, we found that the oxygen concentrations, upon induced contractions, decay monoexponentially with time.
Materials and Methods
The concept: modulated excitation
Most fluorophores can be modeled as a three-level system, as indicated in the Jablonski scheme, with two singlet states and one triplet state (Fig. 1 A). The lifetime of the triplet state τT is typically 2–4 orders-of-magnitude longer than the lifetime of the associated excited singlet state τ10. A pulsed excitation of fluorescent molecules with long-lived triplet states leads to a characteristic response of their fluorescence emission as a function of the pulse width.
Figure 1.
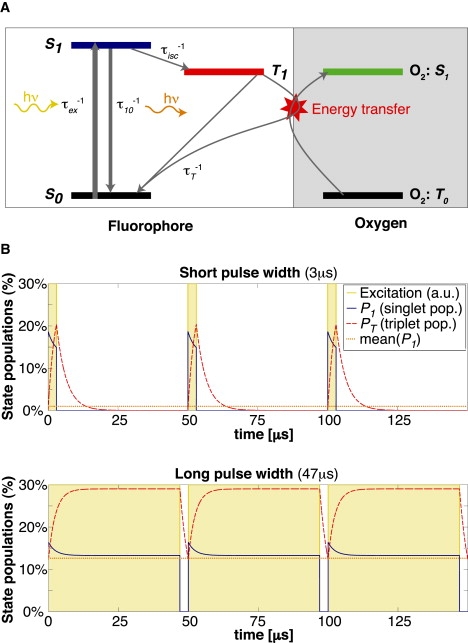
(A) Jablonski diagram of a simplified three-level model of a fluorophore, illustrating the possibility of an energy transfer from the triplet state to oxygen. (B) Simulation: Steady-state simulations of energetic populations of a fluorescent molecule excited by rectangular pulses of 3 μs and 47 μs width and 50 μs period. Typical values for TMR were used: .
The rate equations for this simplified model are
| (1) |
where P0, P1, and PT are the respective populations of the singlet states and the triplet state, τ10 is the lifetime for the singlet state relaxation, τisc is the intersystem crossing lifetime from the excited singlet state to the triplet state, τex is the excitation lifetime, and τT is the triplet state lifetime. Based on these equations, we can simulate the response to a modulated excitation (see Fig. 1 B) using typical rate constants of a given fluorophore. The result of the simulation shows an increase of the triplet state population for longer pulse widths, which decreases the number of molecules available for the singlet states. This leads to a correspondingly weaker fluorescence signal for longer pulse widths compared with short excitation pulses (shown in Fig. 2 A).
Figure 2.
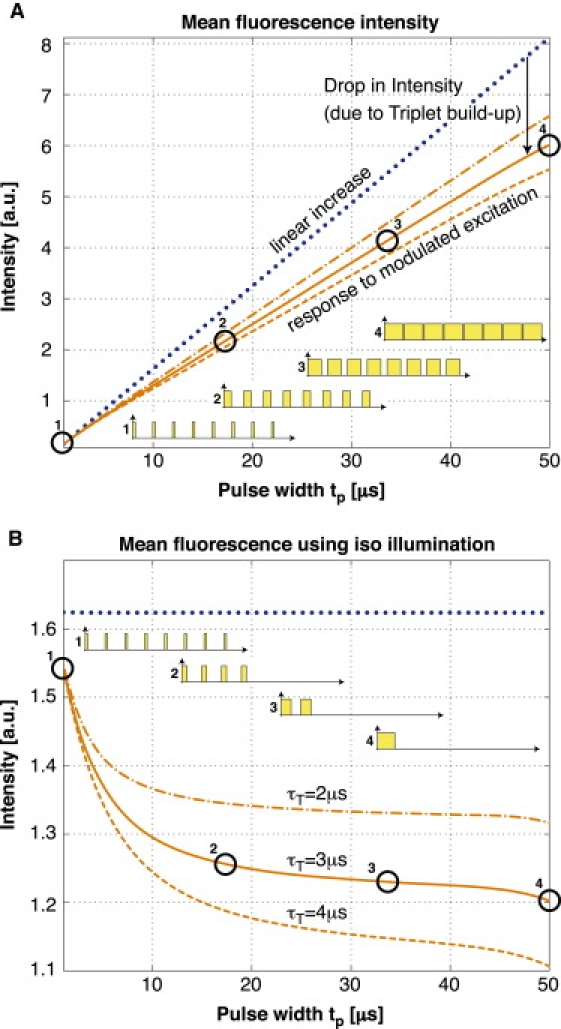
Simulation: (A) Typical fluorescence signal for different pulse widths at 50-μs repetition rate. The drop in intensity compared with the linear increase originates from an increased average triplet-state population. This limits the molecules available in the singlet states and therefore decreases the fluorescent signal. (B) The same system illuminated with an isodosis of light exposure for all different pulse patterns as illustrated next to the curves.
The above result further indicates that modulated excitation can be specifically employed to improve the signal intensity. This principle is used in the triplet relaxation modality proposed by Donnert et al. (24,25).
To increase the contrast of the kinetics-related variations and to avoid the need for a high dynamic range, we remove the strong linear increase of this signal by illumination with an isodosis of light exposure for all different pulse patterns. This is achieved by varying the number of pulses (see Fig. 2 for illustration). The resulting response for the average fluorescence intensity (Fig. 2 B) can be derived from Eq. 1 using (1/τ10 + 1/τisc) ≈ 1/τ10; the evolution of the triplet state population PT is described by a second-order differential equation:
| (2) |
Assuming a rectangular excitation, separated into an on- and an off-period, allows the equation to be solved for the respective states using an onset (Ansatz) of the form
| (3) |
The boundary conditions are determined by the steady-state assumption (e.g., continuous pulses). This leads to an expression for the average fluorescence intensity for an isodosis of light exposure,
| (4) |
where k2 describes the population rate of the triplet state after onset of excitation, PTeq is the relative triplet state population at equilibrium for constant excitation, and is a scaling factor that depends on the concentration of fluorophores and the detection efficiency; these values are given as
where tp denotes the pulse width; Tp the repetition rate; and τ10, τT, and τex express the respective lifetimes as used in Eq. 1. Further, is the local concentration of fluorophores, η is a conversion factor between the emitted intensity and the digital readout of the camera, and is the quantum efficiency of the fluorophores and the triplet quantum yield is given by .
Oxygen
The diradical oxygen molecule exhibits the special property of having the triplet configuration as the lowest energy state (ground state) (26–28). This unique feature renders O2 an important acceptor for energy transfers from the long-lived triplet state of a fluorescent molecule (Fig. 1 A). The concept of triplet-state quenching by oxygen has been known for a long time (29); it is exploited for measuring oxygen concentrations by phosphorescence lifetime in which high oxygen concentrations lead to shorter phosphorescence lifetimes (3,4,22,30). However, because of the low quantum yield and the slow turnover, phosphorescence leads only to low-intensity signals.
For fluorescent molecules, triplet-state quenching by oxygen is ambiguous. Because it induces transition back to the ground state, it helps control the essentially dark triplet states by allowing reexcitation and emission of the molecule. However, in doing so, it photosynthesizes singlet-oxygen—which is a highly reactive radical and a prominent source for photobleaching and cell phototoxicity (31–35).
Oxygen versus triplet lifetime
The relationship between the concentration of a quencher (oxygen) and the triplet lifetime is described by the Stern-Volmer equation (36,37),
| (5) |
where τT0 is the triplet lifetime in the absence of the quencher and kq is a quenching constant obtained by the Smoluchowski equation
| (6) |
and where D are the diffusion coefficients of the quencher and the fluorophore, R is the radius of interaction between quencher and fluorophore, r is the quenching efficiency, and NA is Avogadro's number.
To obtain an accurate relation between triplet lifetime τT and oxygen concentration [O2], constants τT0 and kq both need to be known precisely.
In the presence of reducing and oxidizing systems, alternative relaxation pathways exist for the triplet state, as has been demonstrated by Rehm and Weller (38). In more recent work, this knowledge has been exploited for improved photostability (39,40). Biological cells are complex systems with many different organelles and local environments, including different reducing and oxidizing systems. Further, a cell cannot be considered as a homogenous medium and hence, we also expect varying diffusion constants. At present, it is not possible to determine and in a precise manner for all different and nonstationary organelles of a cell. Therefore, we propose to limit the observation to the triplet state relaxation rate kT, which is the inverse of the triplet lifetime:
| (7) |
Assuming that a variation in the concentration of the quencher does not influence nor , we may express the variation of the concentration as
| (8) |
In other words, the variation of the quencher concentration is proportional to the variation in the triplet relaxation rate .
Triplet imaging setup
The system used for our experiments consists of a microscope (Axiovert 200, Obj.: Plan-Neofluar 40×/0.75 Ph2; Carl Zeiss, Oberkochen, Germany) with a custom-made excitation setup (as shown in Fig. 3 A) integrating a Millennia Pro laser (10s Nd:YVO4, λ = 532 nm; Newport Spectra Physics, Santa Clara, CA). An output power of >7 W was required for a full-field illumination to reach an illumination intensity corresponding nearly to saturation of the fluorescent molecules. The beam was focused to a diameter of ≈175 μm in the sample plane, resulting in a maximum intensity of ≈0.59 mW/μm2. Fast modulation of the laser beam was achieved by an acousto-optical modulator (model No. M200-4B/E-LD4 with driver A341 for a rise-time of ≈10 ns; Gooch and Housego, Highland Heights, OH). The pulse sequence was generated with a function generator (model No. 33250A 80 MHz; Agilent, Santa Clara, CA). Splitting and filtering of excitation and emission signals was achieved by special filters (Z532/10×, Q565LP, HQ620/100m; Chroma Technology, Rockingham, VT) and the detection was done by an electromagnetic charge-coupled device camera (Luca; Andor Technology, Belfast, Northern Ireland).
Figure 3.
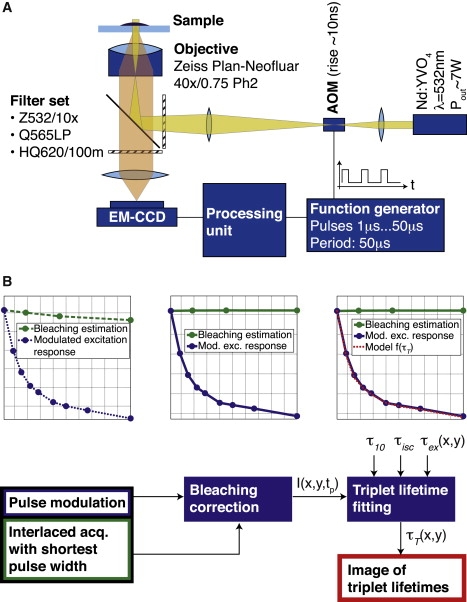
(A) Triplet-state imaging setup. Beamshaping ensures a spot radius of ≈175 μm at the sample plane, resulting in a maximum intensity of ≈0.6 mW/μm2. (B) Image processing steps. Step 1: Photobleaching is assessed by fitting a monoexponential decay to the measured bleaching estimation curve. Step 2: All data points are normalized to the nonbleached fraction of fluorophores. Step 3: Pixel per pixel, the triplet parameters are extracted from the image stack involving prior knowledge of the lifetimes τ10, τisc, and τex(x, y).
All devices were controlled with a MATLAB (The MathWorks, Natick, MA) application enabling convenient and rapid acquisition.
Image processing
To extract the triplet lifetime, extensive image processing is necessary as illustrated schematically in Fig. 3 B.
Most importantly, the intensity decrease due to photobleaching needs to be clearly separated from the triplet lifetime kinetics-related decrease. For this purpose, we estimated bleaching by interlaced bleaching measurements at the shortest pulse width. The measured photobleaching curve (Fig. 4 A, green curve) was modeled by a decaying exponential and fitted using an efficient algorithm based on the Poisson noise assumption (41). The fitted decay parameters were then used to correct the modulated excitation response curve (Fig. 4 A, blue curve).
Figure 4.
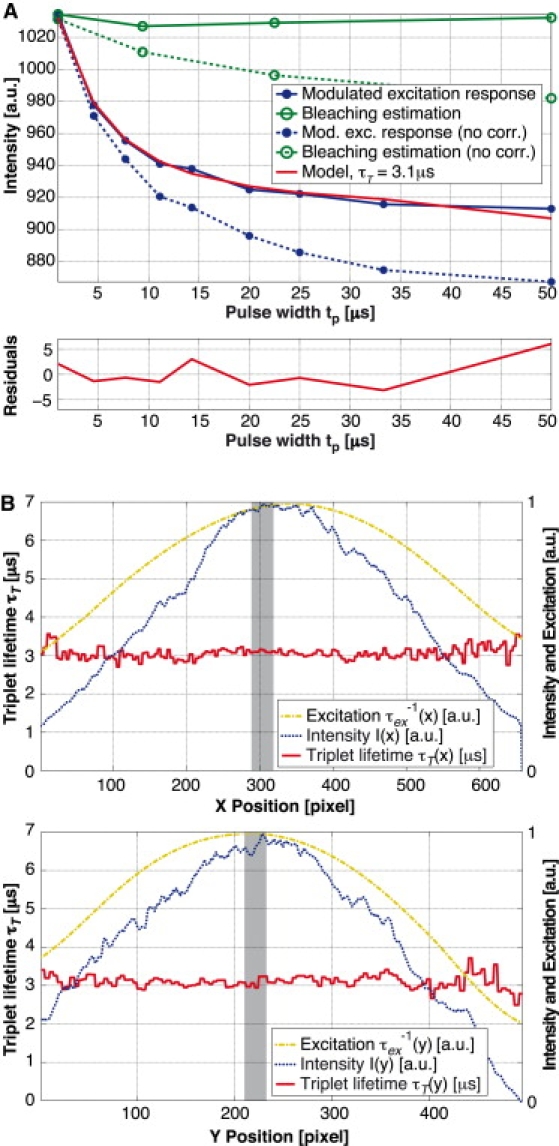
Observation of TMR adhering to a glass cover slide with a water droplet on top of the fluorophores. Measurement parameters: tp = 1–50 μs, Tp = 50 μs, P = 7W, and till = 0.1 ms/pulse pattern. Nine images measuring the response to a modulated excitation and four bleaching estimation images acquired at the shortest pulse width. (A) Intensity for the different pulse widths. The curves are based on a spatial average over 30 × 30 px in the center of the acquired images. The bleaching estimation measurement points have been plotted to reflect the moment they have been taken and not at their specific pulse width of 1 μs. Global fitting leads to τisc = 1.17 μs. (B) Cross sections of the triplet lifetime fit in x and y directions (with a respective slice width and height of 30 px) in comparison with the mean fluorescence intensity over all pulse patterns as well as the fitted Gaussian excitation intensity. The shaded areas illustrate the region for the average that is shown in panel A.
The next processing step was the fitting of the triplet lifetime. For this, we fixed the values for the singlet lifetime τ10, the intersystem crossing rate kisc, and the excitation rate . We assumed τ10 and kisc to be constant over the whole image. For TMR, we measured τ10 = 2.3 ns on a dedicated fluorescence lifetime setup (42) with single photon-counting capability (PicoQuant Sepia II ps laser LDH-D-C-470, MPD PDM 50ct, and PicoHarp 300; PicoQuant Photonics, Westfield, MA). The same fluorescence lifetime value for TMR was also measured by Eggeling et al. (43). The absorption cross section has been estimated using the absorption spectrum (Invitrogen, Carlsbad, CA) and a published value for TMR of σ10 (λ = 515 nm) = 1.33 × 10⁻¹⁶ cm2 (43). We used an absorption cross section of σ10 (λ = 532 nm) = 1.86 × 10⁻¹⁶ cm2. The intersystem crossing rate for a particular experiment was estimated by a global fit of kisc and τT. Because the intersystem crossing rate could vary between different biological cells, we repeated this global fit for every experiment. For improved reliability we took typically 3–5 measurements of a particular cell and kisc was set to the average of these measurements for an experiment. As the diameter of our excitation spot was smaller than the size of our image, the spatial profile of the excitation rate had to be taken into account. We assumed a Gaussian illumination profile, the position and beam width of which were estimated using a uniform layer of TMR deposited on and bound to a cover slide. However, fitting a Gaussian profile to the measured intensity did not lead to satisfactory results for τT over the whole range of the image. Hence, an iterative fit of the triplet lifetime was used to optimize the excitation beam profile parameters to obtain a homogeneous triplet lifetime, as one would expect in such an experiment. Fig. 4 B shows the respective cross sections of the assumed excitation shape in comparison with the measured intensity profile. To determine not only the shape but also the value of the excitation rate, we measured the optical power transmitted through our system and calculated the maximum excitation rate at the center of the excitation spot. Therefore, the triplet imaging fit was reduced to finding two parameters for each individual pixel: the triplet lifetime τT and the factor γ (which is proportional to the intensity of a specific region). Fitting these two (nonlinear) parameters by a standard optimization technique such as the Marquardt-Levenberg algorithm is very slow, and hence, not suitable for processing an acquisition of nine images containing 496 × 658 pixels. We circumvented this time-consuming step and used an alternating least-squares approach for fast fitting. This resulted in typical fitting times of ∼90 s for 152 × 115 × 9 pixels on a standard desktop computer (Xeon 3.2 GHz, 2 GB RAM; Intel, Santa Clara, CA).
For the cell images, we performed an averaging of the triplet lifetimes of three sequentially recorded measurements (2 s per measurement) to improve the measurement quality. The triplet relaxation values , shown in the temporal evolution of the contraction experiments, correspond to the mean values of three consecutive measurements (kT, j to kT, j+2):
| (9) |
The standard deviations indicated for these measurements correspond to the mean standard deviations calculated over all measurements subtracted by these respective mean values:
| (10) |
Model system for calibration
Adhesion of TMR (5-(and-6)-carboxytetramethylrhodamine, succinimidyl ester), i.e., TAMRA; Invitrogen, Carlsbad, CA) on a glass cover slide has been achieved by using bovine serum albumin (BSA) as intermediate linker between the glass cover slide and the TMR-molecules. After deposition of a droplet of BSA on a glass cover slide, the slide was washed with 3 mL deionized water. In a second step, a droplet of TMR was applied. After 1 min, the solution was washed with 5 mL deionized water. These test samples were covered with water during the measurements, either with a droplet of water on top or by putting the slide inside a flow cell containing water. These samples served as a simple model for calibration of the experimental setup.
For the oxygen measurements, we used the enzyme ascorbase (Sigma-Aldrich, St. Louis, MO) for catalysis of the oxidation of L-ascorbic acid (Sigma-Aldrich) according to the following reaction:
| (11) |
Titration of L-ascorbic acid removes oxygen from a solution in a controlled way (37). The final reaction mix consisted of 3 mL H2O, 10 units ascorbase (1 unit oxidizes 1 μmole of L-ascorbic acid per min), 20 mM sodium phosphate buffer, and 0.05‰ (w/v) BSA. Adding 300 μL of a solution of 25.5 mM L-ascorbic acid removes all dissolved oxygen inside 3 mL of H2O at room temperature, provided that there is no reoxygenation from the environment.
To minimize the oxygen uptake during the experiment the observation was done in a custom-made polydimethylsiloxane flowcell, with an observation volume of ≈20 mm3 connected by tubing with low gas permeability (Fluran HCA with inner diameter of 0.89 mm; Ismatec, Glattbrugg, Switzerland) to a peristaltic pump (Reglo Digital, Ismatec) at 1.5 μL/s. The solution reservoir was placed in a larger container connected to a low continuous flow of nitrogen. The L-ascorbic acid doses were added with a syringe through a tiny access hole in the container.
This model system allowed a verification of the acquisition method and the fitting algorithm for different oxygen concentrations. As a control, we measured the oxygen concentration inside the reservoir with an oxygen probe (SG6 Seven Go Pro dissolved oxygen meter with InLab 605 sensor; Mettler-Toledo, Greifensee, Switzerland).
Smooth muscle cells A7r5 and TMR labeling
For biological measurements, we used the rat thoracic aorta smooth muscle cell line A7r5 (44) (cat. No. CRL-1444; LGC Promochem, Wesel, Germany) cultured in Dulbecco's modified eagle medium (DMEM, cat. No. 41965; GIBCO, Invitrogen) supplemented with 10% fetal calf serum (FCS). We used two different labeling protocols: one to realize transient transfections and one for stable transfections. For the stable transfection we used A7r5 cells stably transfected with pNuc SNAP β-gal plasmids expressing a fusion protein of SNAP-tag and β-galactosidase (SNAP-β-gal); SNAP-tag fusion proteins can be specifically labeled with different fluorophores in living cells (45). Stably transfected clones expressing SNAP-β-gal fusion proteins were selected by adding 2 mg/mL geneticin disulfate salt (cat. Nos. G418 and G5013; Sigma Chemical, St. Louis, MO) to the culture medium.
For the transient transfection, we used the same A7r5 cell line that we had transfected according to a standard transfection protocol with the JetPEI transfection reagent (cat. No. 101-05; Polyplus Transfection, Illkirch, France), using 2 μg plasmid DNA per 35-mm dish. The transient transfections were started 24–48 h before the experiment.
Two days before experiments (and, respectively, one day before the transfection) the cells were transferred to 3.5-cm microscope observation dishes (Ibidi, Martinsried, Germany) that were coated with collagen.
The day of the experiment, cells were labeled by loading the dishes for 5 min at room temperature with 200 μL of a solution of 1 μM TMR-Star (cat. No. LK040; Covalys, Witterswil, Switzerland) in DMEM with 10% FCS. Cells were then washed three times in DMEM with 10% FCS, and incubated for 5 min at each step at 37°C. Finally the cells were incubated for at least 3 h until the experiment. Before measurements, the medium was replaced by a Hank's Buffered Salt Solution (GIBCO).
Cell contraction was induced using [Arg8]-vasopressin acetate salt (cat. No. V9879; Sigma Chemical) at a final concentration of 500 nM [Arg8]-vasopressin (AVP). This hormone is well known to initiate a vasoconstriction of the smooth muscle cells at this concentration (46,47).
Results
Model system: TMR on cover slide
Fig. 4 A shows a typical modulated excitation response and a bleaching estimation curve for a measurement of a TMR layer adhering to a glass cover slide. With the bleaching estimation, photobleaching could be taken into account accurately, as shown by the corrected fluorescence responses. By global fitting we found τisc = 1.17 μs. The average triplet lifetime is ∼τT = 3.1 μs. These values are comparable to values measured for TMR in solution: τisc = 1.85 μs and τT = 2.5 μs (43). The cited values were measured with fluorescence correlation spectroscopy and varying excitation intensity (48). The differences from our results are probably due to higher order artifacts as described in the discussion.
Triplet lifetime versus oxygen concentration
We performed calibration experiments by lowering the dissolved oxygen concentration in discrete steps by titration of L-ascorbic acid. In parallel to the triplet lifetime acquisitions, the dissolved oxygen concentration was monitored with an oxygen probe as reference. As shown in Fig. 5 A, the probe revealed the linear decrease in dissolved oxygen as expected in theory, which demonstrates that the titration of L-ascorbic acid is indeed proportional to the removed amount of dissolved oxygen. The graph of the triplet state relaxation rate kT (= 1/τT) (Fig. 5 C) also demonstrates a linear relationship, which suggests that the molecules' response to oxygen can be described by the Stern-Volmer model. This proves that TMR as reporter molecule measured with our method works well for determining different oxygen concentrations. However, despite a minimized surface in contact with air, reoxygenation of the sample could not be prevented totally. Due to this, the titration of 300 μL L-ascorbic acid did not remove all oxygen in the solution. Nevertheless, the experiment allowed us to measure the response of our system in physiological conditions, and it demonstrates nicely the linearity of the quenching mechanism.
Figure 5.
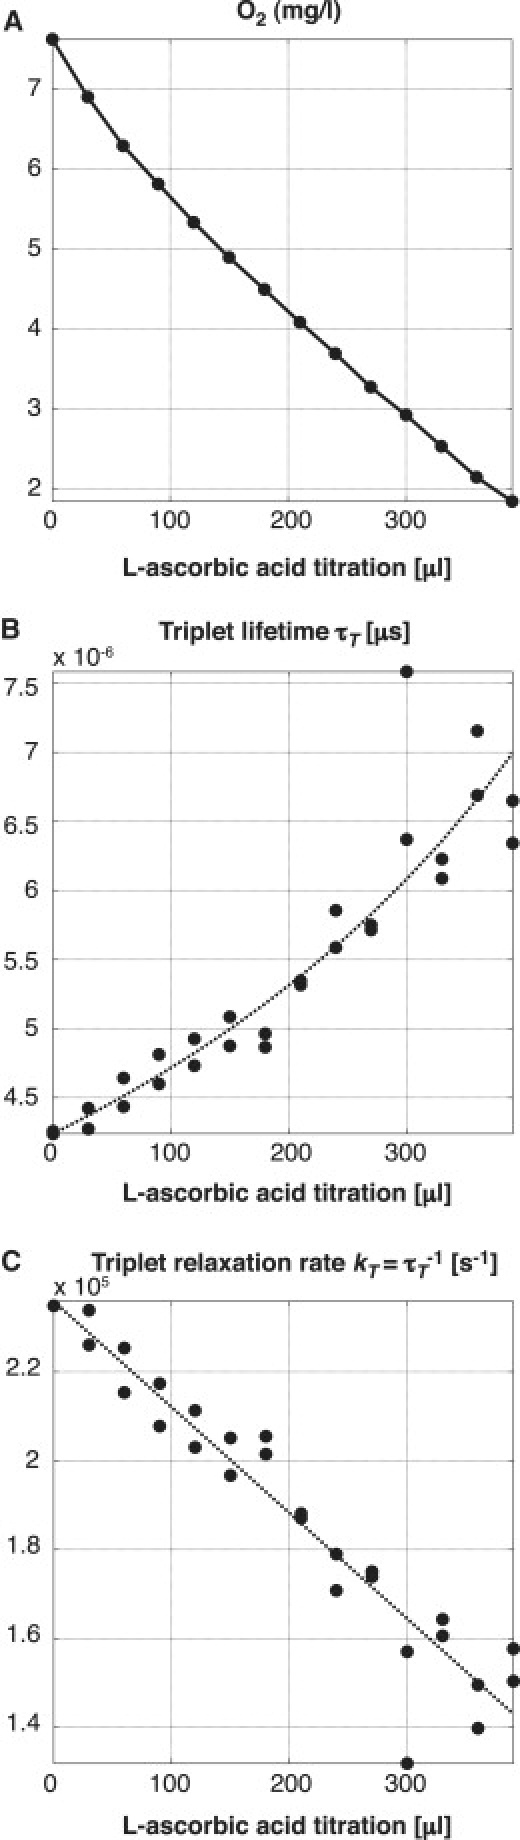
Observation of TMR adhering to a glass cover slide in a flow cell setup with ascorbase in solution. Titration of 25.5 mM L-ascorbic acid removes the oxygen in controlled discrete steps. (A) Dissolved oxygen as measured by a commercial probe (Mettler-Toledo). (B) Triplet lifetime measurement using an average intersystem crossing of τisc = 0.69 μs obtained by a global fitting over seven measurements. (C) Triplet-state relaxation rate.
Triplet lifetime inside single smooth muscle cells A7r5
To test our triplet imaging method in a biologically relevant context, we performed AVP stimulated contraction experiments with smooth muscle cells. The fluorescence signal originates from TMR linked to SNAP-tag-β-galactosidase, which is a cytosolic protein linked to a tag for labeling (49).
Fig. 6 shows two typical experiments. In Fig. 6, A2 and B2, the color encodes the different triplet lifetimes, whereas the intensity is proportional to the fluorescence intensity. Fig. 6, A3 and B3, shows the temporal evolution of the triplet relaxation rate over a selected area (white square on the corresponding images on the left side). As mentioned above, the variation in kT = 1/τT is proportional to the variation in the oxygen concentration. After global stimulation with 500 nM AVP, the cells undergo a contraction. This leads to oxygen consumption inside the cell, which can be observed on the temporal evolution of the triplet relaxation rate. To achieve longer measurement times and minimal phototoxicity for the cells, we have compromised the image quality slightly by reducing the excitation power. However, one can easily obtain better resolutions and higher signal quality when using higher excitation levels. (Such an image is not shown here but it can be found in Movie S1, Movie S2, and Movie S3 in the Supporting Material.)
Figure 6.
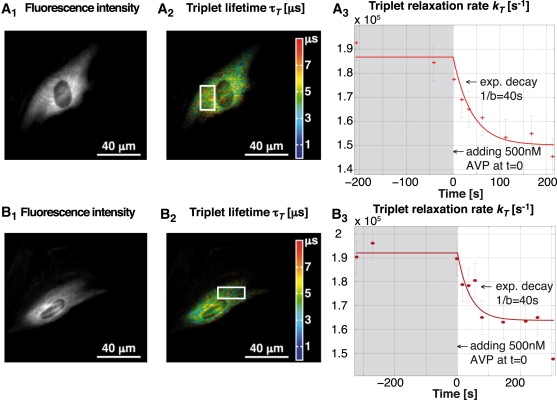
Two experiments on contraction of smooth muscle cells A7r5 with transient transfections of the cytosolic fusion protein β-galactosidase (SNAP-β-gal) employed for the labeling with TMR. Contraction was initiated with [Arg8]-vasopressin (AVP). (A2 and B2) Triplet lifetime image with color-encoded lifetime. (A3 and B3) Temporal evolution of the average triplet relaxation rate for the region inside the white rectangle. The result indicates a variation in the oxygen concentration after a monoexponential decay (the approximate decay parameter was estimated from multiple experiments). We used (A) τisc = 2.12 μs and (B) τisc = 2.01 μs; both values were obtained by global fitting on several measurements. The image quality was optimized for multiple measurements. A typical triplet lifetime image with higher spatial resolution can be found in the Supporting Material.
The results of three measurements with global AVP stimulation are shown in Fig. 7 A1, in comparison with two negative controls without addition of AVP. In Fig. 7 A2, the temporal evolutions are normalized with respect to their initial and final steady states. For the negative controls we used a factor of 0.4 × 10⁻⁵ for the normalization corresponding to a typical difference between the steady-state values before and after adding AVP.
Figure 7.
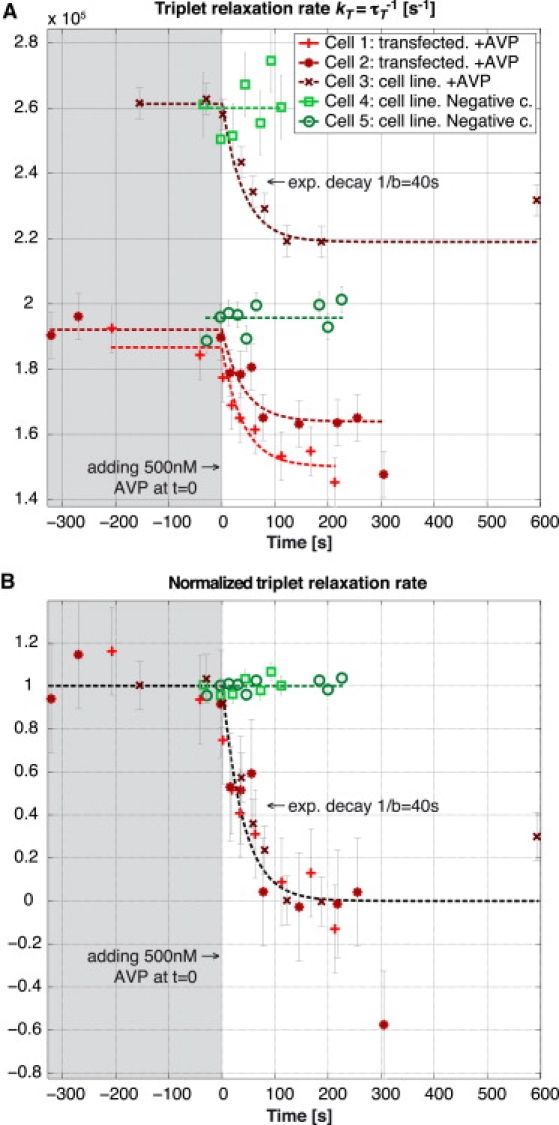
Three experiments on contraction of smooth muscle cells A7r5 upon addition of AVP and two negative controls where no AVP was added. (A) Average triplet relaxation rate measured on a small area inside the respective cells. (B) Relaxation rates normalized with respect to the initial and final steady state. For the negative controls we used a factor of 0.4 × 10⁻⁵ for the normalization, corresponding to a typical difference between the steady-state values before and after adding AVP. Global fitting was used to determine the respective intersystem crossing rates τisc leading to the following values: (cell 1) 2.12 μs; (cell 2) 2.01 μs; (cell 3) 1.19 μs; (cell 4) 1.08 μs; and (cell 5) 2.01 μs. See Movie S1, Movie S2, and Movie S3 for depictions of the three experiments.
The temporal evolution presented in the three curves has been observed in 84% of the observed cells (n = 25). The remaining 16% of cells did not show a visible decrease in triplet relaxation rate after the addition of AVP, which is similar to the negative control experiments (n = 5).
Discussion
The L-ascorbic acid titration experiment (Fig. 5) demonstrates that the proposed method is able to determine variations in oxygen concentration. The sensitivity of this method is not as good as in other methods (3,12,37). However, the high intensity of the fluorescence signal enables a combined performance of temporal and spatial resolution well beyond that which can be achieved with methods based on phosphorescence quenching or other mechanisms leading to low-intensity signals.
As high laser excitation power is required to increase the contrast based on the triplet state buildup, we reduced the acquisition times such that there is illumination during only 1.2 ms per acquisition of 12 images. Despite using a fairly photostable fluorophore, bleaching has been an important issue. Typically at the end of an experiment (after ∼30 acquisitions of 12 images each), the fluorescence signal corresponds to ∼20% of the initial intensity, limiting the total number of acquisitions that can be made on the same cell.
Nevertheless, the proposed functional imaging method was successfully applied in a study of oxygen consumption during drug-induced contraction of single smooth muscle cells (Fig. 7). In most cells, we measured monoexponentially falling intracellular oxygen concentration without initial delay upon the addition of 500 nM AVP. On average, we found a typical decay constant of ≈ 40 s for these cells. These positive results can be compared to experiments in which no AVP was added (Fig. 7, cells 4 and 5).
Triplet lifetime images of cells (see Fig. 6 and Supporting Material for a high spatial resolution image) reveal areas of long (yellow-red color code) and short triplet lifetimes with heterogeneous cellular distribution. In general, these areas indicate different oxygen concentrations as well as different local environments of the dyes. Biological cells contain various organelles and exhibit different subcellular compartments with corresponding dimensions that can locally influence the triplet-state lifetime. In particular, organelles of the endosomal and lysosomal compartments are characterized by distinct pH. Large shifts in the pH will lead to noticeable changes in the triplet state of the dyes. Another explanation for these areas may be the mitochondrial sites—the main oxygen-consuming organelles in a cell. This is corroborated by matching triplet lifetime images with phase contrast images, in which mitochondria appear as phase-dense circular structures with ≈1-μm diameter. Our data indicate that in subcellular areas with a lower density of these structures, the corresponding triplet relaxation rate is significantly higher (see phase contrast image right of the nucleus in Movie S3). This example may indicate an intracellular oxygen gradient, created by the absence of mitochondria in this area. To this end, we can only reasonably speculate on the nature of the subcellular compartments coinciding with distinct triplet lifetimes. Further experiments using specific compartmental marker proteins will be needed to clarify their nature.
We observed rather large differences between different cells in their triplet relaxation rate kT as well as their intersystem crossing rate kisc. When analyzing the deviating measurements, we found differences in the bleaching correction in contrast to experiments that lead to kisc ≈ 2 μs. The deviating correction leads to a systematic small hump on the corrected modulated excitation response for pulse widths at ∼15 μs (as also visible in Fig. 4 A). This probably accounts for the higher intersystem crossing rates (and lower triplet lifetimes). We think the effect stems from higher order energy states that start to be populated for longer excitation pulses (tp > 10 μs). This would lead to an additional kinetic response upon modulated excitation that we have not taken into account in the current three-state model. Correcting for this higher order effect would require a more-advanced bleaching estimate measurement, which is beyond the scope of this article.
As described above, there was an important decrease in fluorescence intensity over a full experiment. This led to difficulties in fitting low-intensity measurements at the end of the experiment and explains the deviations of the two outliers at the very end of the measurement of cells 2 and 3. Hence, the standard deviation, as described in Materials and Methods, is actually expected to grow with measurement time although the measurements themselves do not indicate it.
Our measurements demonstrate that the proposed method is well suited to address biological questions about fast oxygen kinetics at the cellular and subcellular levels. Our results are in accordance with previously reported measurements of oxygen consumption during contraction of skeletal muscle fibers of X. laevis (21) as well as with indirect measurements of the oxygen uptake of single cells in a sealed chamber (23).
The method could be further refined by taking care of variations of the intersystem crossing rate kisc during the experiment. Such effects could be caused by variations of the singlet oxygen concentrations. In some cases with strong labeling (e.g., when labeling the cells with nuclear localized proteins), we did indeed see continuous variations of the intersystem crossing rate during the experiment, which might have been due to increased photosensitized singlet oxygen. Taking higher triplet states into account might improve the parameter extraction, but it would be at the expense of a far more complicated fitting procedure and the potential risk of a less robust fitting.
Conclusion
We have outlined a novel concept for functional wide-field microscopy that enables us to image the triplet kinetics of fluorescent probes. Using a rapidly modulated excitation and a slow camera, spatio-temporal variations of the triplet state kinetics of many standard fluorophores can be assessed.
Firstly, we validated our concept on thin TMR films deposited on microscope coverslips. An oxygen depletion experiment resulted in a proportional decrease of the measured triplet relaxation rate kT (= 1/τT) as predicted by the well-known Stern-Volmer equation. Secondly, measurements of the oxygen consumption of single smooth muscle cells A7r5 showed a monoexponential decay of the intracellular oxygen concentration upon stimulated contraction. The decay started without measurable delay and had a characteristic decay time of 40 s, which is in good agreement with measured oxygen consumption in skeletal muscle fibers reported by Hogan et al. (21).
In our opinion, the proposed triplet-state imaging concept is a valid tool for investigating inter- and intracellular oxygen concentration variations in live cells or small tissue fragments. It is particularly attractive because it is able to image the metabolism of live cells with a time resolution of ∼1 s at a state-of-the-art spatial resolution and field-of-view.
Acknowledgments
This work was funded by the European Commission within the Sixth Research Framework Program.
Supporting Material
References
- 1.Chandel N.S., Budinger G.R. The cellular basis for diverse responses to oxygen. Free Radic. Biol. Med. 2007;42:165–174. doi: 10.1016/j.freeradbiomed.2006.10.048. [DOI] [PubMed] [Google Scholar]
- 2.Springett R., Swartz H.M. Measurements of oxygen in vivo: overview and perspectives on methods to measure oxygen within cells and tissues. Antioxid. Redox Signal. 2007;9:1295–1301. doi: 10.1089/ars.2007.1620. [DOI] [PubMed] [Google Scholar]
- 3.Vanderkooi J.M., Maniara G., Wilson D.F. An optical method for measurement of dioxygen concentration based upon quenching of phosphorescence. J. Biol. Chem. 1987;262:5476–5482. [PubMed] [Google Scholar]
- 4.Rumsey W.L., Vanderkooi J.M., Wilson D.F. Imaging of phosphorescence: a novel method for measuring oxygen distribution in perfused tissue. Science. 1988;241:1649–1651. doi: 10.1126/science.241.4873.1649. [DOI] [PubMed] [Google Scholar]
- 5.Vanderkooi J.M., Wright W.W., Erecinska M. Oxygen gradients in mitochondria examined with delayed luminescence from excited-state triplet probes. Biochemistry. 1990;29:5332–5338. doi: 10.1021/bi00474a018. [DOI] [PubMed] [Google Scholar]
- 6.Xu W., McDonough R.C., 3rd, DeGraff B.A. Oxygen sensors based on luminescence quenching: interactions of metal complexes with the polymer supports. Anal. Chem. 1994;66:4133–4141. doi: 10.1021/ac00095a004. [DOI] [PubMed] [Google Scholar]
- 7.Hartmann P., Leiner M., Lippitsch M. Luminescence quenching behavior of an oxygen sensor based on a RuII complex dissolved in polystyrene. Anal. Chem. 1995;67:88–93. [Google Scholar]
- 8.Demas J.N., DeGraff B.A., Coleman P.B. Oxygen sensors based on luminescence quenching. Anal. Chem. 1999;71:793A–800A. doi: 10.1021/ac9908546. [DOI] [PubMed] [Google Scholar]
- 9.Papkovsky D.B. New oxygen sensors and their application to biosensing. Sens. Actuators B Chem. 1995;B29:213–218. [Google Scholar]
- 10.Finikova O., Chen P., Vinogradov S. Dynamic quenching of porphyrin triplet states by two-photon absorbing dyes: towards two-photon-enhanced oxygen nanosensors. J. Photochem. Photobiol. Chem. 2008;198:75–84. doi: 10.1016/j.jphotochem.2008.02.020. [DOI] [PMC free article] [PubMed] [Google Scholar]
- 11.Finikova O.S., Lebedev A.Y., Vinogradov S.A. Oxygen microscopy by two-photon-excited phosphorescence. ChemPhysChem. 2008;9:1673–1679. doi: 10.1002/cphc.200800296. [DOI] [PMC free article] [PubMed] [Google Scholar]
- 12.Koo Y.-E., Cao Y., Philbert M.A. Real-time measurements of dissolved oxygen inside live cells by organically modified silicate fluorescent nanosensors. Anal. Chem. 2004;76:2498–2505. doi: 10.1021/ac035493f. [DOI] [PubMed] [Google Scholar]
- 13.Evans R.C., Douglas P., Rochester D.L. A novel luminescence-based colorimetric oxygen sensor with a “traffic light” response. J. Fluoresc. 2006;16:201–206. doi: 10.1007/s10895-005-0037-9. [DOI] [PubMed] [Google Scholar]
- 14.Gerritsen H., Sanders R., Levine Y. Fluorescence lifetime imaging of oxygen in living cells. J. Fluoresc. 1997;7:11–15. doi: 10.1007/BF01881442. [DOI] [PubMed] [Google Scholar]
- 15.Sud D., Mycek M.-A. Calibration and validation of an optical sensor for intracellular oxygen measurements. J. Biomed. Opt. 2009;14:020506. doi: 10.1117/1.3116714. [DOI] [PubMed] [Google Scholar]
- 16.Mik E.G., Johannes T., Ince C. In vivo mitochondrial oxygen tension measured by a delayed fluorescence lifetime technique. Biophys. J. 2008;95:3977–3990. doi: 10.1529/biophysj.107.126094. [DOI] [PMC free article] [PubMed] [Google Scholar]
- 17.Mik E.G., Stap J., Ince C. Mitochondrial PO2 measured by delayed fluorescence of endogenous protoporphyrin IX. Nat. Methods. 2006;3:939–945. doi: 10.1038/nmeth940. [DOI] [PubMed] [Google Scholar]
- 18.Mik E.G., Ince C., Zuurbier C.J. Mitochondrial oxygen tension within the heart. J. Mol. Cell. Cardiol. 2009;46:943–951. doi: 10.1016/j.yjmcc.2009.02.002. [DOI] [PubMed] [Google Scholar]
- 19.Sandén T., Persson G., Widengren J. Monitoring kinetics of highly environment sensitive states of fluorescent molecules by modulated excitation and time-averaged fluorescence intensity recording. Anal. Chem. 2007;79:3330–3341. doi: 10.1021/ac0622680. [DOI] [PubMed] [Google Scholar]
- 20.Sandén T., Persson G., Widengren J. Transient state imaging for microenvironmental monitoring by laser scanning microscopy. Anal. Chem. 2008;80:9589–9596. doi: 10.1021/ac8018735. [DOI] [PubMed] [Google Scholar]
- 21.Hogan M.C. Fall in intracellular PO2 at the onset of contractions in Xenopus single skeletal muscle fibers. J. Appl. Physiol. 2001;90:1871–1876. doi: 10.1152/jappl.2001.90.5.1871. [DOI] [PubMed] [Google Scholar]
- 22.Hogan M.C. Phosphorescence quenching method for measurement of intracellular PO2 in isolated skeletal muscle fibers. J. Appl. Physiol. 1999;86:720–724. doi: 10.1152/jappl.1999.86.2.720. [DOI] [PubMed] [Google Scholar]
- 23.Kindig C.A., Kelley K.M., Hogan M.C. Assessment of O2 uptake dynamics in isolated single skeletal myocytes. J. Appl. Physiol. 2003;94:353–357. doi: 10.1152/japplphysiol.00559.2002. [DOI] [PubMed] [Google Scholar]
- 24.Donnert G., Eggeling C., Hell S.W. Major signal increase in fluorescence microscopy through dark-state relaxation. Nat. Methods. 2007;4:81–86. doi: 10.1038/nmeth986. [DOI] [PubMed] [Google Scholar]
- 25.Donnert G., Eggeling C., Hell S.W. Triplet-relaxation microscopy with bunched pulsed excitation. Photochem. Photobiol. Sci. 2009;8:481–485. doi: 10.1039/b903357m. [DOI] [PubMed] [Google Scholar]
- 26.Mulliken R. The interpretation of band spectra part III. Electron quantum numbers and states of molecules and their atoms. Rev. Mod. Phys. 1932;4:1–86. [Google Scholar]
- 27.Kearns D. Physical and chemical properties of singlet molecular oxygen. Chem. Rev. 1971;71:395–427. [Google Scholar]
- 28.Krasnovsky A.A., Jr. Luminescence and photochemical studies of singlet oxygen photonics. J. Photochem. Photobiol. 2007 [Google Scholar]
- 29.Kautsky H., Müller G. Luminescence quenching by oxygen: detection of minimal amounts of oxygen. Z. Naturforsch. A. 1947;2:167–172. [Google Scholar]
- 30.Vinogradov S.A., Wilson D.F. Phosphorescence lifetime analysis with a quadratic programming algorithm for determining quencher distributions in heterogeneous systems. Biophys. J. 1994;67:2048–2059. doi: 10.1016/S0006-3495(94)80688-5. [DOI] [PMC free article] [PubMed] [Google Scholar]
- 31.Mitra S., Foster T.H. Photochemical oxygen consumption sensitized by a porphyrin phosphorescent probe in two model systems. Biophys. J. 2000;78:2597–2605. doi: 10.1016/S0006-3495(00)76804-4. [DOI] [PMC free article] [PubMed] [Google Scholar]
- 32.Georgakoudi I., Foster T.H. Singlet oxygen- versus nonsinglet oxygen-mediated mechanisms of sensitizer photobleaching and their effects on photodynamic dosimetry. Photochem. Photobiol. 1998;67:612–625. [PubMed] [Google Scholar]
- 33.Stracke F., Heupel M., Thiel E. Singlet molecular oxygen photosensitized by Rhodamine dyes: correlation with photophysical properties of the sensitizers. J. Photochem. Photobiol. Chem. 1999;126:51–58. [Google Scholar]
- 34.Valeur B. Wiley-VCH; Weinheim, Germany: 2002. Molecular Fluorescence: Principles and Applications. [Google Scholar]
- 35.Hoebe R.A., Van Oven C.H., Manders E.M. Controlled light-exposure microscopy reduces photobleaching and phototoxicity in fluorescence live-cell imaging. Nat. Biotechnol. 2007;25:249–253. doi: 10.1038/nbt1278. [DOI] [PubMed] [Google Scholar]
- 36.Stern O., Volmer M. The fading time of fluorescence. Phys. Z. 1919;20:183–188. [Google Scholar]
- 37.Lo L.-W., Koch C.J., Wilson D.F. Calibration of oxygen-dependent quenching of the phosphorescence of Pd-meso-tetra (4-carboxyphenyl) porphine: a phosphor with general application for measuring oxygen concentration in biological systems. Anal. Biochem. 1996;236:153–160. doi: 10.1006/abio.1996.0144. [DOI] [PubMed] [Google Scholar]
- 38.Rehm D., Weller A. Kinetics of fluorescence quenching by electron and H-atom transfer. Isr. J. Chem. 1970;8:259–271. [Google Scholar]
- 39.Vogelsang J., Kasper R., Tinnefeld P. A reducing and oxidizing system minimizes photobleaching and blinking of fluorescent dyes. Angew. Chem. Int. Ed. 2008;47:5465–5469. doi: 10.1002/anie.200801518. [DOI] [PubMed] [Google Scholar]
- 40.Widengren J., Chmyrov A., Seidel C.A. Strategies to improve photostabilities in ultrasensitive fluorescence spectroscopy. J. Phys. Chem. A. 2007;111:429–440. doi: 10.1021/jp0646325. [DOI] [PubMed] [Google Scholar]
- 41.Gatland I.R., Thompson W.J. Parameter bias elimination for log-transformed data with arbitrary error characteristics. Am. J. Phys. 1992;61:269–272. [Google Scholar]
- 42.Leutenegger M., Blom H., Lasser T. Dual-color total internal reflection fluorescence cross-correlation spectroscopy. J. Biomed. Opt. 2006;11:040502. doi: 10.1117/1.2221714. [DOI] [PubMed] [Google Scholar]
- 43.Eggeling C., Widengren J., Seidel C. Photobleaching of fluorescent dyes under conditions used for single-molecule detection: evidence of two-step photolysis. Anal. Chem. 1998;70:2651–2659. doi: 10.1021/ac980027p. [DOI] [PubMed] [Google Scholar]
- 44.Kimes B.W., Brandt B.L. Characterization of two putative smooth muscle cell lines from rat thoracic aorta. Exp. Cell Res. 1976;98:349–366. doi: 10.1016/0014-4827(76)90446-8. [DOI] [PubMed] [Google Scholar]
- 45.Keppler A., Gendreizig S., Johnsson K. A general method for the covalent labeling of fusion proteins with small molecules in vivo. Nat. Biotechnol. 2003;21:86–89. doi: 10.1038/nbt765. [DOI] [PubMed] [Google Scholar]
- 46.Takeda K., Meyer-Lehnert H., Schrier R. AVP-induced Ca fluxes and contraction of rat glomerular mesangial cells. Am. J Physiol. Renal Physiol. 1988;255:F142–F150. doi: 10.1152/ajprenal.1988.255.1.F142. [DOI] [PubMed] [Google Scholar]
- 47.Van Renterghem C., Romey G., Lazdunski M. Vasopressin modulates the spontaneous electrical activity in aortic cells (line A7r5) by acting on three different types of ionic channels. Proc. Natl. Acad. Sci. USA. 1988;85:9365–9369. doi: 10.1073/pnas.85.23.9365. [DOI] [PMC free article] [PubMed] [Google Scholar]
- 48.Widengren J., Mets U., Rigler R. Fluorescence correlation spectroscopy of triplet states in solution: a theoretical and experimental study. J. Phys. Chem. 1995;99:13368–13379. [Google Scholar]
- 49.Keppler A., Pick H., Johnsson K. Labeling of fusion proteins with synthetic fluorophores in live cells. Proc. Natl. Acad. Sci. USA. 2004;101:9955–9959. doi: 10.1073/pnas.0401923101. [DOI] [PMC free article] [PubMed] [Google Scholar]
Associated Data
This section collects any data citations, data availability statements, or supplementary materials included in this article.