Abstract
Surface topography and compression elasticity of bovine cardiac muscle fibers in rigor and relaxing state has been studied with atomic force microscopy. Characteristic sarcomere patterns running along the longitudinal axis of the fibers were clearly observed, and Z-lines, M-lines, I-bands, and A-bands can be distinguished through comparing with TEM images and force curves. AFM height images of fibers had shown a sarcomere length of 1.22±0.02μm (n=5) in rigor with a significant 9% increase in sarcomere length in relaxing state (1.33±0.03μm, n=5), indicating that overlap move with the changing physiological conditions. Compression elasticity curves along with sarcomere locations have been taken by AFM compression processing. Coefficient of Z-line, I-band, Overlap, and M-line are 25±2pN/nm, 8±1pN/nm, 10±1pN/nm, and 17±1.5pN/nm respectively in rigor state, and 18±2.5pN/nm, 4±0.5pN/nm, 6±1pN/nm, and 11±0.5pN/nm respectively in relaxing state. Young’s Modulus in Z-line, I-band, Overlap, and M-line are 115±12kPa, 48±9kPa, 52±8kPa, and 90±12kPa respectively in rigor, and 98±10kPa, 23±4kPa, 42±4kPa, and 65±7kPa respectively in relaxing state. The elasticity curves has shown a similar appearance to the section analysis profile of AFM height images of sarcomere and the distance between adjacent largest coefficient and Young’s Modulus is equal to the sarcomere length measured from the AFM height images using section analysis, indicating that mechanic properties of fibers have a similar periodicity to the topography of fibers.
Keywords: Atomic force microscopy, Cardiac muscle fibers, Sarcomere, Topography, Compression elasticity
1. Introduction
Cardiac muscle fibers consist of bundles of myofibrils in which runs a series of sarcomeres where the contractile forces are produced by cyclic interactions between actin (thin filament) and myosin (thick filament) in overlap, and then transmitted to extracellular matrix and adjacent fibres and to the heart wall to squeeze out the blood filled in the heart cavity through a series of sarcomeres (Huxley, 1969; Miller and Tregear, 1970; Irving et al., 1992; Squire, 1997; Farman et al., 2007). As a basic contractile unit of cardiac myofibers, the sarcomere has components of force and elasticity in longitudinally and perpendicular with respect to the fibers axis (Brady, 1991; Millman, 1998). Since the elastic properties influence the response of fibers to applied forces, it is of importance to study the elastic behavior of fibers in response to forces in both directions. The longitudinal elasticity is widely studied by changing length of muscle fibers and analyzing the concerned force feedback. The perpendicular (radial) elasticity is usually measured by compressing a skinned muscle fiber with osmotic pressure, and then divided the osmotic pressure by the change of filament spacing and fiber width (Maughan et al., 1981).
However, we can not get local or microscopic properties with these techniques for collective and average study, so other techniques must be used to study the micromechanics (Janmey and McCulloch, 2007; Addae-Mensah and Wikswo, 2008; Zhu et al., 2008a; Zhu et al., 2009a). X-ray fiber diffraction is good at studying the changes of filament spacing but is still powerless to collect the force information directly (Irving, 1998; Irving et al., 2000; Konhilas et al., 2002; Fukuda et al., 2003; Squire et al., 2005; Farman et al., 2006). Atomic force microscopy (AFM) is a powerful method of detecting biological surface ultrastructure and micromechanics for its high resolution and excellent ability in nanomanipulation (Zhu et al., 2007; Pelled et al., 2007; Rico et al., 2007; Kuznetsova et al., 2007; Marchetti et al., 2008; Zhu et al., 2009b). Recently, an effective method based on the deflection of AFM cantilever produced by approaching its tip to sample surface, has been used to estimate the compression elasticity of various muscle fibers (Shroff et al., 1995; Yoshikawa et al., 1999; Nyland et al., 2000; Jason et al., 2001; Mathur et al., 2001; Defranchi et al., 2005; Akiyama et al., 2006; Zhu et al., 2008b; Feng et al., 2008; Kreplak et al., 2009). In this study, we examined the surface topography and compression elasticity of skinned muscle fibers in rigor and relaxing state from adult bovine left ventricle with tapping mode atomic force microscopy and nanoindentation.
2. Methods
2.1 Preparation of cardiac muscle fibers
Cardiac muscle fibers were isolated from adult bovine left ventricle which freshly obtained at a nearby slaughterhouse at 4 °C (Dow et al., 1981). Briefly, the heart tissue was rapidly excised and perfused with in relaxing solution (pH6.8) containing 5mM Na2ATP, 5mM MgCl2, 5mM NaN3, 5mM ethyleneglycol-bis-(b-aminoethyl ether)-n,n,n′,n′-tetraacetic acid (EGTA) and 20mM 3-[n-morpholino] propanesulfonic acid (MOPS), with 1% (w/v) Triton X-100 for 8h. The skinned fibers were washed with rigor solution (pH6.8) containing 5mM MgCl2, 5mM NaN3, 5mM EGTA and 20mM MOPS, and stored in rigor solution with 50 % (v/v) glycerol at −20°C. Before use, fibers were washed and perfused with detergent-free relaxing solution and glycerol-free rigor solution for two different experiments. Fiber solutions (rigor or relaxing) were dropped onto fresh cleaved mica sheet and absorbed the solution with filter paper from one side carefully until washed with the concerned solution for three times. The preparations were used for AFM analysis in 3~5h. Ionic strength of all solution was 105 mM; pH, 6.8; temperature, 19±1°C.
2.2 Topographic mapping
Topographies of the muscle fibers in the air were made from WET-SPM-9500J3 (Shimadzu Co., Kyoto, Japan) in conjunction with a Scanner II (with a maxim size to 55μm) which is an environment (air, temperature, humidity) controlled AFM. The samples were fixed onto the AFM metal disc with double sides tape. Commercially available tapping mode cantilevers were used for mapping: ~125μm long; spring constant, 42 N/m; resonance frequency, 330 KHz; oxide-sharpened silicon nitride tips, radius of curvature, <10 nm (PPP-NCHR, Nanosensor™, Neuchatel, Switzerland). Tips were positioned above the aimed muscle fibers with the aid of a 30 magnification CCD video and an x-y stage positioner (sample can not move in this AFM). Scanning force, integral and proportional gains were balanced whenever necessary and scanner was operated around 0.5Hz in Y direction with 512pixels so that optimal height, amplitude and phase images can be collected simultaneously. All experiments were carried out in the air with 55% relative humidity at room temperature (19±1°C). AFM off-line software (SPM Manager Version 3.20, Shimadzu Co. Japan) was used to analyze the surface profile of height images including analysis of roughness, and section analysis. All images were used for analysis after a second order Flatten, local filtering, and noisy line erasing.
2.3 Compression Elasticity
Based on the force-distance curves between the tip and the sample surface, compression elasticity coefficient and Young’s modulus were measured (calculated) using a hardened contact mode cantilevers (~450μm long; spring constant, 0.2 N/m; diamond-coated tips, radius of curvature, ~100 nm; DT-CONTR, Nanosensor™, Neuchatel, Switzerland). When the cantilever was lowered enough, it would start to touch and compress the sample and be deflected upward gradually(Zhu et al., 2007). The compression force (Fc) applied to the sample can be calculated from the deflection of cantilever (Dc) and its spring constant (Kc), and the deformation of the sample is equal to the piezoelectric extension (Lp) from the sample surface minus the deflection of cantilever (Dc)(Nyland et al., 2000; Zhu et al., 2008a). So, compression elasticity coefficient Ks of the sample was determined using the compression force Fc divided by the compression deformation Ds of the sample which was given by
| (1) |
Compression Young’s modulus (Ec) was calculated using the Hertz formulas(Hertz, 1881; Yoshikawa et al., 1999) generally to be better for us to understand the structural stabilities of muscle fiber at molecular level which was given by
| (2) |
In which, μ is the Poisson’s ratio and R is the radius of cantilever tip, and others were defined as above. Parameters used were μ=0.5 (Roark, 1965) by assuming the isometric changes in muscle fibers, and R ≈ 100nm, Kc=0.2N/m (given by manufacturer). Then, the Hertz formulas can be simplified as
| (3) |
Before the compression elasticity measurement, sample was scanned in contact mode by the tip firstly, and then zoomed in an interested place and then put the scan size to zero. The force-distance curves were taken at 1 Hz in Force Modulation with a maximum compression force of ~10nN.
3. Results
3.1 Sarcomere periodicity and roughness analysis
Two dimensional height images of bovine cardiac muscle fibers surface in rigor and relaxing states with a section analysis of sarcomere surface had been done with tapping mode AFM. Characteristic sarcomere patterns running along the longitudinal axis of the fibers can be seen in all cases including AFM images and the inset images from inverted optical microscope, see Fig. 1~2.
Fig. 1.
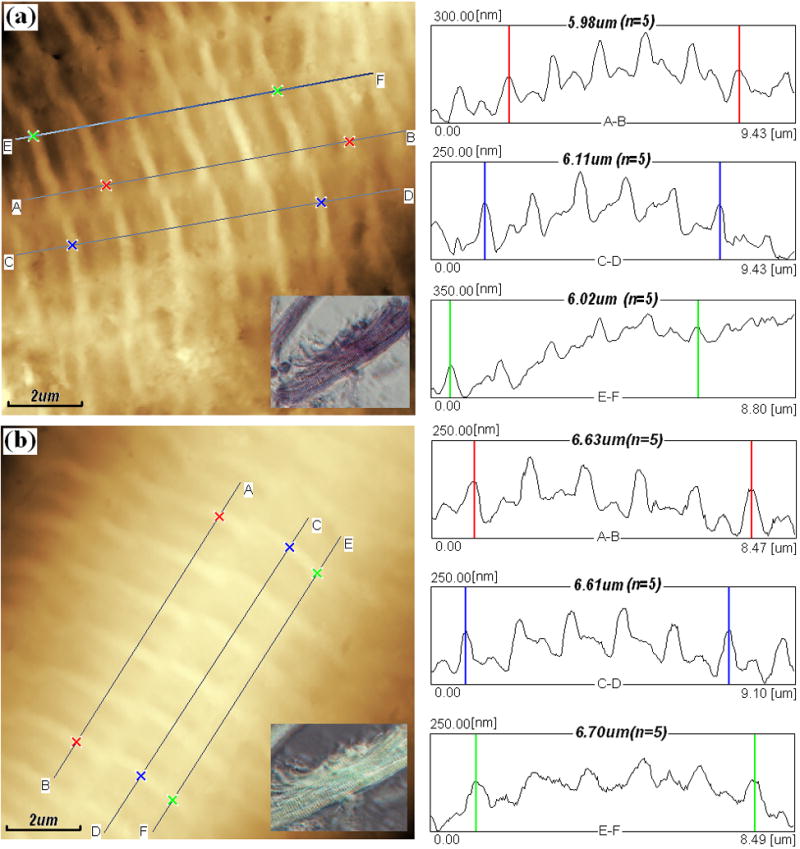
AFM topography images (left) and section analysis surface profiles (right) of bovine cardiac muscle fiber buddle in rigor (a) and in relaxing state (b). Both topography (height) images in 512×512 pixels were recorded in tapping mode AFM in the air at room temperature at 0.5Hz. Both images were used for analysis after a second order Flatten, local filtering, and noisy line erasing. Inset: Inverted optical microscopy of cardiac muscle fiber buddle in rigor (a) and in relaxing state (b).
Fig. 2.
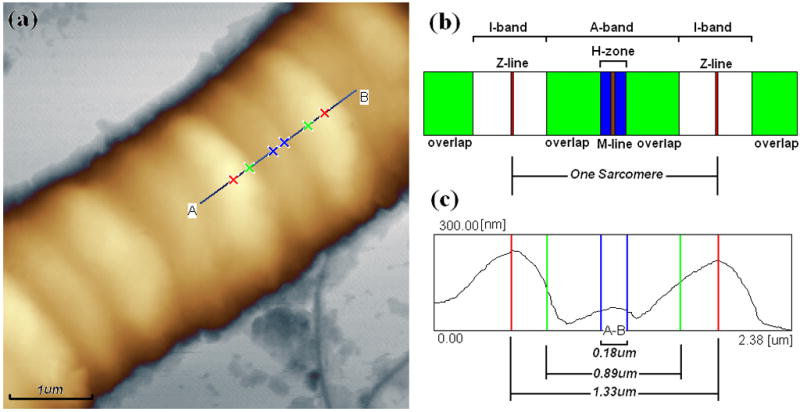
Ultrastructure of single muscle fiber. (a) AFM topography (height) image of bovine cardiac muscle fibers in relaxing state with the section analysis line AB and markers draw on it, image was used for analysis after a second order Flatten, local filtering, and noisy line erasing.; (b) Illustration of ultrastructure in one sarcomere including I-band, A-band, H-zone, Z-line, and M-line, which derived from TEM image of muscle fiber section; (c) Section analysis profile of cardiac muscle fiber in one sarcomere from the line AB draw on (a). The length ratio of I-band and A-band is about 1:2, and H-zone is about 0.18μm long. Image in 512×512 pixels was taken in tapping mode AFM in the air at room temperature at 1Hz.
Shorter I-bands (actin regions) with the protruding Z-lines in the center are clearly distinguished from the longer A-bands (actin and myosin overlap and H-zones) with the protruding M-lines in the middle, as shown in Fig. 2. The single sarcomere length i.e. the distance between adjacent Z-lines were 1.22±0.02μm (n=5) in rigor and 1.33±0.03μm (n=5) in relaxing (about 9% larger than that in rigor) respectively shown in Fig. 1a and Fig. 1b. And the length of I-band, A-band, overlap, and H-zone are 0.44±0.05, 0.89±0.12, 0.71±0.10, and 0.18±0.02μm (n=10)respectively in relaxing fiber as an example shown in Fig. 2, although it’s not easy to determine the exact border of different parts for the distortion of fiber caused by AFM tips. We can use the full width at half maximum to measure off. The sarcomere length is approximate to the value in mice (about 1.49μm) from reference (Defranchi et al., 2005) and closed to the data of swine ventricular myocytes (1.6~2μm) from reference (Jason et al., 2001). But the later one was lack of real section analysis and measurement. From height images of Fig. 1a~b, it can be seen that Z-lines (I-bands) are not continues in latitude and exist obvious (uniform) dislocation in longitudinal direction, it maybe the interface between different myofibrils.
Based on the roughness analysis, it can be calculated that I-lines are higher than the adjacent M-lines about 65±5nm (n=25) in rigor and 57±4.2nm (n=25) in relaxing (about 11% decrease), and the roughness (root mean square) of whole topography are 88nm in rigor and 76nm in relaxing (about 13.6% decrease), as shown in Fig. 1a~b, which are close to the results from reference (Defranchi et al., 2005). These results infer that, surface of muscle fibers became smoother when the solution switched from rigor into relaxing ones.
3.2 Compression Elasticity Coefficient
Fig. 3 is a typical force-distance curve between cantilever deflection (compression force) and deformation of muscle fibers obtained at different sarcomere locations (Z-line, I-band, overlap, M-line) in rigor and relaxing states which was the difference between piezoelectric extension and cantilever deflection. And compression elasticity coefficient of muscle fibers can be calculated using data in Fig. 3 and formulas (1), as shown in Fig. 4 and Fig. 5.
Fig. 3.
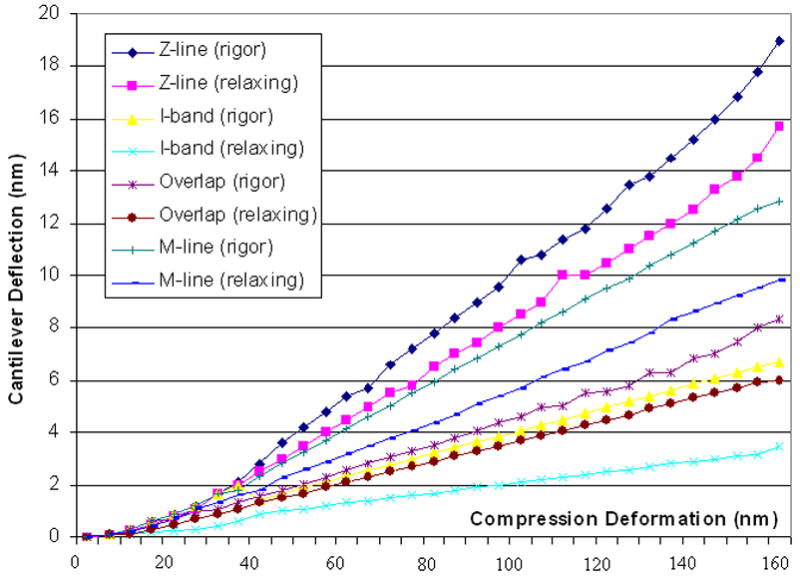
AFM typical force curves between cantilever deflection and compression deformation of muscle fibers obtained at different locations (Z-line, M-line, I-band, Overlap) on fiber sarcomere in rigor and relaxing states. Compression deformation was calculated with the difference between cantilever deflection and piezoelectric extension. The force curves were taken at 1 Hz in Force Modulation with a maximum compression force of ~10nN.
Fig. 4.
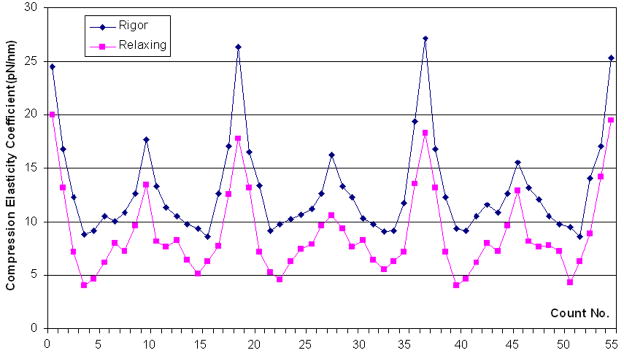
Distributions of compression elasticity coefficient along cardiac muscle fibers in rigor (upper curve, ◆) and relaxing state (lower curve, ▪) compared at same count (18 points/sarcomere). The curves in two different states showed a similar outline. The data was calculated using the results from ~100μm indentation.
Fig. 5.
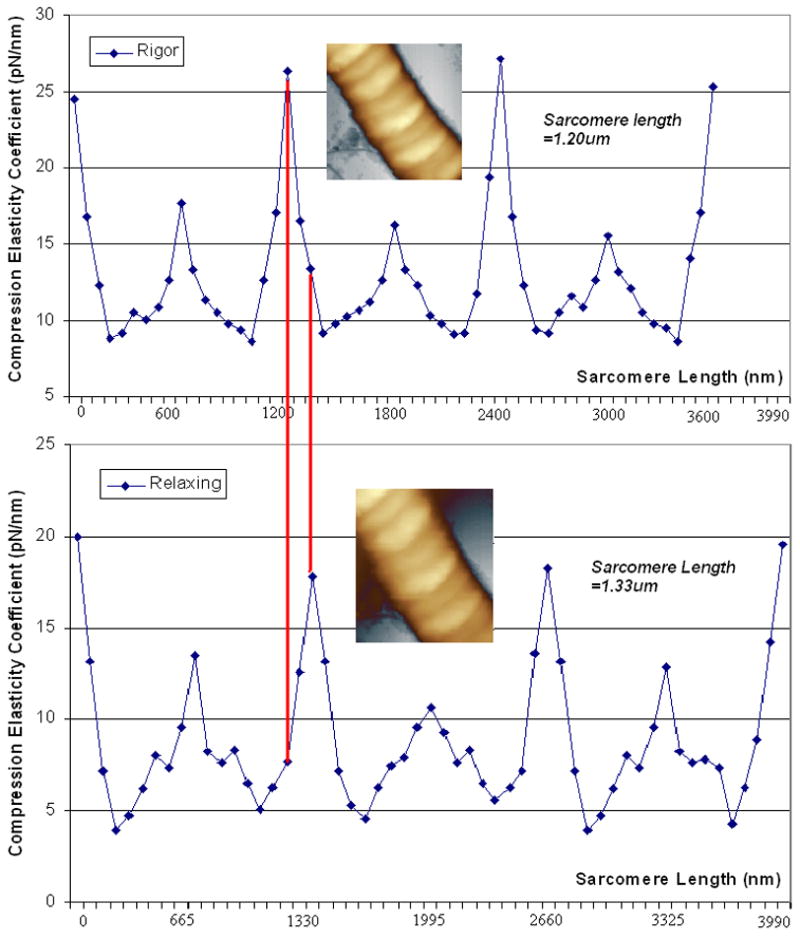
Distributions of compression elasticity coefficient along cardiac muscle fiber in rigor (upper curve) and relaxing state (lower curve) compared at same fiber length (4μm) in 55 counts. Sarcomere length in rigor and relaxing states were 1.20μm and 1.33μm respectively. Inset: AFM height images of muscle fibers in rigor (upper) and relaxing state (lower), image size, 5μm×5μm. The data was calculated using the results from ~100μm indentation.
It can be seen that, the linearity of these 8 curves are better in compression deformation interval [60nm, 140nm] and the slopes in [0, 50nm] are smaller than that in [60nm, 140nm]. Because the radius of curvature of the tip is around 100nm, there must be a smaller compression area at first touch and the fibers maybe easier to be broken or compressed and the force feedback maybe random. The results would become stable and uniform along with processing of compression deformation and increasing of touch area between AFM tip and fibers. It shown that the slope of different force-distance curves are in the order of Z-line(rigor)>Z-line(relaxing) >M-line(rigor) >M-line(relaxing) >Overlap(rigor) >I-band(rigor) >Overlap(relaxing) >I-band(relaxing) in the same sarcomere. There is a little difference to the result of reference (Yoshikawa et al., 1999), in which, the order is Z-line>Overlap>M-line>I-band in rigor state, however, this group had reported a different result in reference (Akiyama et al., 2006), in which, coefficient are at the same order in rigor as ours, but it is still different in relaxing state. And coefficient of Z-line, I-band, Overlap, and M-line are 25±2pN/nm, 8±1pN/nm, 10±1pN/nm, and 17±1.5pN/nm respectively in rigor state, and 18±2.5pN/nm, 4±0.5pN/nm, 6±1pN/nm, and 11±0.5pN/nm respectively in relaxing state. There is a similar appearance of our curve in rigor to the plot (see fig. 2), and Z-line coefficient in rigor is very close to their result (~25.8pN/nm, fig. 3) (Yoshikawa et al., 1999). The coefficient value in relaxing is smaller than that in rigor at same location. It also can be seen from the curves in Fig. 4, coefficient curve in rigor was higher than that in relaxing, which inferred that muscle fibers are much softer in relaxing rather than in rigor state.
Fig. 5 demonstrated the coefficient distribution in longitudinal direction of fibers in same sarcomere length. Distance between two red parallel line stands for the length difference of the first sarcomere in different states; it’s about 134nm which equal the result from topography section analysis. And the coefficient curves have similar appearance of topology map; see right parts of Fig. 1a~b.
3.3 Compression Young’s Modulus
Fig. 6 shows the compression Young’s Modulus of different sarcomere locations in 5 different compression deformation (60~140nm) in rigor and relaxing states. And blue-line and red-line stand for the average Young’s Modulus of sarcomere in rigor and relaxing respectively. The Young’s Modulus in Z-line, I-band, Overlap, and M-line are 115±12kPa, 48±9kPa, 52±8kPa, and 90±12kPa respectively in rigor, and 98±10kPa, 23±4kPa, 42±4kPa, and 65±7kPa respectively in relaxing state. The profile of rigor curve is similar to the coefficient curve in rigor (Akiyama et al., 2006). The value at M-line in relaxing is close to the data (~61kPa) in left ventricle muscles of neonatal rat from reference (Yoshikawa et al., 1999) and the value in young and old cardiac myocytes (35.1~42.5kPa) from Fig. 4 in reference (Lieber et al., 2004). The value at Z-line and M-line in rigor is close to the data in Drosophila myofibrils (93.3±41kPa) from table 1 in reference (Nyland et al., 2000) and is comparable to that reported in rabbit psoas myofibrils (84±18.1kPa) from reference (Yoshikawa et al., 1999). The results from I-bands are obviously bigger than that form reference (Yoshikawa et al., 1999). Young’s Modulus difference in Z-line, M-line, Overlap, and I-band between two states are 17kPa (17.3%), 15KPa (16.6%), 10 kPa (19.2%), and 25 kPa (52.1%) respectively, which demonstrates that mechanical properties of I-band is different to other parts. And Young’s Modulus difference between I-band and overlap in rigor (~8%) is smaller than that in relaxing (~42%), which demonstrates that Young’s Modulus in rigor is more stable and homogeneous than that in relaxing, indicating that I-band changed much more in structure may combine with the overlap of actin and myosin, and the overlap in rigor had gotten to the maximum and it’s not exact about the area of I-band using the distribution of Young’s Modulus between Z-line and M-line. And all of the transverse Young’s Modulus of sarcomere from different parts in different states were 1/5~1/10 of the longitudinal elastic modulus (450±50 kPa) from Fig. 4 in reference (Dickinson et al., 1997) and Fig. 4.8 in reference (Farman, 2004), which reflects crossbridges formed during stretch-activation. And the transverse value was about 10~20 times of the longitudinal shear stiffness (4.75±0.2 kPa, n=15) from Wistar rat cardiomyocytes (Nishimura et al., 2006), which reflects the frictional properties of the fibers (Coles et al., 2008).
Fig. 6.
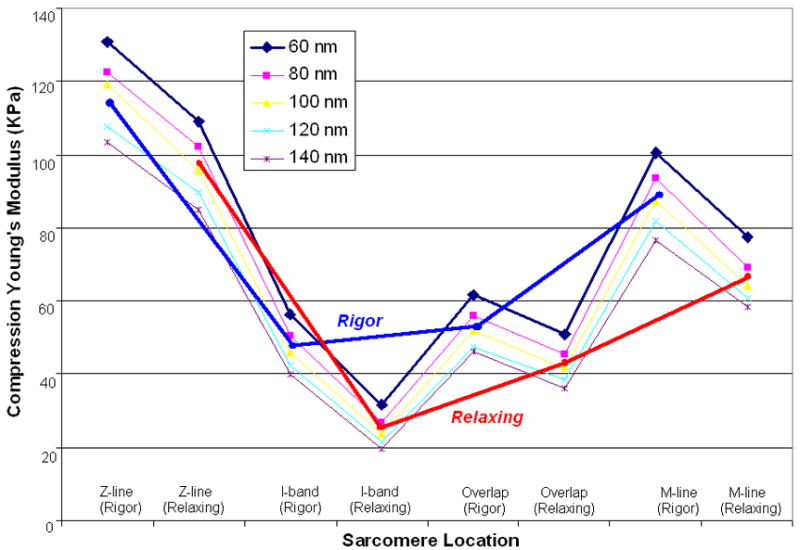
Compression Young’s Modulus of cardiac muscle fibers at different sarcomere locations in rigor (blue line) and relaxing (red line) calculated from 5 different indentation depths. Young’s Modulus of muscle fibers in rigor was bigger than that from relaxing ones. In details, they are in the order of Z-line>M-line >Overlap>I-band in the same sarcomere.
4. Discussion
In summary, surface topography and compression elasticity of bovine cardiac muscle fibers have been investigated in rigor and relaxing states. Topography of fibers have shown a sarcomere length of 1.22~1.33μm with a significant 9% increase in relaxing state, indicating that actin and myosin overlapped each other along with the changed physiological conditions. Combined with the results from TEM and X-ray fiber diffraction, ultrastructures of sarcomere have been illustrated with height images and section analysis. Compression elasticity curves along with sarcomere locations have shown a similar appearance to the section analysis profile of AFM height images of sarcomere. Distance between adjacent largest coefficient and Young’s Modulus on fiber is equal to the sarcomere length measured with section analysis profiles, which indicates that mechanic properties of fibers have a similar spatial distribution (periodicity) on sarcomere as the topography. These results inferred that compression elasticity of muscle fibers substantially depends upon physiological sates of muscle as well as upon locations on sarcomeres.
The structural and elasticity parameters from AFM may promote the awareness of relation among bioarchitecture, biomechanics and physiological functions of skinned muscle fibers in physiological processes, and supply extra information for basic and clinic research on cardiac muscle (Herrmann et al., 2007; Choi et al., 2007; Bacabac et al., 2008; Garcia et al., 2009). Further studies would be focused on the role of calcium and pH value in triggering structural damage of cardiac muscle in skinned and native states (Sato et al., 2007; Sotomayor and Schulten, 2008). So, the interfacial sarcommela and extracellular matrix such as collagen (Elliott et al., 2007; McDaniel et al., 2007; Ng et al., 2007; Engler et al., 2008; Gavara et al., 2008; Chaudhry et al., 2009) would be studied firstly with fluid AFM in order to clarify the relation between cardiac dysfunctions and abnormal changes of physiological condition in real time.
However, there are still several limitations about the AFM studies on topography and compression elasticity of muscle fibers. Firstly, muscle fibers could not be ideally considered as linear elastomer or completely passive body. The cross-bridges (actin and myosin) cycling in the overlap zone are not so stable in elasticity which depends on sarcomere locations, physiological conditions and sources of muscle fibers. Secondly, compression of nano-scale AFM tips onto micro-scale fibers is not an ideal linear process essentially (Yang et al., 2008; Feng et al., 2008). So, the indentation of sharp tips would affect the mechanical properties of the fibers obviously in the initial stages, and the geometry of tips would also influence the measurement of elasticity. Thirdly, AFM force measurements always take a long period of time (≥5hours). In this process, changes in sample structure and tip environment would affect the measurement of compression elasticity in vitro. In sum, development of theory on micromechanics around tips, improvement of AFM in higher resolution, and stabilization of measurement environment should be discussed in the further studies, which will make this method much more valuable (Wu et al., 2008; Zhu et al., 2009b).
Acknowledgments
The authors would like to thank Prof. Irving and Prof. Orgel at IIT and Prof. Sun at SNU for their generous and helpful discussions and to Taeyoung Kim and Jenny Lee for their assistants on instrumental setup and data analysis. This project is mainly supported by Talent Foundation of Northwest A&F University (No.01140501), Foundation of China Scholarship Council (No.2007103068), and partly supported by National Institute of Health Grant (No.RR-08630) and American Heart Association Grant (No.0435339Z).
Footnotes
Conflict of interest
The authors have declared that no conflict of interest exists. The authors have affirmed that they have no financial affiliation or involvement with any commercial organization that has direct financial interest in any matter included in this manuscript.
References
- Addae-Mensah KA, Wikswo JP. Measurement techniques for cellular biomechanics in vitro. Exp Biol Med. 2008;233:792–809. doi: 10.3181/0710-MR-278. [DOI] [PMC free article] [PubMed] [Google Scholar]
- Akiyama N, Ohnuki Y, Kunioka Y, Saeki Y, Yamada T. Transverse stiffness of myofibrils of skeletal and cardiac muscles studied by atomic force microscopy. J Physiol Sci. 2006;56:145–151. doi: 10.2170/physiolsci.RP003205. [DOI] [PubMed] [Google Scholar]
- Bacabac RG, Mizuno D, Schmidt CF, Mackintosh FC, Van Loon JJWA, Klein-Nulend J, Smit TH. Round versus flat: Bone cell morphology, elasticity, and mechanosensing. J Biomech. 2008;41:1590–1598. doi: 10.1016/j.jbiomech.2008.01.031. [DOI] [PubMed] [Google Scholar]
- Brady AJ. Length dependence of passive stiffness in single cardiac myocytes. Am J Physiol Heart Circ Physiol. 1991;260:1062–1071. doi: 10.1152/ajpheart.1991.260.4.H1062. [DOI] [PubMed] [Google Scholar]
- Chaudhry B, Ashton H, Muhamed A, Yost M, Bull S, Frankel D. Nanoscale viscoelastic properties of an aligned collagen scaffold. J Mater Sci: Mater Med. 2009;20:257–263. doi: 10.1007/s10856-008-3574-3. [DOI] [PubMed] [Google Scholar]
- Choi JB, Youn I, Cao L, Leddy HA, Gilchrist CL, Setton LA, Guilak F. Zonal changes in the three-dimensional morphology of the chondron under compression: The relationship among cellular, pericellular, and extracellular deformation in articular cartilage. J Biomech. 2007;40:2596–2603. doi: 10.1016/j.jbiomech.2007.01.009. [DOI] [PMC free article] [PubMed] [Google Scholar]
- Coles JM, Blum JJ, Jay GD, Darling EM, Guilak F, Zauscher S. In situ friction measurement on murine cartilage by atomic force microscopy. J Biomech. 2008;41:541–548. doi: 10.1016/j.jbiomech.2007.10.013. [DOI] [PMC free article] [PubMed] [Google Scholar]
- Davis JJ, Allen H, Hill O, Powell T. High resolution scanning force microscopy of cardiac myocytes. Cell Biol Int. 2001;25:1271–1277. doi: 10.1006/cbir.2001.0813. [DOI] [PubMed] [Google Scholar]
- Defranchi E, Bonaccurso E, Tedesco M, Canto M, Pavan E, Raiteri R, Reggiani C. Imaging and elasticity measurements of the sarcolemma of fully differentiated skeletal muscle fibres. Microsc Res Tech. 2005;67:27–35. doi: 10.1002/jemt.20177. [DOI] [PubMed] [Google Scholar]
- Dickinson MH, Hyatt CJ, Lehmann FO, Moore JR, Reedy MC, Simcox A, Tohtong R, Vigoreaux JO, Yamashita H, Maughan DW. Phosphorylation-dependent power output of transgenic flies: an integrated study. Biophys J. 1997;73:3122–3134. doi: 10.1016/S0006-3495(97)78338-3. [DOI] [PMC free article] [PubMed] [Google Scholar]
- Dow JW, Harding NG, Powell T. Isolated cardiac muscle fibers-I Preparation of adult cardiac muscle fibers and their homology with intact tissue. Cardiovasc Res. 1981;15:483–514. doi: 10.1093/cvr/15.9.483. [DOI] [PubMed] [Google Scholar]
- Elliott JT, Woodward JT, Umarji A, Mei Y, Tona A. The effect of surface chemistry on the formation of thin films of native fibrillar collagen. Biomaterials. 2007;28:576–585. doi: 10.1016/j.biomaterials.2006.09.023. [DOI] [PubMed] [Google Scholar]
- Engler AJ, Carag-Krieger C, Johnson CP, Raab M, Tang HY, Speicher DW, Sanger JW, Sanger JM, Discher DE. Embryonic cardiomyocytes beat best on a matrix with heart-like elasticity: scar-like rigidity inhibits beating. J Cell Sci. 2008;121:3794–3802. doi: 10.1242/jcs.029678. [DOI] [PMC free article] [PubMed] [Google Scholar]
- Farman GP. PhD thesis. Illinois Institute of Technology Press; Chicago: 2004. Structural basis of calcium sensitivity in striated muscle. [Google Scholar]
- Farman GP, Walker JS, De Tombe PP, Irving TC. Impact of osmotic compression on sarcomere structure and myofilament calcium sensitivity of isolated rat myocardium. Am J Physiol Heart Circ Physiol. 2006;291:1847–1855. doi: 10.1152/ajpheart.01237.2005. [DOI] [PubMed] [Google Scholar]
- Farman GP, Allen EJ, Gore D, Irving TC, De Tombe PP. Interfilament spacing is preserved during sarcomere length isometric contractions in rat cardiac trabeculae. Biophys J. 2007;92:L73–L75. doi: 10.1529/biophysj.107.104257. [DOI] [PMC free article] [PubMed] [Google Scholar]
- Feng SC, Vorburger TV, Joung CB, Dixson RG, Fu J, Ma L. Computational models of a nano probe tip for static behaviors. Scanning. 2008;30:47–55. doi: 10.1002/sca.20079. [DOI] [PubMed] [Google Scholar]
- Fukuda N, Wu YM, Farman G, Irving TC, Granzier H. Titin isoform variance and length dependence of activation in skinned bovine cardiac muscle. J Physiol-London. 2003;553:147–154. doi: 10.1113/jphysiol.2003.049759. [DOI] [PMC free article] [PubMed] [Google Scholar]
- Garcia TI, Oberhauser AF, Braun W. Mechanical stability and differentially conserved physical-chemical properties of titin Ig-domains. Protein: Struc Func Bioinf. 2009;75:706–718. doi: 10.1002/prot.22281. [DOI] [PMC free article] [PubMed] [Google Scholar]
- Gavara N, Roca-Cusachs P, Sunyer R, Farre R, Navajas D. Mapping cell-matrix stresses during stretch reveals inelastic reorganization of the cytoskeleton. Biophys J. 2008;95:464–471. doi: 10.1529/biophysj.107.124180. [DOI] [PMC free article] [PubMed] [Google Scholar]
- Herrmann H, Bar H, Kreplak L, Strelkov SV, Aebi U. Intermediate filaments: from cell architecture to nanomechanics. Nat Rev Mol Cell Biol. 2007;8:562–573. doi: 10.1038/nrm2197. [DOI] [PubMed] [Google Scholar]
- Hertz H. Uber den Kontakt elastischer Korper. J Reine Angew Math. 1881;92:156–171. [Google Scholar]
- Huxley HE. The mechanism of muscular contraction. Science. 1969;164:1356–1366. [PubMed] [Google Scholar]
- Irving M, Lombardi V, Piazzesi G, Ferenczi MA. Myosin head movements are synchronous with the elementary force-generating process in muscle. Nature. 1992;357:156–158. doi: 10.1038/357156a0. [DOI] [PubMed] [Google Scholar]
- Irving TC. Bright prospects for biological non-crystalline diffraction. Nat Struct Biol. 1998;5:648–650. doi: 10.1038/1340. [DOI] [PubMed] [Google Scholar]
- Irving TC, Konhilas JP, Perry D, Fischetti R, De Tombe PP. Myofilament lattice spacing as a function of sarcomere length in isolated rat myocardium. Am J Physiol Heart Circ Physiol. 2000;279:2568–2573. doi: 10.1152/ajpheart.2000.279.5.H2568. [DOI] [PubMed] [Google Scholar]
- Janmey PA, McCulloch CA. Cell mechanics: Integrating cell responses to mechanical stimuli. Annu Rev Biomed Eng. 2007;9:1–34. doi: 10.1146/annurev.bioeng.9.060906.151927. [DOI] [PubMed] [Google Scholar]
- Konhilas JP, Irving TC, De Tombe PP. Myofilament calcium sensitivity in skinned rat cardiac trabeculae: Role of interfilament spacing. Circulation Res. 2002;90:59–65. doi: 10.1161/hh0102.102269. [DOI] [PubMed] [Google Scholar]
- Kreplak L, Nyland LR, Contompasis JL, Vigoreaux JO. Nanomechanics of Native Thick Filaments from Indirect Flight Muscles. J Mol Biol. 2009;386:1403–1410. doi: 10.1016/j.jmb.2008.12.051. [DOI] [PubMed] [Google Scholar]
- Kuznetsova TG, Starodubtseva MN, Yegorenkov NI, Chizhik SA, Zhdanov RI. Atomic force microscopy probing of cell elasticity. Micron. 2007;38:824–833. doi: 10.1016/j.micron.2007.06.011. [DOI] [PubMed] [Google Scholar]
- Lieber SC, Aubry N, Pain J, Diaz G, Kim SJ, Vatner SF. Aging increases stiffness of cardiac myocytes measured by atomic force microscopy nanoindentation. Am J Physiol Heart Circ Physiol. 2004;287:645–651. doi: 10.1152/ajpheart.00564.2003. [DOI] [PubMed] [Google Scholar]
- Marchetti S, Sbrana F, Raccis R, Lanzi L, Gambi CMC, Vassalli M, Tiribilli B, Pacini A, Toscano A. Dynamic light scattering and atomic force microscopy imaging on fragments of beta-connectin from human cardiac muscle. Phys Rev E. 2008;77:021910. doi: 10.1103/PhysRevE.77.021910. [DOI] [PubMed] [Google Scholar]
- Mathur AB, Collinsworth AM, Reichert WM, Kraus WE, Truskey GA. Endothelial, cardiac muscle and skeletal muscle exhibit different viscous and elastic properties as determined by atomic force microscopy. J Biomech. 2001;34:1545–1553. doi: 10.1016/s0021-9290(01)00149-x. [DOI] [PubMed] [Google Scholar]
- Maughan DW, Godt R. Radial forces within muscle fibers in rigor. J Gen Physiol. 1981;77:49–64. doi: 10.1085/jgp.77.1.49. [DOI] [PMC free article] [PubMed] [Google Scholar]
- McDaniel DP, Shaw GA, Elliott JT, Bhadriraju K, Meuse C, Chung KH, Plant AL. The stiffness of collagen fibrils influences vascular smooth muscle cell phenotype. Biophys J. 2007;92:1759–1769. doi: 10.1529/biophysj.106.089003. [DOI] [PMC free article] [PubMed] [Google Scholar]
- Miller A, Tregear RT. Evidence concerning crossbridge attachment during muscle contraction. Nature. 1970;226:1060–1061. doi: 10.1038/2261060a0. [DOI] [PubMed] [Google Scholar]
- Millman BM. The filament lattice of striated muscle. Physiol Rev. 1998;78:359–391. doi: 10.1152/physrev.1998.78.2.359. [DOI] [PubMed] [Google Scholar]
- Ng L, Hung HH, Sprunt A, Chubinskaya S, Ortiz C, Grodzinsky A. Nanomechanical properties of individual chondrocytes and their developing growth factor-stimulated pericellular matrix. J Biomech. 2007;40:1011–1023. doi: 10.1016/j.jbiomech.2006.04.004. [DOI] [PubMed] [Google Scholar]
- Nishimura S, Nagai S, Katoh M, Yamashita H, Saeki Y, Okada J, Hisada T, Nagai R, Sugiura S. Microtubules modulate the stiffness of cardiomyocytes against shear stress. Circulation Res. 2006;98:81–87. doi: 10.1161/01.RES.0000197785.51819.e8. [DOI] [PubMed] [Google Scholar]
- Nyland LR, Maughan DW. Morphology and transverse stiffness of drosophila myofibrils measured by atomic force microscopy. Biophys J. 2000;78:1490–1497. doi: 10.1016/S0006-3495(00)76702-6. [DOI] [PMC free article] [PubMed] [Google Scholar]
- Pelled G, Tai K, Sheyn D, Zilberman Y, Kumbar S, Nair LS, Laurencin CT, Gazit D, Ortiz C. Structural and nanoindentation studies of stem cell-based tissue-engineered bone. J Biomech. 2007;40:399–411. doi: 10.1016/j.jbiomech.2005.12.012. [DOI] [PubMed] [Google Scholar]
- Rico F, Roca-Cusachs P, Sunyer R, Farre R, Navajas D. Cell dynamic adhesion and elastic properties probed with cylindrical atomic force microscopy cantilever tips. J Mol Recognit. 2007;20:459–466. doi: 10.1002/jmr.829. [DOI] [PubMed] [Google Scholar]
- Roark RJ. In: Formulas for stress and strain. Roak RJ, editor. McGraw-Hill Publisher; New York: 1965. pp. 1–120. [Google Scholar]
- Sato K, Adachi T, Ueda D, Hojo M, Tomita Y. Measurement of local strain on cell membrane at initiation point of calcium signaling response to applied mechanical stimulus in osteoblastic cells. J Biomech. 2007;40:1246–1255. doi: 10.1016/j.jbiomech.2006.05.028. [DOI] [PubMed] [Google Scholar]
- Shroff S, Saner DR, Lal R. Dynamic micromechanical properties of cultured rat atrial myocytes measured by atomic force microscopy. Am J Physiol. 1995;269:c286–c292. doi: 10.1152/ajpcell.1995.269.1.C286. [DOI] [PubMed] [Google Scholar]
- Sotomayor M, Schulten K. The allosteric role of the Ca2+ switch in adhesion and elasticity of C-cadherin. Biophys J. 2008;94:4621–4633. doi: 10.1529/biophysj.107.125591. [DOI] [PMC free article] [PubMed] [Google Scholar]
- Squire JM. Architecture and function in the muscle sarcomere. Curr Opin Struct Biol. 1997;7:247–257. doi: 10.1016/s0959-440x(97)80033-4. [DOI] [PubMed] [Google Scholar]
- Squire JM, Knupp C, Roessle M, Al-Khayat HA, Irving TC, Eakins F, Mok NS, Harford JJ, Reedy MK. X-ray diffraction studies of striated muscles. Sliding Filament Mechanism in Muscle Contraction. 2005;565:45–60. doi: 10.1007/0-387-24990-7_5. [DOI] [PubMed] [Google Scholar]
- Wu YZ, Hu Y, Cai J, Ma SY, Wang XP, Chen Y. The analysis of morphological distortion during AFM study of cells. Scanning. 2008;30:426–432. doi: 10.1002/sca.20121. [DOI] [PubMed] [Google Scholar]
- Yang FZ, Wornyo E, Gall K, King WP. Thermomechanical formation and recovery of nanoindents in a shape memory polymer studied using a heated tip. Scanning. 2008;30:197–202. doi: 10.1002/sca.20074. [DOI] [PubMed] [Google Scholar]
- Yoshikawa Y, Yasuike T, Yagi A, Yamada T. Transverse elasticity of myofibrils of rabbit skeletal muscle studied by atomic force microscopy. Biochem Biophys Res Commun. 1999;256:13–19. doi: 10.1006/bbrc.1999.0279. [DOI] [PubMed] [Google Scholar]
- Zhu J, Guo LH, Zhang B, Hu J, Wang GD. Microscale biomechanics measurements with atomic force microscopy and the concerned techniques. Life Sci Instrum. 2007;5:3–9. [Google Scholar]
- Zhu J, Guo LH, Lan L, Wang GD, Guo L. Observing biophysical properties of swine myocardium and mitochondria with tapping mode scanning probe microscope. FASEB J. 2008a;22:S801–S801. [Google Scholar]
- Zhu J, Guo LH, Wang GD. Study on the original height and compression elasticity of the DNA strands with atomic force microscopy. Chin J Appl Mech. 2008b;25:172–177. [Google Scholar]
- Zhu J, Sabharwal T, Guo LH, Kalyanasundaram A. Morphology and Mechanical Properties of Cardiac Myofibers Investigated by Atomic Force Microscopy and Synchrotron X-ray Diffraction. J Mol Cell Cardiol. 2009a;46:S42–S42. [Google Scholar]
- Zhu J, Sabharwal T, Guo LH, Kalyanasundaram A, Wang GD. Gloss Phenomena and image analysis of atomic force microscopy in molecular and cell biology. Scanning. 2009b;31:49–58. doi: 10.1002/sca.20133. [DOI] [PMC free article] [PubMed] [Google Scholar]


