Summary
Proper sample preparation, scan setup, data collection and image analysis are key factors in successful atomic force microscopy which can avoid gloss phenomena effectively from unreasonable manipulations or instrumental defaults. Fresh cleaved mica and newly treated glass cover were checked firstly as the substrates for all of the sample preparation for atomic force microscopy. Then, crystals contamination from buffer were studied separately or combined with several biologic samples, and the influence of scanner, scan mode and cantilever to data collection were also discussed intensively using molecular and cellular samples. At last, images treatment and analysis with off-line software had been focused on standard and biologic samples, and artificial glosses were highly considered for their high probability in occurring.
Keywords: Atomic force microscopy, Gloss phenomena, Image analysis, Molecular and cell biology
Introduction
As a powerful method on surface ultrastructure for its high resolution and simple sample preparation (Giessibl 2003, Muller et al. 2008), atomic force microscopy (AFM) (Binnig et al. 1986) was applied to molecular and cell biology extensively (Shao et al. 1996, Muller et al. 2007, Zhu et al. 2007a, Parot et al. 2007, Chung et al. 2008, Chen 2008, Narukawa et al. 2008). However, attentions be still paid to key factors in successful AFM such as sample preparation, scan setup, data collection and image analysis in order to avoid gloss phenomena from unreasonable manipulations or instrumental defaults (Muller et al. 1997a, Brayshaw et al. 2003, Haaheim and Nafday 2008, Feng et al. 2008). Flat substrates and strong absorptions (or chemisorptions) could firstly guarantee samples are anchored tightly onto substrates without obvious change of surface structure; and crystals and pollutants from buffer solution should be taken care of in sample preparation when AFM runs in the air or in a saturated solution(Muller et al. 1997b, Domke et al. 2000, McAloney et al. 2001). Parameters setups are also very important to authentic and perfect images which can make AFM running in good states, so scanner type, scan mode, cantilever properties, and scan parameters should be considered carefully in data collection. AFM off-line multifunction software has provided lots of methods for image analysis, which can make image informative and easy to analysis (Venkataraman et al. 2006); however, these tools also can make artifacts in high probability. In this paper, typical glosses caused by sample preparation, scan setups and image treatment/analysis were summarized and discussed.
Materials and Methods
Images Collections
0.9% NaCl solution, 0.125M KCl solution, PBS-phosphate buffer solution (pH6.8), polysaccharides with PBS, mitochondria sap with 0.125M KCl, SW180 cell sap with PBS-Glutaral, SW180 cell sap with 0.25M Sucrose-0.005M Tris-0.001M EDTA, K562 cell sap with PBS-Glutaral, and other biological samples were deposited onto fresh cleaved mica or treated glass covers till become dry, and then were put onto NanoScope(R) III (Digital Instruments Inc., USA), PicoScan-3000 (Molecular Imaging Co., USA) or SPM-9500J3 (Shimadzu Co., Japan) with different scanners, scanning modes, scanning parameters and cantilevers. Scanning force, integral and proportional gains were balanced whenever necessary and piezoelectric scanner was operated at 0.5~5Hz in Y direction. All experiments were carried out in 55% relative humidity at 19±1°C. Height and deflection images were collected simultaneous in 512 or 256 pixels. AFM cantilevers were bought from or presented by NanoWorld AG (Nanosensors™, Switzerland), Veeco Instruments Inc. (USA), Olympus Co. (Japan), and NT-MDT Co. (Russia). SW180 and K562 cell were presented by Dr. Tang and Prof. Qi at SNU respectively, fibrous astrocyte were presented by Dr. Lan at Tangdu Hospital of Xi’an, and indicus flight muscle fibers were presented by Prof. Reedy at Duke University Medical Center.
Images Analysis
Height and deflection images were chosen to process and analysis using AFM off-line software i.e. NanoScope V5.30r3.sr3 (Digital Instruments Inc., USA), PicoScan V5.3.3 (Molecular Imaging Co., USA), or SPM Manager V3.20 (Shimadzu Co., Japan). All images were treated using second order flatten and noisy line erasing before analysis, some of them were processed by local filter (including average, maximum and minimum) if it is applicable. The local filter is shaped like meshes having a size of 3×3. For image data expressed in a 2D array, a new value Xij is obtained from the value xij at the point (i, j) of interest and values at other eight points existing in proximity of it. The average, maximum and minimum of the values at these nine points are obtained for the average, maximum and minimum filter separately. So, the local filter performs the spatial filtering of image data to enhance the data characteristic features. Topview (height) images were chosen to display in this paper. Section analysis (profile analysis), surface analysis (roughness analysis), and particle analysis were applied to interested images, which show the morphology and geometric distributions in details.
Results and Discussion
Buffer Solution Crystals
Mica and glass cover are the most widely applied substrates for AFM in molecular and cell biology, in which fresh cleaved mica has a clean and atomic flat surfaces (~0.12 nm) in a relative big area, and glass cover treated by nitrohydrochloric acid and ultrasonic DI water bath followed as Muller D.J. (Muller et al. 1997) has a clean and nanometer flat surfaces (~0.89 nm), as shown in supplemental fig. 1. Except of ultra-flat surface, fresh cleaved mica and treated glass cover have different charge distribution, in which mica has a negatively charged surface, and glass cover can be functionized to manipulate its absorptions, which does improve the structural stability of samples under scanning AFM tips.
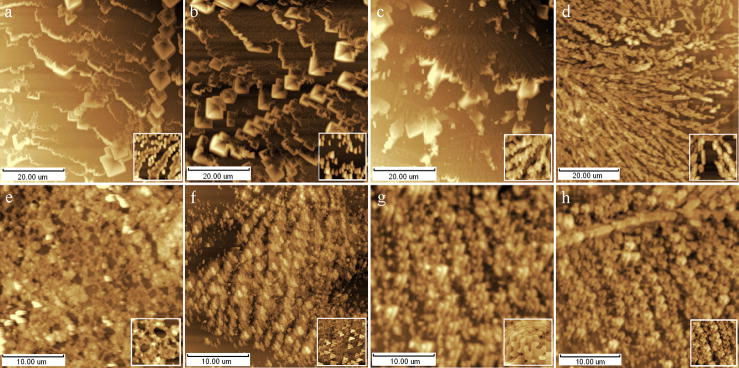
Buffer solutions are commonly used in molecular and cell biology which constructed as a physiological environment of cells and molecular in vitro. However, when the samples are applied to AFM in the air, the crystals separated from the buffer solution would contaminate the surface structure; sometimes these contaminated images are easy to be checked out, but they are not in most occasions. Crystal particles from 8 different solutions were studied by AFM in the air. Fig. 1a~c showed the typical brush-like crystals separated from 0.9% NaCl solution, 0.125M KCl solution, PBS-phosphate buffer solution (pH6.8) respectively, which can be easily made out as the contaminations to the cellular and molecular structure. Fig. 1d~h showed the AFM height images of separates from PBS+Polysaccharides, mitochondria sap with 0.125M KCl, SW180 cell sap with PBS-Glutaraldehyde, SW180 cell sap with 0.25M Sucrose-0.005 M Tris-0.001 M EDTA and K562 cell sap with PBS-Glutaraldehyde separately. It can be seen that the imaged complexes look like an aggregate of the uniform biology structures (as subunits) rather than the regular crystals, so it is not easy to distinguish what is real aggregate of biomaterials and what is the combination of salt crystal and biomaterials on the surface of cells and biomolecules assembles. The similar phenomena can be seen in saturated solutions for a long-period scanning. Generally, biological samples are probed by AFM in unsaturated solutions or washed with DI water carefully before check them in the air in order to avoid crystal contamination. Sample fixation and stability on substrates in solution are the principle challenges for AFM examination. We just discuss on the studies in the air in this paper for their extensive applications. Considered to the possible physiologic changes of biomaterials during water washing, it should be better to wash sample with water flow and carry out AFM as quickly as possible.
Fig. 1.
AFM height images of common buffers crystals on fresh cleaved mica or clean glass cover. (a) 0.9% NaCl solution, (b) 0.125M KCl solution, (c) PBS-phosphate buffer solution (pH6.8), (d) PBS+Polysaccharides, (e) KCl+mitochondria sap, (f) PBS+ Glutaraldehyde+SW180 cell sap, (g) PBS+Glutaraldehyde+K562 cell sap, (h) 0.25M Sucrose-0.005M Tris-0.001M EDTA+SW180 cell sap. Inset: local microstructure of concerned images in 1×1μm.
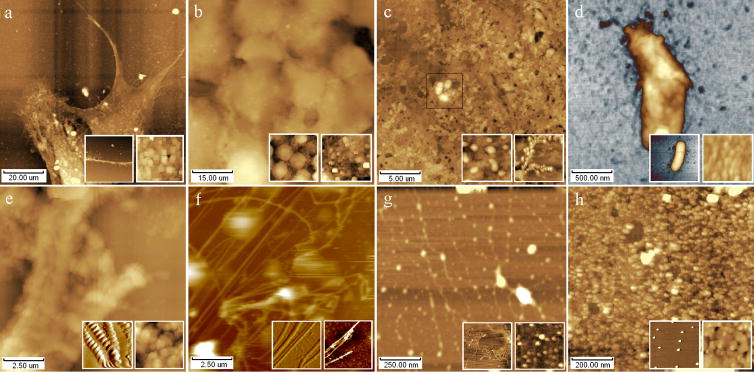
Fig. 2 showed AFM height images of 8 different biological samples contaminated by buffers crystals as the examples. Crystal contaminations can be seen from the main images and the right inset images which may partly contaminated by the limited organism form the air in the airtight chamber where AFM locates at. The left inset images are smoother and clearer, which are from the samples washed by water. Fig. 2a showed AFM height image of fibrous astrocyte in the air, from which structural details can not be checked out clearly for the crystals on the surface, see right inset of fig. 2a; however, synapse can be seen clearly from the washed sample, as shown in left inset of fig. 2a(Zhu et al. 2007b). Fig. 2b~d showed AFM images of K562 tumor cells, bovine cardiac mitochondria, and Escherichia Coli contaminated by buffer crystals respectively, from which obvious crystal contamination can be seen as in fig. 2a, but they became informative after washed using water. Fig. 2e showed Indicus flight muscle fibers in relaxing state contaminated by crystal from relaxing solution (20mM MOPS, 5mM NaN3, 5mM MgCl2, 5mM EGTA, 5mM Na2ATP, pH6.8), from which structural details of sarcomere were hardly determined directly, as shown in the right inset image(Zhu et al. 2008a); however, Z-lines, M-lines, I-bands can be seen clearly after washed by water, as shown in the left inset of fig. 2e which is better than that from references (Jason et al. 2001, Defranchi et al. 2005). The similar results can be collected in the examples of collagen (Lv et al. 2008), DNA (Vesenka et al. 1992, Lyubchenko et al. 1993, Revenko et al. 2000, Hansma et al. 2001, Kuznetsov et al. 2006, Ke et al. 2008, Zhu et al. 2008b), and F1-ATPase (Zhu et al. 2007c) as shown in fig. 2f~h respectively. Although the obscure crystal contaminations have been taken care of, those fraudulent contaminations cannot evoke enough suspicions from biologist and sometimes mislead the wrong conclusions. It should be better to check the AFM results with other techniques firstly.
Fig. 2.
AFM height images of various biological samples contaminated by buffers crystals on fresh cleaved mica or clean glass cover. (a) Fibrous astrocyte, (b) K562 tumor cells, (c) Bovine cardiac mitochondria, (d) Escherichia Coli, (e) Indicus flight muscle fibers, (f) Rat tail collagen I fibers, (g) mtDNA strands, (h) Mitochondria F1-ATPase particles. Inset: improved height image of the concerned sample washed by DI-water (left), and local microstructure of concerned images polluted by buffers crystals (right).
Scanners and Cantilevers
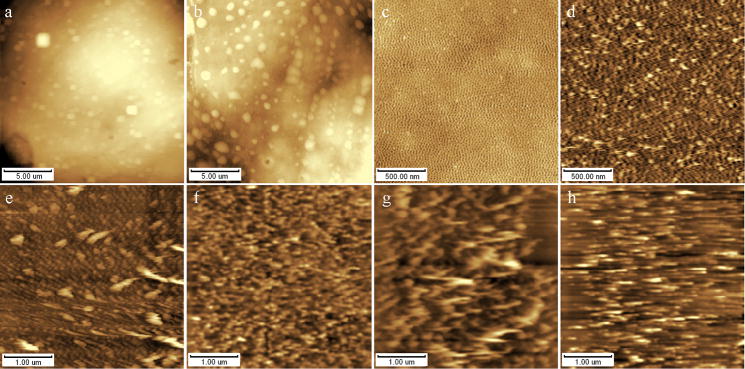
According to the properties of biologic samples and the requirements on experimental accurancy, 3 piezoelectric scanners i.e. scanner I (rang: 125×8μm, width×height), II (rang: 55×15μm) III (rang: 2.5×0.3μm) and 2 scanning modes i.e. contact and tapping mode had been applied to different samples. Fig. 3a~c had been done with scanner I, II, III separately in tapping mode, in which fig. 3a and fig. 3b came from the same cell surface in 5×5μm. There are many clear protruded spheroid showed in the cell surface with scanner II which was similar to the results from TEM, but the figure changed into obscure cuboids with scanner I, maybe it’s the expanding effect of AFM scanner I in a smaller area. Sometimes, we expect to get much more samples in one image in a larger area, on occasion we want to acquire much more details in a smaller zone. Generally speaking, scanner is better when the interesting area is around φ50μm and when height variation is smaller than 5μm; and scanner II is always better when the aimed area is φ20μm-φ2μm and height change is smaller than 10μm. When the interested area is smaller than φ2μm and height change is smaller than 300nm, we need to change the scanner into type III in order to get a clear and normal image, see fig. 3c~d. Fig. 3c~d showed phosphatidylcholine monolayer were carried out with tapping and contact mode AFM respectively, there were so many tailings in fig. 4d which were scraped by AFM tip in a larger compress force compared to the result in fig. 4c where the tip worked in a higher vibration frequency and lower contact force. Fig. 3e~h showed the AFM images of phosphatidylcholine LB film with contact mode in force setpoints of 0.3, 0.9, 1.8, 4.5V in turn. It can be seen that the force setpoint is larger, the tailing phenomena is much more serious. So, it’s better to apply tapping mode on soft biomaterials or use contact mode in a smaller force setpoint(adjust the I/P gain value in control software) in order to relieve the durative direct interaction between tips and samples and avoid the damage of AFM tips and samples (Giessibl et al. 1997). However, it’s not necessary to use tapping mode for hard samples such as crystals and other inorganic particles, and there were no obvious differences when tapping mode applied to these samples, as shown in fig. 1.
Fig. 3.
AFM height images of various biological samples determined with variety of scanner types, scanning modes and scanning forces on fresh cleaved mica. (a&b) K562 cell with 55μm and 125μm scanner respectively, (c&d) phosphatidylcholine monolayer (Langmuir film) with tapping and contact mode respectively, (e~h) phosphatidylcholine monolayer with contact mode in different contact force.
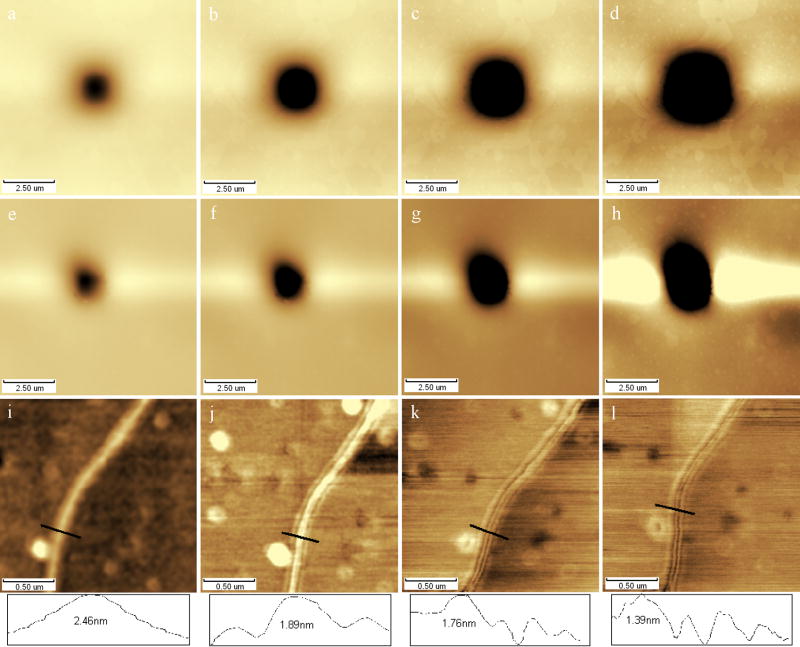
Fig. 4.
AFM height images of samples determined in different scanning time. (a~d) Phosphatidylcholine monolayer was scanned continually in the center area(2.5×2.5μm) for 5, 10, 20 and 40min respectively, (e~h) Erythrocyte was scanned continually in the center area(2.5×2.5μm) for 5, 15, 30 and 60min respectively, (i~l) DNA strands were scanned continually for 5, 15, 30 and 60min respectively. All images were collected in the same force set point.
Although tapping mode and contact mode in a smaller force can relieve the damage of samples, time accumulation of tip-sample interaction still should be paid attention to, the sample damages would be amplified along with the continue scanning (Putman et al. 1994, Moller et al. 1999). Fig. 4 showed the AFM images of 3 series of samples in a continuous scanning process, 4 images were chosen to compare with. Fig. 4a~d showed the phosphatidylcholine monolayer was scanned continually in the center area (2.5×2.5μm) for 5, 10, 20 and 40min respectively, and fig. 4e~h showed erythrocyte was scanned continually in the center area (2.5×2.5μm) for 5, 15, 30 and 60min separately, from which it can be seen that damage area had expanded and become deeper along with timedelay (Zhu et al. 2008C, Xu et al. 2008). Fig. 4i~l showed DNA molecule were scanned continually in 5, 15, 30 and 60min respectively in the same force setpoint, from which, similar damage can be seen. Section analysis results showed that DNA strands seemed to be split from 1 to 4 gradually, and the strand height become lower from 2.46nm, 1.89nm, 1.76nm to 1.39nm along with scanning process. It looked like that tip had scraped the softer biomaterials out from the main strand and dropped them onto the near area to form a parallel strand. It also might be interpreted with multi-tip effect due to the tip contamination or water meniscus formation around the tip (Kuznetsov and McPherson 2006, Zhou et al. 2007) during the scanning considered to the deformation characteristics of other particles near the DNA strand. So, long period scanning in a small area and long term usage of a tip should be avoided in biologic samples. It’s generally better to chose cantilever in smaller spring constant k in liquid contact mode AFM (k~0.1–0.4N/m), but the force exerted on sample would be not easy to keep at a small and stable value because undersize values would cause major thermal drift and vibration of cantilever. Generally speaking, cantilever in higher spring constant k would be easier to image with tapping mode in the air but cause higher interaction between tip and sample, so cantilever in higher k is in higher risk of sample damage and tip broken; vice versa. In consideration of the viscous force between soft biologic sample and tip, cantilever in smallest k should be chosen if it can ensure authenticity of images on the premise; it’s not easy to image using the cantilever in a k value smaller than 2.5N/m in the air. It’s similar in the liquid tapping mode AFM; however, k value of the cantilever used in liquid should be smaller than that in the air (Giles et al. 1993, Shibata 1994, Lindsay and Zhu 1997, Tamayo et al. 2001). Status of cantilevers (tips) also should be considered in order to check the authenticity of images except of scanner types, scanning modes and cantilever parameters (generally provided by manufacturer) (Walters et al. 1996, Wenzler et al. 1996, Miura et al. 2002, Chen et al. 2007, Nie et al. 2007).
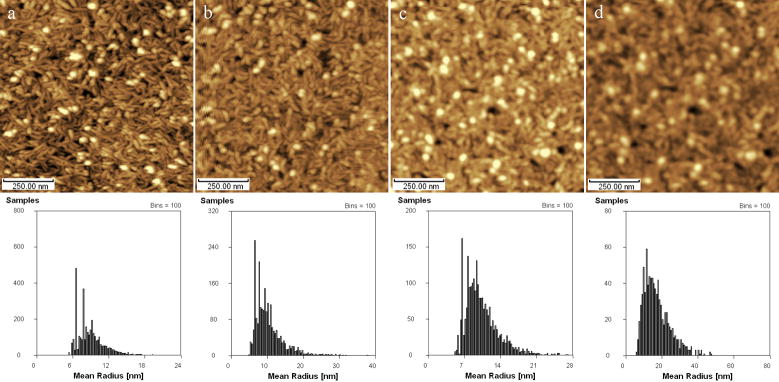
Fig. 5a~d showed AFM height images of standard Ni-plate were scanned continually in different scanning time (from 5, 60, 180, to 300min) with the histograms of particle analysis in whole image area below these height images. Images became obscurer along with the scanning process, and particle analysis showed that mean radius of particles became larger and larger but the sample count of particles in a most optimized size became lower and lower. It also can be seen that, the count of particles in whole image became smaller along with the scanning process (Starostina et al. 2008). These results might be caused by the wearing of tip in a long period scanning in which the tip wearing would result in increase of tip radius of curvature which will reduce the resolution of AFM for the expanding effect i.e. images from smaller radius tips could get much more details and vice versa. If we want to get much more details of sample surface, we have to use the tips in smaller radius of curvature and avoid using the tips too long, and we should check the damage degree of tips with standard samples frequently in order to guarantee the authenticity of images. The water meniscus formation around the tip might also make images degradation. Although it can be improved by lowering the relative humidity of AFM chamber, it still exist at 0% relative humidity according to the recent studies, so the meniscus should be considered all the time(Rozhok et al. 2004, Jang et al. 2004, Tao and Bhushan 2006, Lee et al. 2008).
Fig. 5.
AFM height images of standard Ni-plate was scanned in different scanning time with the particle analysis in whole area. (a)t=5min, (b)t=60min, (c)t=180min, (d)t=300 min. All images were collected in the same parameters and just did “X/Y flatten” one time before particle analysis.
Images treatment and analysis
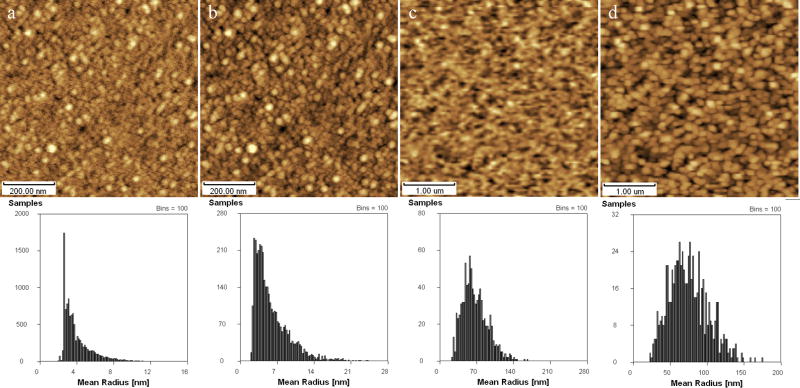
Multifunction software can improve the images in appearance, and make them more informative; however, what’s the truth is a termless goal, so how to use the software and instruments reasonably is the first importance (Meyer et al. 1991, Zhu et al. 2008d). Fig. 6a&b showed the surface microstructure of erythrocyte in which fig. 6a was just treated with “X/Y flatten” once from the original file, and fig. 6b was treated with one “minimum” after one “X/Y flatten” treatment. Much more structural details had been extracted from the latter, and there was no obvious lost of information in fig. 6b compared to fig. 6a although the results from particle analysis were different to each other (mean radius of particle in fig. 6a focused on 2.8nm, but on 3.5nm after treatment.). As an another example, the AFM height images of phosphatidylcholine film had been shown in fig. 6c&d in which the former was just done one “X/Y flatten” to the original file, and the latter was treated with one “maximum” after “X/Y flatten”. The latter was obvious in particle for the “maximum” treatment compared to fig. 6c i.e. we got much more particles but not the structural details, and there was obvious lost of information in fig. 6d compared to fig. 6c. Although the distribution of mean radius of particles were similar in fig. 6c and fig. 6d, the particles count in fig. 6d became half smaller than that in fig. 6c, which demonstrated that treatment in fig. 6d had resulted in lots of structural information lost for maximum treatment which choose the maximum value from every point and its eight adjacent points, as described in materials and methods. It can be concluded that, both of “minimum” and “maximum” in multi-treatment would lead to information lost. It’s better not to use local filter when the structure of the sample is not particles and their aggregations, or the treatments would beak the continuity of the sample surface and make the sample rougher. So, we’d better to use these treatments carefully and take care of the information including in the samples (Knoll et al. 2001) but not only the braveness appearance in the AFM images.
Fig. 6.
AFM height images treated with “minimum” and “maximum” and particle analysis of these images. (a&b) Height images of erythrocyte; (c&d) Height images of phosphatidylcholine film; (a) and (c) were the original images just treated with “X/Y flatten” one time, (b) and (d) were treated with “minimum” and “maximum” based on image (a) and (c) respectively.
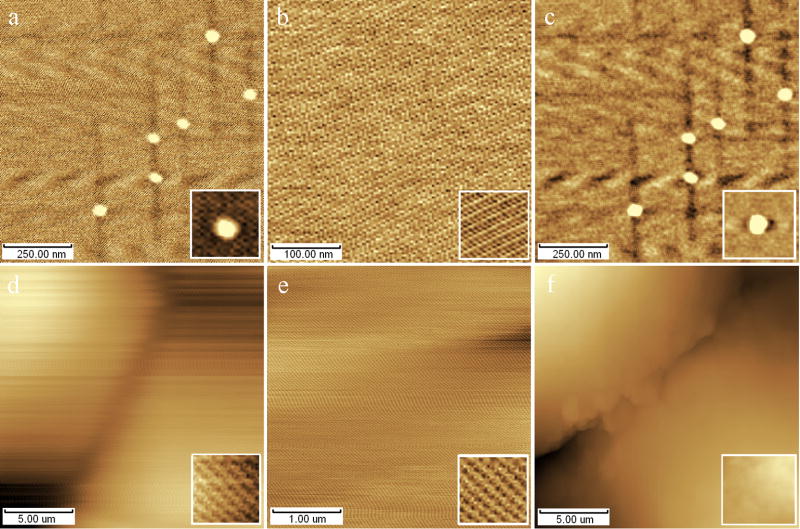
Owing to the environment interference, systematic instability and improper parameter-setup, there are noises signals appeared in the scanning process frequently, sometimes they are ugly and easy to be made out, but sometimes they are really beautiful and hard to be trashed by scientists (Couturier et al. 2002 and 2003, Kowalewski et al. 2006). Examples on background noise were showed in fig. 7. Fig. 7a~c was from F1-ATPase particles. Fig. 7a was just done one “X/Y flatten” treatment from original AFM file, it looked like so many regular and beautiful stripes on the surface of image as shown in fig. 7b which was a amplified image was cut directly from fig. 7a. However, these beautiful stripes always changed their directions in different scanned results, which demonstrated that the beautiful stripes were background noise from instrumental signal transformation but not the inherent structure of the sample in fact. Fig. 7c showed the surface image of F1-ATPase particles on mica where the background noise had been filtered. The difference had been shown in the insets of fig. 7a&c, and there was no regular background noise (Butt et al. 1995) in the latter inset image. Fig. 7d~f were AFM height images of SW180 cells. Fig. 7d&e were the original images just treated with “X/Y flatten” one time in which fig. 7e was chosen from fig. 7d, and the insets of them were cut from themselves and then be treated with “averaging”. There were similar stripes signals in same positions of fig. 7d&e, so it’s the background noise but not the real structure of SW180 cell. Fig. 7f showed the smooth surface of SW180 cell without visible noise. So we have to pay attention to the repeated and regular structure in the surface of sample from AFM, we can make out the signals contaminations by trying several different scan or trying the scan in different locations to check the regularity of the images, then extracting the background noise with “noise filter” treatment, or scan the sample again through changing the parameters.
Fig. 7.
AFM height images treated with “averaging” treatment. (a~c) height images of F1-ATPase particles; (d~f) height images of SW180 cells; (a) and (d) were the original images just treated with “X/Y flatten” one time; (c) and (f) were scanned without noise; (b) was cut from (a) directly, and (e) was scanned newly in a smaller area on (d). Inset: local microstructure of concerned image treated with “averaging”.
Conclusions
We have demonstrated a variety of key factors in successful AFM such as sample preparation, scan setup, data collection and analysis in order to avoid gloss phenomena effectively. Substrates should be chosen carefully by their surface roughness and chemical properties to lower the influence to the sample topography, and fix the sample tightly. Crystals from buffer solution also should be paid attention to in sample preparation which may influence the repeatability, integrality, reliability of AFM examinations. So, washing sample with DI water or carrying AFM in non-saturated buffer solution would lower the contamination. Considered to the instability of biologic samples, scanning parameters including scanner type, scan mode, scan speed, and cantilever should be adjusted and varied according to the quality of the collected images. Tapping mode working in a lower scanning speed with a certain smaller force is preferred for raw data collection. AFM off-line software can make image informative and easy to analysis but also produce artifacts in high probability, so considering to the topographic characteristics and checking the sample with other techniques should be better to scientific conclusions. In a word, proper sample preparation, scan setup, data collection and image treatment/analysis should be done carefully to avoid gloss phenomena effectively.
Supplementary Material
AFM top view of fresh cleaved mica (a) and treated glass cover (b) surfaces with section analysis below. Inset: atomic array in 1×1nm area which scanned with contact mode AFM in 5 Hz.
Acknowledgments
We would like to thank Prof. Irving, Prof. Orgel at IIT, and Prof. Sun at SNU for their generous and helpful discussions. Prof. Wang, Dr. Deng and Dr. Guo are acknowledged for their help in AFM manipulation and data treatment. This project is supported by Talent Foundation of Northwest A&F University (No. 01140501) and Foundation of China Scholarship Council (No. 2007103068), and partly supported by National Institute of Health Grant (No. RR-08630).
References
- Binnig G, Quate CF, Gerber C. Atomic Force Microscope. Phys Rev Lett. 1986;56:930–933. doi: 10.1103/PhysRevLett.56.930. [DOI] [PubMed] [Google Scholar]
- Brayshaw DJ, Berry M, McMaster TJ. Optimization of sample preparation methods for air imaging of ocular mucins by AFM. Ultramicroscopy. 2003;97:289–296. doi: 10.1016/S0304-3991(03)00054-8. [DOI] [PubMed] [Google Scholar]
- Butt HJ, Jaschke M. Calculation of thermal noise in atomic force microscopy. Nanotechnology. 1995;6:1–7. [Google Scholar]
- Chen BY, Yeh MK, Tai NH. Accuracy of the spring constant of atomic force microscopy cantilevers by finite element method. Anal Chem. 2007;79:1333–1338. doi: 10.1021/ac061380v. [DOI] [PubMed] [Google Scholar]
- Chen H. Atomic force microscopy of recombinant adeno-associated virus-2 prepared by centrifugation. Scanning. 2007;29:238–242. doi: 10.1002/sca.20067. [DOI] [PubMed] [Google Scholar]
- Chung SW, Presley AD, Elhadj S, Hok S, Hah SS, Chernov AA, Francis MB, Eaton BE, Feldheim DL, Deyoreo JJ. Scanning probe-based fabrication of 3D nanostructures via affinity templates, functional RNA, and meniscus-mediated surface remodeling. Scanning. 2008;30:159–171. doi: 10.1002/sca.20086. [DOI] [PubMed] [Google Scholar]
- Couturier G, Nony L, Boisgard R, Aime JP. Stability of an oscillating tip in noncontact atomic force microscopy: Theoretical and numerical investigations. J Appl Phy. 2002;91:2537–2543. [Google Scholar]
- Couturier G, Boisgard R, Nony L, Aime JP. Noncontact atomic force microscopy: Stability criterion and dynamical responses of the shift of frequency and damping signal. Rev Sci Instrum. 2003;74:2726–2734. [Google Scholar]
- Defranchi E, Bonaccurso E, Tedesco M, Canto M, Pavan E, Raiteri R, Reggiani C. Imaging and elasticity measurements of the sarcolemma of fully differentiated skeletal muscle fibres. Microsc Res Tech. 2005;67:27–35. doi: 10.1002/jemt.20177. [DOI] [PubMed] [Google Scholar]
- Domke J, Dannohl S, Parak WJ, Muller O, Aicher WK, Radmacher M. Substrate dependent differences in morphology and elasticity of living osteoblasts investigated by atomic force microscopy. Colloids Surf B:Biointerfaces. 2000;19:367–379. doi: 10.1016/s0927-7765(00)00145-4. [DOI] [PubMed] [Google Scholar]
- Feng SC, Vorburger TV, Joung CB, Dixson RG, Fu J, Ma L. Computational models of a nano probe tip for static behaviors. Scanning. 2008;30:47–55. doi: 10.1002/sca.20079. [DOI] [PubMed] [Google Scholar]
- Giessibl FJ. Forces and frequency shifts in atomic-resolution dynamic-force microscopy. Phys Rev B. 1997;56:16010–16015. [Google Scholar]
- Giessibl FJ. Advances in atomic force microscopy. Rev Mod Phy. 2003;75:949–983. [Google Scholar]
- Giles R, Cleveland JP, Manne S, Hansma PK, Drake B, Maivld P, Boles C, Gurley J, Elings V. Non-contact force microscopy in liquids. Appl Phys Lett. 1993;63:617–618. [Google Scholar]
- Haaheim J, Nafday OA. Dip pen Nanolithography (R): A “Desktop Nanofab (TM)” approach using high-throughput flexible nanopatterning. Scanning. 2008;30:137–150. doi: 10.1002/sca.20098. [DOI] [PubMed] [Google Scholar]
- Hansma HG. Surface biology of DNA by atomic force microscopy. Annu Rev Phys Chem. 2001;52:71–92. doi: 10.1146/annurev.physchem.52.1.71. [DOI] [PubMed] [Google Scholar]
- Jang JY, Schatz GC, Ratner MA. How narrow can a meniscus be? Phys Rev Lett. 2004;92:085504–4. doi: 10.1103/PhysRevLett.92.085504. [DOI] [PubMed] [Google Scholar]
- Jason JD, Allen H, Hill O, Powell T. High resolution scanning force microscopy of cardiac myocytes. Cell Biol Intern. 2001;25:1271–1277. doi: 10.1006/cbir.2001.0813. [DOI] [PubMed] [Google Scholar]
- Ke YG, Lindsay S, Chang Y, Liu Y, Yan H. Self-assembled water-soluble nucleic acid probe tiles for label-free RNA hybridization assays. Science. 2008;319:180–183. doi: 10.1126/science.1150082. [DOI] [PubMed] [Google Scholar]
- Knoll A, Magerle R, Krausch G. Tapping mode atomic force microscopy on polymers: Where is the true sample surface? Macromolecules. 2001;34:4159–4165. [Google Scholar]
- Kowalewski T, Legleiter J. Imaging stability and average tip-sample force in tapping mode atomic force microscopy. J Appl Phys. 2006;99:064903–6. [Google Scholar]
- Kuznetsov YG, McPherson A. Identification of DNA and RNA from retroviruses using ribonuclease A. Scanning. 2006;28:278–281. doi: 10.1002/sca.4950280506. [DOI] [PubMed] [Google Scholar]
- Lee WK, Sheehan PE. Scanning probe lithography of polymers: Tailoring morphology and functionality at the nanometer scale. Scanning. 2008;30:172–183. doi: 10.1002/sca.20084. [DOI] [PubMed] [Google Scholar]
- Lindsay S, Zhu J, Hudson J. A high-resolution fluid imaging system. American Laboratory. 1997;29:15–16. [Google Scholar]
- Lv MY, Chen QB, Yonese M, Xu SH, Liu HL. Auto-organized nano-structure of collagen on Gemini surfactant monolayer. Colloids Surf B:Biointerfaces. 2008;61:282–289. doi: 10.1016/j.colsurfb.2007.09.005. [DOI] [PubMed] [Google Scholar]
- Lyubchenko Y, Shlyakhtenko L, Harrington R, Oden P, Lindsay S. Atomic force microscopy of long DNA-imaging in air and under water. Proc Natl Acad Sci USA. 1993;90:2137–2140. doi: 10.1073/pnas.90.6.2137. [DOI] [PMC free article] [PubMed] [Google Scholar]
- McAloney RA, Sinyor M, Dudnik V, Goh MC. Atomic force microscopy studies of salt effects on polyelectrolyte multilayer film morphology. Langmuir. 2001;17:6655–6663. [Google Scholar]
- Meyer E, Howald L, Overney RM, Heinzelmann H, Frommer J, Guntherodt HJ, Wagner T, Schier H, Roth S. Molecular resolution images of Langmuir-Blodgett films using atomic force microscopy. Nature. 1991;349:398–400. [Google Scholar]
- Miura N, Tsukada M. Theoretical analysis of tip effect on noncontact atomic force microscopy image of Si(100) 2×1:H surface. Jpn J Appl Phys. 2002;41:306–308. [Google Scholar]
- Moller C, Allen M, Elings V, Engel A, Muller DJ. Tapping-mode atomic force microscopy produces faithful high resolution images of protein surfaces. Biophys J. 1999;77:1150–1158. doi: 10.1016/S0006-3495(99)76966-3. [DOI] [PMC free article] [PubMed] [Google Scholar]
- Muller DJ, Engel A, Amrein M. Preparation techniques for the observation of native biological systems with the atomic force microscope. Biosens Bioelectron. 1997a;12:867–877. [Google Scholar]
- Muller DJ, Amrein M, Engel A. Adsorption of biological molecules to a solid support for scanning probe microscopy. J Struc Biol. 1997b;119:172–188. doi: 10.1006/jsbi.1997.3875. [DOI] [PubMed] [Google Scholar]
- Muller DJ, Engel A. Atomic force microscopy and spectroscopy of native membrane proteins. Nature Protocols. 2007;2:2191–2197. doi: 10.1038/nprot.2007.309. [DOI] [PubMed] [Google Scholar]
- Muller DJ, Dufrene YF. Atomic force microscopy as a multifunctional molecular toolbox in nano-biotechnology. Nature Nanobiotechnology. 2008;3:261–269. doi: 10.1038/nnano.2008.100. [DOI] [PubMed] [Google Scholar]
- Narukawa J, Yamamoto K, Ohtani T, Sugiyama S. Imaging of silkworm meiotic chromosome by atomic force microscopy. Scanning. 2007;29:123–127. doi: 10.1002/sca.20032. [DOI] [PubMed] [Google Scholar]
- Nie HY, McIntyre NS. Unstable amplitude and noisy image induced by tip contamination in dynamic force mode atomic force microscopy. Rev Sci Instrum. 2007;78:023701–6. doi: 10.1063/1.2437196. [DOI] [PubMed] [Google Scholar]
- Parot P, Dufrene YF, Hinterdorfer P, Le Grimellee C, Navajas D, Pellequer JL, Scheuring S. Past, present and future of atomic force microscopy in life sciences and medicine. J Mol Recognit. 2007;20:418–431. doi: 10.1002/jmr.857. [DOI] [PubMed] [Google Scholar]
- Putman CAJ, Vanderwerf KO, Degrooth BG, Vanhulst NF, Greve J. Tapping mode atomic force microscopy in liquid. Appl Phys Lett. 1994;64:2454–2456. [Google Scholar]
- Revenko I, Proksch R. Magnetic and acoustic tapping mode microscopy of liquid phase phospholipids bilayers and DNA molecules. J Appl Phys. 2000;87:526–533. [Google Scholar]
- Rozhok S, Sun P, Piner R, Lieberman M, Mirkin CA. AFM study of water meniscus formation between an AFM tip and NaCl substrate. J Phys Chem B. 2004;108:7814–7819. [Google Scholar]
- Shao ZF, Mou J, Czajkowsky DM, Yang J, Yuan JY. Biological atomic force microscopy: what is achieved and what is needed. Adv Phys. 1996;45:1–86. [Google Scholar]
- Shibata ST. Imaging of cells with atomic force microscopy operated at “tapping” mode. J Vac Sci Technol B. 1994;3:1530–1534. [Google Scholar]
- Starostina N, Brodsky M, Prikhodk S, Hoo CM, Mecartney ML, West P. AFM capabilities in characterization of particles and surfaces: From angstroms to microns. J Cosmet Sci. 2008;59:225–232. [PubMed] [Google Scholar]
- Tamayo AD, Humphris L, Owen RJ. High-Q Dynamic Force Microscopy in Liquid and Its Application to Living Cells. Biophys J. 2001;81:526–537. doi: 10.1016/S0006-3495(01)75719-0. [DOI] [PMC free article] [PubMed] [Google Scholar]
- Tao ZH, Bhushan B. Wetting properties of AFM probes by means of contact angle measurement. J Phys D: Appl Phys. 2006;39:3858–3862. [Google Scholar]
- Venkataraman S, Allison DP, Qi H, Morrell-Falvey JL, Kallewaard NL, Crowe JE, Doktycz MJ. Automated image analysis of atomic force microscopy images of rotavirus particles. Ultramicroscopy. 2006;106:829–837. doi: 10.1016/j.ultramic.2006.01.014. [DOI] [PubMed] [Google Scholar]
- Vesenka J, Guthold M, Tang CL, Keller D, Delaine E, Bustamante C. Substrate preparation for reliable imaging of DNA-molecules with the scanning force microscope. Ultramicroscopy. 1992;42:1243–1249. doi: 10.1016/0304-3991(92)90430-r. [DOI] [PubMed] [Google Scholar]
- Walters DA, Cleveland JP, Thomson NH, Hansma PK, Wendman MA, Gurley G, Elings V. Short cantilevers for atomic force microscopy. Rev Sci Instrum. 1996;67:3583–3590. [Google Scholar]
- Wenzler LA, Moyes GL, Beebe TP. Improvements to atomic force microscopy cantilevers for increased stability. Rev Sci Instrum. 1996;67:4191–4197. [Google Scholar]
- Xu C, Jones RL, Batteas JD. Dynamic variations in adhesion of self-assembled monolayers on nanoasperities probed by atomic force Microscopy. Scanning. 2008;30:106–117. doi: 10.1002/sca.20095. [DOI] [PubMed] [Google Scholar]
- Zhou XF, Zhang Y, Wang HB, Niu DX, Wang PQ, Hu J. Humidity effects on imaging and nanomanipulation of individual DNA molecules on HOPG surface. Chin Phys Lett. 2007;24:2692–2695. [Google Scholar]
- Zhu J, Guo L, Zhang B, Hu J, Wang G. Microscale biomechanics measurements with atomic force microscopy and the concerned techniques. Life Sci Instrum. 2007a;5:3–9. [Google Scholar]
- Zhu J, Lan L, Wang G. Study on ultrastructure change and cross-linking behaviors of microtusfortis neurocytes in physiological solution with contact mode atomic force microscopy. Scanning. 2007b;29:56. [Google Scholar]
- Zhu J, Wang G. Applications of Atomic Force Microscopy to Supramolecular Structure and Functions of ATP synthase. Polym Mater Sci Eng. 2007c;23:16–20. [Google Scholar]
- Zhu J, Guo LH, Lan L, Wang GD, Guo L. Observing biophysical properties of swine myocardium and mitochondria with tapping mode scanning probe microscope. FASEB J. 2008a;22(Suppl):801–801. [Google Scholar]
- Zhu J, Guo L, Wang G. Study on the original height and compression elasticity of the DNA strands with atomic force microscopy. Chin J Appl Mech. 2008b;25:172–176. [Google Scholar]
- Zhu J, Guo LH, Lan L, Wang GD. Study on concerned medical parameter and ultrastructure of human erythrocyte with atomic force microscopy. Biophys J. 2008c;94(Suppl):1222A–1222A. [Google Scholar]
- Zhu J, Wang G. Study on Surface Structure and Physical and Chemical Properties of Bioorganic LB Films with Atomic Force Microscopy. Life Sci Instrum. 2008d;6:22–30. [Google Scholar]
Associated Data
This section collects any data citations, data availability statements, or supplementary materials included in this article.
Supplementary Materials
AFM top view of fresh cleaved mica (a) and treated glass cover (b) surfaces with section analysis below. Inset: atomic array in 1×1nm area which scanned with contact mode AFM in 5 Hz.


