

Abstract
We hypothesized that plasma non-esterified fatty acids (NEFA) are trafficked directly to intramyocellular long-chain acylcarnitines (imLCAC) rather than transiting intramyocellular triglycerides (imTG) on the way to resting muscle fatty acid oxidation. Overnight fasted adults (n= 61) received intravenous infusions of [U-13C]palmitate (0400–0830 h) and [U-13C]oleate (0800–1400 h) labelling plasma NEFA, imTG, imLCAC and im-non-esterified FA (imNEFA). Two muscle biopsies (0830 and 1400 h) were performed following 6 h, overlapping, sequential palmitate/oleate tracer infusions. Enrichment of plasma palmitate was ∼15 times greater than enrichment of imTG, imNEFA-palmitate and im-palmitoyl-carnitine. Fatty acid enrichment in LCAC was correlated with imTG and imNEFA; there was a significant correlation between imTG concentrations and imLCAC concentrations in women (r= 0.51, P= 0.005), but not men (r= 0.30, P= 0.11). We estimated that ∼11% of NEFA were stored in imTG. imTG NEFA storage was correlated only with NEFA concentrations (r= 0.52, P= 0.004) in women and with  (r= 0.45, P= 0.02) in men. At rest, plasma NEFA are trafficked largely to imTG before they enter LCAC oxidative pools; thus, imTG are an important, central pool that regulates the delivery of fatty acids to the intracellular environment. Factors relating to plasma NEFA storage into imTG differ in men and women.
Introduction
Excess fatty acid availability has been linked with muscle insulin resistance via several pathways, including the classic glucose–fatty acid cycle (Randle et al. 1963), long-chain acyl-CoAs (Ellis et al. 2000), diacylglycerols (Chen et al. 1991) and ceramides (Stratford et al. 2004). Although early reports (Dagenais et al. 1976) suggested that NEFA enter imTG pools prior to oxidation, it is now widely believed that a significant portion of plasma NEFA do not first enter intramuscular triglycerides (imTG), but instead are trafficked directly into long-chain acyl-carnitines (LCAC), the obligate precursor pool for mitochondrial fatty acid oxidation in muscle. NEFA tracer studies have shown leg release of isotopically labelled CO2 (Sidossis et al. 1996; Rasmussen et al. 2002; Sacchetti et al. 2002, 2004) in a time frame that is interpreted as indicating direct entry of NEFA to the LCAC pool. In addition, animal studies have suggested that ∼1/3 of NEFA taken up by muscle are directly converted to LCAC based upon the isotopic enrichment in plasma NEFA and intramyocellular LCAC (Sun et al. 2006). If this is true, plasma NEFA are a substantial, proximal source of fatty acids that muscle requires to meet oxidative needs and imTG play a largely passive role in muscle metabolism.
Although cross-sectional data (Pan et al. 1997; Jacob et al. 1999; Goodpaster et al. 2000) and intervention studies (Boden et al. 2001) have linked greater intramyocellular triglyceride (imTG) concentrations to obesity and insulin resistance, it has been proposed that defects in muscle fatty acid oxidation predispose to increased imTG (Colberg et al. 1995; Kelley & Mandarino, 2000). Confounding these theories is the fact that aerobically fit adults have greater imTG concentrations than sedentary individuals (Kiens et al. 1993) and women have greater imTG than men (Steffensen et al. 2002; Roepstorff et al. 2006) yet are not insulin resistant. In order to understand the inter-relationships between these fatty acid pools it is necessary to directly measure the relationship between plasma NEFA, imTG fatty acids and LCAC in humans. Assays allowing the measurement of LCAC concentrations and enrichment in muscle have recently been developed (Guo et al. 2006; Sun et al. 2006). Thus, it is now possible to determine if the enrichment of fatty acids in imLCAC of humans more closely reflect plasma, indicating a direct trafficking of NEFA to oxidation, or imTG, which would suggest this pool plays a more central role in lipid fuel delivery than is currently suspected.
The purpose of this study was to examine the relationship between plasma NEFA and imTG, LCAC and imNEFA, and to identify important clues to the understanding of imTG synthesis. We hypothesized that plasma NEFA are direct precursors of the LCAC pool. By giving intravenous infusions of 13C-free fatty acid (FFA) tracers combined with muscle biopsies using a pulse–chase study design (Spriet et al. 1986; Guo et al. 2000), we can relate plasma NEFA concentrations and enrichment to LCAC concentrations and enrichment in the context of imTG. Our findings refute the hypothesis that plasma NEFA are direct, major contributors to muscle fatty acid oxidation in resting, overnight postabsorptive humans. We also report that NEFA incorporation into imTG seems to follow sex-specific patterns that have implications for understanding potential treatments.
Methods
Subjects
Sixty-one volunteers (31 males, 30 premenopausal females), body mass index (BMI) 18–38 kg m−2, participated in this Mayo Institutional Review Board (IRB) approved study. The participants provided written, informed consent in accordance with the Declaration of Helsinki. They were recruited to include a wide range of activity/fitness levels, from sedentary to highly trained, including normal weight men (n= 6) and women (n= 7) who exercised > 30 min per day 4 times per week for at least 2 years.
Body composition and fitness testing
Total body fat and fat free mass (FFM), and regional fat and FFM were assessed using dual-energy x-ray absorptiometry (DEXA) and a single slice computerised tomography (CT) scan at L2-3 interspace to measure visceral and abdominal subcutaneous fat area (Jensen et al. 1995b). Approximately 1 week prior to the study, peak aerobic capacity ( ) was determined on a treadmill with a modified Bruce protocol (Doan et al. 1965), with heart rate monitored by a 10-lead electrocardiogram.
Experimental design
Figure 1 shows the design of the study. The volunteers maintained their usual physical activity during the week before the study, but were asked not to participate in vigorous physical exercise the day prior to admission. They consumed an isocaloric diet for 5 days prior to the study (55% carbohydrates, 30% fat and 15% protein), prepared by the Mayo General Clinical Research Center (GCRC) metabolic kitchen. The evening of the last day the participants were admitted to the GCRC and fasted after the evening meal. Prior to beginning the tracer infusions, baseline blood samples were collected for measurement of background plasma NEFA enrichment, which was also used to estimate the background enrichment of intramyocellular fatty acids. An intravenous catheter was placed in a forearm vein and kept patent with a continuous infusion of 0.45% NaCl. To study the relationship between plasma NEFA and intramyocellular fatty acid metabolites we used a pulse–chase approach similar to that previously reported (Guo et al. 2000). To pre-label (pulse) the imTG pool, a continuous infusion of albumin-bound [U-13C]palmitate (6 nmol (kg FFM)−1 min−1) was initiated at 0400 h and continued until the first muscle biopsy at 0830 h. At 0800 h, a continuous infusion of albumin-bound [U-13C]oleate (6 nmol (kg FFM)−1 min−1) was started to act as the ‘chase’ isotope and continued until 1400 h. Blood samples were collected at 10 min intervals between 0800 and 0830 h using the heated hand vein technique from a retrograde intravenous catheter. Resting energy expenditure (REE) was measured from 0730–0750 h using a DeltaTrac Metabolic Cart (Yorba Linda, CA, USA). After the blood samples and REE measurements, a muscle biopsy was taken from the vastus lateralis under local anaesthesia (2% lidocaine : 8.9% sodium bicarbonate, 3 : 1) using sterile technique. After anaesthetizing the skin and subcutaneous tissues a layer of anaesthetic was infiltrated over the outer surface of the muscle fascia. Sufficient time was allowed for complete anaesthesia before we made the skin and muscle fascia incisions used to insert the Bergstrom needle to perform the biopsies. The volunteers remained in bed until the completion of the second biopsy, but were asked to move both legs every 15 min to avoid complete immobility. Between 1300 and 1300 h REE was measured and blood samples were collected at 10 min intervals for measuring NEFA enrichment. This was immediately followed by a second muscle biopsy taken from the contralateral leg. The volunteers remained in the GCRC until the following morning.
Figure 1. Schematic of the experimental design.

Time is presented as clock time. RMR, resting metabolic rate using indirect calorimetry; FFM, fat free mass.
The muscle tissue (∼300 mg) was immediately washed of blood using an ice-cold normal saline solution, dissected of all visible adipose tissue, further rinsed of lipid droplets, and saved immediately in liquid N2. Samples were stored at −80°C until analysis.
Materials
[U-13C]palmitate and [U-13C]oleate were obtained from Isotec (Miamisburg, OH, USA), as were custom-synthesized standards for [U-13C]LCAC. The NEFA were prepared for intravenous infusion as a solution of 0.3% albumin in 0.9% NaCl.
Plasma substrate analyses
Plasma glucose was measured using a Beckman (Beckman Instruments, Fullerton, CA, USA); Plasma total NEFA, oleate and palmitate concentrations were measured by HPLC (Miles et al. 1987; Jensen et al. 1988). In brief, after adding [2H31]palmitate as an internal standard to plasma samples the NEFA were extracted using a Dole solution and phenacyl derivatives created. The NEFA were injected onto a 5 μm octadecyl silica column, eluted with acetonitrile : H2O (83 : 17) and the peak heights measured by UV detection at 254 nm. Plasma palmitate and oleate enrichments were measured using gas chromatography/combustion/isotope ratio mass spectrometry (GC/C/IRMS) (Guo et al. 1997). Plasma and muscle triglyceride concentrations were measured by a microflourometric method (Humphreys et al. 1990).
Muscle lipids
The frozen muscle samples were first meticulously dissected free of extra-myocellular adipocytes while being kept near 0°C (Guo et al. 2001). This approach has been shown to eliminate extra-myocellular TG and we have shown that there are no adipocytes inside the perimysium to contaminate true imTG (Guo et al. 2001). The resultant muscle was then pulverized into fine powder by using a stainless-steel mortar and pestle on dry ice. The powder was extracted for total lipids (Folch et al. 1957), from which triglyceride was purified by HPLC (Christie, 1985). The purified muscle triglyceride was directly transmethylated by using 2.5% H2SO4 in methanol at 70°C for 2 h. The enrichment of imTG palmitate and oleate and imNEFA palmitate and oleate were determined by GC/C/IRMS (Guo & Jensen, 1998). Intramyocellular palmitoyl- and oleyl-carnitine concentrations and enrichments were measured using liquid chromatography/electrospray ionization ion-trap tandem mass spectrometry (LC/MS/MS) (Guo et al. 2006). Intramyocellular palmitoyl- and oleyl-carnitine concentrations and enrichments were measured by LC/MS/MS as previously described in Guo et al. 2006 with the following modifications – the palmitoyl- and oleyl-carnitines were separated on a Varian C8 100 × 2.0 mm column with 3 mm particle (Palo Alto, CA, USA) at 0.25 ml min−1 flow rate via Cohesive TX2 liquid chromatography system-LC (Franklin, MA, USA). All ions were monitored in multi-reaction-mode (MRM) on an Applied Biosystem API5000 mass spectrometer-MS (Foster City, CA, USA).
To test for incomplete oxidation products of palmitate and oleate we used the same approach to test muscle sample extracts for [U-13C]myristoyl–carnitine.
Calculations
Assessment of NEFA kinetics using oleate tracers
Palmitate and oleate flux were calculated as μmol min−1 using steady state formulas because concentration and enrichment were stable over the sampling intervals. The average palmitate and oleate enrichment were used to calculate steady state rates of appearance (Ra) and disappearance (Rd). Palmitate and oleate flux were converted to total NEFA flux using the relationship between plasma oleate concentrations and total NEFA concentrations (measured by HPLC (Jensen et al. 1990)). Oleate was the tracer of choice for NEFA kinetics because it was in use during both the morning and afternoon sampling intervals, whereas the palmitate tracer was only being infused during the morning interval.
Storage of NEFA in imTG
To calculate the storage of NEFA into imTG we used the increase in imTG palmitate or imTG oleate enrichment that occurred during the tracer infusion and the plasma NEFA-palmitate and oleate enrichments. The formulas we employed are as follows:
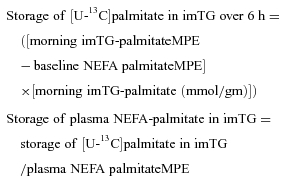 |
The same formulas were used to calculate the storage of [U-13C]oleate in imTG and plasma NEFA-oleate in imTG, but employed the afternoon muscle biopsy and plasma data.
In essence, the changes in enrichment of imTG palmitate (morning biopsy) and imTG oleate (afternoon biopsy) during the tracer infusions were derived by subtracting the enrichments observed after the 6 h infusion from each individual's background plasma NEFA palmitate or oleate enrichment. Previous work (Sacchetti et al. 2004) has shown that imTG enrichment increases in a linear fashion over this interval of time. Thus, for the morning muscle biopsy, the imTG palmitate concentration (μmol (gm muscle)−1– palmitate was ∼23% of imTG fatty acids) was multiplied by the imTG palmitate enrichment to determine the accumulation of infused tracer in imTG over 6 h. The same approach was used to measure NEFA storage in imTG using the afternoon muscle biopsy and the [U-13C]oleate tracer, except that oleate was ∼33% of imTG fatty acids. The tracer content (μmol of [U-13C]palmitate or [U-13C]oleate) in imTG was divided by the average plasma palmitate or oleate enrichment to determine the accumulation of NEFA into imTG (μmol NEFA (gm skeletal muscle)−1 h−1).
Whole body skeletal muscle mass was derived from DEXA FFM using the estimates that 53% and 47% of fat free mass is skeletal muscle in men and women, respectively (Wang et al. 1996, 2001). To the extent that vastus lateralis is representative of skeletal muscle in general, it is possible to estimate the fraction of NEFA stored in whole body skeletal imTG. We used plasma NEFA storage rates (μmol NEFA/whole body skeletal muscle h−1) divided by NEFA flux (μmol h−1) to calculate the per cent of NEFA stored in imTG.
Fatty acid oxidation rates were calculated using  ,
,  and urinary nitrogen excretion rates with published formulas (Frayn, 1983).
Statistical analysis
The statistical analysis was conducted using SPSS (version 16.0, Chicago, IL, USA). An independent t test was used to compare the descriptive characteristics of the subject by gender and a separate independent t test to show differences in enrichment between the muscle biopsies taken in the morning and afternoon. A Pearson's product correlation was used to determine an association between variables. Values are expressed as means ± standard deviation (s.d.).
Results
Volunteer characteristics (Table 1)
Table 1.
Subject characteristics
| Female | Male | ||
|---|---|---|---|
| Age (years) | 38± 1 | 34 ± 1 | P= 0.003 |
| BMI (m kg−1) | 26.9 ± 1.1 | 27.3 ± 1.1 | |
| Weight (kg) | 74.64 ± 3.54 | 88.72 ± 3.48 | P= 0.006 |
| Fat free mass (kg) | 45.94 ± 1.14 | 64.23 ± 1.12 | P= 0.0001 |
| Per cent body fat | 36 ± 2 | 24 ± 2 | P= 0.0001 |
| Waist circumference (cm) | 92 ± 4 | 94 ± 4 | |
| Hip circumference (cm) | 106 ± 3 | 103 ± 3 | |
| Waist : hip ratio | 0.86 ± 0.02 | 0.91 ± 0.02 | P= 0.023 |
| Visceral fat (cm2) | 75 ± 17 | 133 ± 17 | P= 0.019 |
| Abdominal subcutaneous fat (cm2) | 183 ± 24 | 157 ± 24 | |
| Thigh muscle (cm2) | 216 ± 11 | 302 ± 12 | P < 0.0001 |
| Thigh fat (cm2) | 247 ± 22 | 122 ± 23 | P < 0.0001 |
 |
217 ± 29 | 274 ± 40 | P < 0.01 |
| Resting RER | 0.81 ± 0.05 | 0.80 ± 0.03 | |
 (ml (kg FFM)−1 min−1) (ml (kg FFM)−1 min−1) |
48.3 ± 1.9 | 51.6 ± 1.9 |
Values are mean ± standard error. BMI, body mass index; body fat and muscle area were measured using a single slice computed tomography scan of the abdomen and of the thigh; RER, respiratory exchange ratio.
Women were slightly older (∼4 years) than the men (P < 0.01), but otherwise were of comparable average BMI and fitness level. The men had a greater visceral fat area (P < 0.05) and the women had a slightly, but not significantly greater abdominal subcutaneous fat area.
Plasma NEFA (Table 2)
Table 2.
Plasma and intramyocellular fatty acid data
| AM | PM | |
|---|---|---|
| Plasma | ||
| NEFA concentrations (μmol l−1) | 418 ± 159 | 652 ± 200* |
| NEFA flux (μmol min−1) | 392 ± 142 | 461 ± 140* |
| imTG (μmol gm−1) | 2.25 ± 1.49 | 2.33 ± 1.60 |
| Palmitoyl-carnitine (μmol gm−1) | 0.078 ± 0.026 | 0.073 ± 0.029 |
| Oleyl-carnitine (μmol gm−1) | 0.276 ± 0.133 | 0.271 ± 0.132 |
| NEFA | ||
| Palmitate MPE | 0.366 ± 0.151 | 0.020 ± 0.008* |
| Oleate MPE | 0.226 ± 0.115 | 0.178 ± 0.061* |
| Muscle | ||
| imTG | ||
| Palmitate MPE | 0.021 ± 0.008 | 0.022 ± 0.009 |
| Oleate MPE | 0.012 ± 0.004 | 0.018 ± 0.009* |
| LCAC | ||
| Palmitoyl-carnitine MPE | 0.024 ± 0.010 | 0.017 ± 0.008* |
| Oleyl-carnitine MPE | 0.004 ± 0.003 | 0.019 ± 0.011* |
| imNEFA | ||
| Palmitate MPE | 0.024 ± 0.014 | 0.021 ± 0.011 |
| Oleate MPE | 0.012 ± 0.007 | 0.025 ± 0.012* |
P < 0.01 morning vs. afternoon biopsy. Values are mean ± standard deviation. All intramyocellular concentrations are given per gm wet weight; imTG, intramyocellular triglyceride; LCAC, long-chain acyl-carnitine; imNEFA, intramyocellular non-esterified fatty acid.
As expected, plasma NEFA concentrations (P < 0.0001) and flux (P < 0.0005) increased from morning to afternoon as a result of an additional 6 h of fasting. The fat oxidation rates were greater in the afternoon at the time of the second biopsy than in the morning (301 ± 11 and 271 ± 10 μmol min−1). Average plasma NEFA palmitate and oleate enrichment values during the morning and afternoon study intervals are also given in Table 2. As the [U-13C]palmitate infusion was discontinued after the morning biopsy, the enrichment in plasma NEFA palmitate in the afternoon had decreased by ∼95% from the morning to the afternoon study interval.
Intramyocellular fatty acid concentrations
Table 2 provides imTG concentrations (μmol (g wet weight)−1) observed after an overnight fast and 6 h later. There was no significant difference in imTG concentrations between the two biopsies. The inter- vs. intra-individual differences in imTG concentrations was assessed by calculating the absolute difference between the value from the first biopsy and the mean from both biopsies as a per cent and relating this to the range of observed values. The first biopsy imTG concentration averaged 21 ± 15% (mean ±s.d.) different from the mean of the two biopsies. The range of observed values was 0.22–5.40 μmol g−1, a 24.5-fold range of values. Intramyocellular TG concentrations were greater in women than men (2.75 ± 1.22 vs. 1.78 ± 1.58 μmol g−1, P= 0.01). There was no significant difference between morning and afternoon intramyocellular concentrations of palmitoyl-carnitine or oleyl-carnitine. The inter- vs. intra-individual differences in LCAC concentrations was assessed using the same approach as for imTG concentrations. The first biopsy palmitoyl-carnitine and oleyl-carnitine concentrations averaged 13 ± 12% (mean ±s.d.) different from the mean of the two biopsies. The range of observed values for palmitoyl-carnitine and oleyl-carnitine concentrations was 0.02–0.15 and 0.08–0.67 μmol g−1, a 6.1- and 8.8-fold range of values, respectively. The combined biological and methodological variability was also examined by assessing the correlation between the values from the first and second biopsy. The morning and afternoon imTG, palmitoyl-carnitine and oleyl-carnitine concentrations were all highly correlated (r= 0.74, 0.57 and 0.64, all P < 0.00001). Palmitoyl-carnitine and oleyl-carnitine concentrations were not correlated with fatty acid oxidation rates as measured by indirect calorimetry.
Intramyocellular TG concentrations have been reported to be greater in fit than unfit normal weight individuals (Kiens et al. 1993) and greater in untrained obese than untrained non-obese women (Phillips et al. 1996). Similarly in our population, imTG showed an increasing trend as a function of peak  in non-obese men and women (r= 0.41, P= 0.06 for women and men combined). There was a strong correlation (r= 0.77, P= 0.0003) between abdominal subcutaneous fat area by CT and imTG concentrations in untrained women. If trained, lean women with greater imTG concentrations were included, the correlation was reduced, but remained significant (r= 0.54, P= 0.003). There was no significant association between visceral fat area and imTG concentrations in women and no correlation between visceral or abdominal subcutaneous fat area and imTG concentrations in men.
Plasma NEFA concentrations and imLCAC concentrations (the sum of palmitoyl-carnitine and oleyl-carnitine) were not associated. We found a significant correlation between imTG concentrations and imLCAC concentrations in women (r= 0.51, P= 0.005), but not men (r= 0.30, P= 0.11). For all subjects, plasma palmitate enrichment and imNEFA-palmitate enrichment were significantly correlated (r= .34, P < 0.01); however, palmitate enrichment was not associated with im-palmitoyl-carnitine enrichment (r= .003, P= NS).
Plasma NEFA vs. intramyocellular fatty acid enrichments
The plasma palmitate enrichment at the time of the morning muscle biopsy was ∼15-fold greater than enrichment in imTG palmitate, palmitoyl-carnitine and imNEFA palmitate (Table 2). The [U-13C]oleate infusion was initiated 30 min prior to the morning blood sampling interval and thus plasma oleate enrichment was at steady state over the 30 min of sampling, following which the muscle biopsy was performed. A detectable amount of [U-13C]oleate was found in imTG oleate and imNEFA oleate following 1 h of tracer infusion; however, the imNEFA oleate enrichment was not greater than the imTG oleate enrichment at the time of the first biopsy. This suggests that very little, if any, NEFA oleate (enrichment 19 times greater than intracellular pools) entered the imNEFA pool before entering the imTG pool. The enrichment in oleyl-carnitine averaged one-third of that in the imTG and imNEFA pool, suggesting a delay in the trafficking of plasma NEFA to the imLCAC pool relative to the imTG and imNEFA pools.
The associations between the enrichments in imTG palmitate, imNEFA and palmitoyl-carnitine are depicted in Fig. 2. Using the data from all subjects, there were significant correlations between imTG palmitate and imNEFA palmitate enrichments (r = 0.56, P < 0.0001, panel A), between imNEFA and palmitoyl-carnitine enrichments (r= 0.45, P= 0.001, panel B) and between imTG palmitate and palmitoyl-carnitine enrichments (r= 0.30, P= 0.02, panel C).
Figure 2. Relationship between palmitate enrichments of intramyocellular fatty acid pools.

A, relationship between intramyocellular triglyceride (imTG) palmitate enrichment (MPE) and intramyocellular non-esterified fatty acid (imNEFA) palmitate enrichment for all participants. B, relationship between imNEFA palmitate MPE and intramyocellular palmitoyl-carnitine (PC) MPE for all participants. C, relationship between imTG palmitate MPE and PC MPE for all participants.
At the time of the second muscle biopsy the enrichments in imTG oleate, oleyl-carnitine and imNEFA oleate had all increased significantly relative to the morning biopsy (P < 0.01; Table 2). Intramuscular TG palmitate enrichment, palmitoyl-carnitine enrichment, and imNEFA palmitate enrichment did not change significantly from morning values despite the discontinuation of the [U-13C]palmitate infusion 6 h earlier.
Storage of plasma NEFA in imTG
The rate accumulation of [U-13C]palmitate in imTG over the 6 h infusion was used to calculate the rate of NEFA palmitate storage in imTG. Using the data from the first biopsy, we found the storage rate of plasma NEFA palmitate in imTG averaged 0.030 ± 0.018 and 0.017 ± 0.022 μmol (g muscle)−1 h−1 in women and men, respectively (P= 0.02, women vs. men). As expected, because oleate concentrations and flux are ∼50% greater than palmitate concentrations and flux, the storage of plasma NEFA oleate calculated from the second biopsy was greater than the storage of NEFA palmitate from the first biopsy. Oleate storage averaged 0.049 ± 0.029 and 0.035 ± 0.035 μmol (g muscle)−1 h−1 (P= 0.10, women vs. men). The palmitate and oleate storage rates within individuals were in good agreement with each other, however (r= 0.72, P < 0.00001).
When extrapolated from quadriceps to total body muscle using the palmitate data, we calculated that 11 ± 6% and 10 ± 9% of systemic NEFA are trafficked to imTG in women and men, respectively. Similar results were obtained using the oleate tracer and the second biopsy.
In women, the per cent of NEFA stored in imTG was correlated with fasting plasma NEFA concentrations (Fig. 3, left panel, r= 0.52, P= 0.004). In contrast, there was no association between these two variables in men (Fig. 3, right panel). For men, fitness, as measured by peak  , was associated with the percentage of NEFA stored in imTG (Fig. 4, left panel, r= 0.45, P= 0.02), whereas there was no such relationship for women (Fig. 4, right panel).
Figure 3. Relationship between plasma free fatty acid (NEFA) concentrations and the % of NEFA calculated to be stored in skeletal muscle in women (left panel) and men (right panel).

There was no significant relationship in men.
Figure 4. Relationship between aerobic fitness as measured by peak  and the % of NEFA calculated to be stored in skeletal muscle in men (left panel) and women (right panel).

There was no significant relationship in women.
Shorter chain acyl-carnitines
We analysed 82 muscle samples from 41 studies to test for enrichment in M+14 myristoyl-carnitine, reasoning that incomplete oxidation products from [U-13C]palmitoyl-carnitine would include [U-13C]myristoyl-carnitine. We found the muscle myristoyl-carnitine content to be ∼2 orders of magnitude less that palmitoyl-carnitine. Only 3 of the 82 samples were found to have detectable enrichments in M+14 myristoyl-carnitine, which averaged 64% of the enrichment in the M+16 palmitoyl-carnitine in the same sample. Thus, this indicates that negligible amount of incomplete oxidation products are generated in muscle, in vivo.
Discussion
We studied the relationship between plasma NEFA and intramyocellular fatty acid metabolites in lean and obese men and women using stable isotopic tracers and newly developed mass spectrometry approaches. The enrichment of imLCAC reflected imTG fatty acid enrichment rather than plasma NEFA enrichment. In addition, imLCAC concentrations in women were correlated with imTG, but not with plasma NEFA concentrations. Together, these findings strongly suggest that in resting muscle imTG is the source of imLCAC, the obligate precursors for muscle fatty acid oxidation (Fig. 5). Knowing this emphasizes the need for a better understanding of the factors that relate to NEFA storage in imTG. Furthermore, plasma NEFA concentrations and aerobic fitness are two factors that are associated with NEFA storage and our data suggest that their relationship to imTG is different between men and women.
Figure 5. Proposed trafficking of plasma NEFA in skeletal muscle.

The observed isotopic enrichment ratio of 15 : 1 between plasma non-esterified fatty acids (NEFA) and intramyocellular fatty acid pools – intramyocellular triglyceride (imTG) and long-chain acyl-carnitines (LCAC) – suggests that once inside the cell, plasma NEFA probably are shunted into complex lipid synthesis, including imTG, which then equilibrates with the NEFA pool. This pool appears to be both the recipient of fatty acids from the hydrolysis of complex lipids, such as imTG, and may be a precursor pool for DG and TG synthesis. The hydrolysis of imTG (lipolysis) releases long-chain fatty acids that can enter the NEFA pool and/or be esterified to long-chain acyl-CoA and LCAC. LCAC are committed to enter the mitochondria for β-oxidation. These observations suggest that imTG is a central intracellular pool that plays a central role in regulating plasma NEFA trafficking and utilization by skeletal muscle.
Previous investigations have shown that imTG concentrations are greater in women than men (Steffensen et al. 2002); (Roepstorff et al. 2006), that imTG are increased with aerobic fitness (Kiens et al. 1993) and that waist circumference is positively correlated with imTG in women (Phillips et al. 1996). Our findings are consistent with each of these observations. Likewise, the intramyocellular long-chain acylcarnitine concentrations we found are consistent with those reported by Sidossis et al. (1996). Taking into account differences in baseline imTG concentrations and in the means of data presentation (using wet weight vs. dry weight of muscle), our rates of NEFA storage into imTG are in keeping with those of Sacchetti et al. (2002) found in six resting men. Our findings were also internally consistent; plasma NEFA storage rates into imTG using either palmitate or oleate tracer and using a morning vs. afternoon muscle biopsy were well correlated. Thus, we believe our findings provide solid data regarding the intramyocellular trafficking of plasma NEFA.
This appears to be the first report linking imLCAC concentrations with imTG, not plasma NEFA concentrations. This correlation alone does not prove that imTG is the precursor pool for LCAC in resting muscle. However, the finding that the palmitoyl-carnitine and oleyl-carnitine enrichment were equal to imTG palmitate and oleate enrichments, and ∼1/15 of plasma NEFA palmitate and oleate enrichment, essentially excludes a significant role for plasma NEFA as direct precursors for muscle fatty acid oxidation in resting humans. Although this model of muscle fatty acid trafficking was proposed over 30 years ago (Dagenais et al. 1976), this concept has not been employed in interpreting physiological studies of muscle fatty acid metabolism recently (Sidossis et al. 1996; Sacchetti et al. 2002, 2004). Measurement of imLCAC enrichment vs. plasma NEFA enrichment have been made in rabbits receiving intravenous infusions of stable isotopically labelled palmitate (Sun et al. 2006). The authors interpreted their data as indicating that ∼44% of imLCAC derive directly from plasma NEFA (Sun et al. 2006); however, the enrichment in imTG was not measured, making it difficult to exclude a more important role of imTG in this animal model. During the infusion of isotopically labelled NEFA tracer labelled CO2 is released into femoral venous blood in resting humans (Sidossis et al. 1996; Sacchetti et al. 2002, 2004). Although this was interpreted as evidence for direct NEFA oxidation, our data suggest rather that the tracer is incorporated into imTG pools and subsequently those fatty acids enter the oxidative pathway. This does not exclude an important role for a direct trafficking of plasma NEFA into imLCAC during exercise (Sacchetti et al. 2002).
If substantial portions of NEFA taken up by resting muscle were directly oxidized it would be difficult to relate muscle NEFA uptake to the synthesis of imTG and other intramyocellular complex lipids. Understanding now that NEFA must traverse these pools in resting humans in order to enter the oxidative pathway clarifies the interpretation of muscle NEFA uptake data. We (Burguera et al. 2000; Guo et al. 2000; Nielsen et al. 2004) and others (Kelley & Simoneau, 1994; Sidossis et al. 1996; Kelley et al. 1999; Sacchetti et al. 2002, 2004) have used leg uptake of NEFA as a measure of muscle NEFA uptake. However, the finding that adipose tissue (Shadid et al. 2007; Koutsari et al. 2008) can store NEFA directly, even in the postabsorptive state, means that leg arterial–venous (A–V) balance data is not a specific measure of muscle fatty acid metabolism. The combination of A–V balance and muscle biopsies should provide clearer information on how muscle handles NEFA (Guo et al. 2000; Sacchetti et al. 2002).
We estimated that 10–13% of systemic NEFA are esterified in resting imTG for whole body skeletal muscle. Given that imTG concentrations were stable over the 6 h between biopsies, it is reasonable to assume that entry of fatty acids into imTG was offset by the irreversible exit of an equal amount of fatty acids, perhaps largely to oxidation. This 10–13% of NEFA flux equates to muscle fatty acid oxidation of ∼47 μmol min−1 (∼0.11 kcal min−1), or 20% of whole body fatty acid oxidation in our volunteers. Another approach to estimating the contribution of muscle fatty acid oxidation to whole body metabolism in vivo is to use limb balance data. Muscle accounts for 25% of resting energy expenditure (Jensen et al. 1995a) and the respiratory quotient (RQ) of leg tissue in the overnight postabsorptive state is reported to be 0.85–0.90 (Kelley et al. 1999). Combined, these two observations (Jensen et al. 1995a; Kelley et al. 1999) also suggest that skeletal muscle accounts for ∼20% of resting, whole body fatty acid oxidation in humans.
Our finding that NEFA storage into imTG correlates with measures of aerobic fitness in men, but with NEFA concentrations in women is another example of the large number of sex differences in human muscle metabolism (Steffensen et al. 2002; Kiens et al. 2004; Roepstorff et al. 2006). Kiens et al. (2004) found that the CD36 content of muscle was greater in women than men, irrespective of training status, whereas muscle FABPpm protein increased as a function of training only in men. If facilitated transport is the rate-limiting step for muscle fatty acid uptake, Kiens et al. (2004) found that the fatty acid translocase (FAT, also known as CD36) content of muscle in women allows greater inward transport as plasma NEFA concentrations increase. Whereas fatty acid binding protein-plasma membrane (FABP-PM) in men may indicate that transport mediated by this protein is not limited by extracellular NEFA concentrations.
Muscle mitochondria and their associated triglycerides appear to behave differently in the subsarcolemma and intramyofibrillar regions (Koves et al. 2005; Shaw et al. 2008). In this study we did not separate these two fractions and thus provide whole muscle average values for imTG and imLCAC concentrations and enrichment. Developing methods to measure the fatty acid trafficking within each of these sub-pools of mitochondria/lipids may provide even greater insights into muscle and metabolism. Unfortunately, we were not able to assay fatty acid transport proteins in our muscle samples to confirm the association reported by Kiens et al. (2004). Future studies may be able to link direct measures of muscle fatty acid storage with measures of the key steps in the relevant pathways to better understand the rate-limiting steps.
In summary, our findings directly and definitively demonstrate that the model proposed by Dagenais et al. (1976) is correct – plasma NEFA do not contribute to muscle fatty acid oxidation under resting conditions without being diluted into large, intracellular pools – presumably imTG. In addition, we found that the factors relating to plasma NEFA storage into imTG appear to be different between men and women. To the extent that imTG provide fatty acids for oxidation and signalling molecules, our findings provide important clues to the understanding of imTG synthesis. These findings are directly relevant to the question as to whether interventions that target plasma NEFA or imTG are more likely to result in desired changes in muscle oxidative metabolism and, perhaps, other fatty acid-containing compounds.
Acknowledgments
We would like to thank Barbara Norby, Darlene Lucas, Mai Perrson and Lianzhen Zhou for technical support and Monica Davis for editorial support. This work is supported by grants DK40484, DK50456 and RR00585 from the US Public Health Service and by the Mayo Foundation. S.S. was partly sponsored by NOVO/NORDISK.
Glossary
Abbreviations
- ACS
acyl-CoA synthase
- ATGL
adipose triglyceride lipase
- CPT-1
carnitine palmitoyltransferase
- DG
diglycerides
- DGAT
diglyceride acyltransferase
- FFA
free fatty acid
- FFM
fat free mass
- HSL
hormone sensitive lipase
- im
intramyocellular
- LCAC
long-chain acylcarnitines
- LC-ACoA
long-chain acyl CoA
- LPA
lyso-phosphatidic acid
- MG
monoglycerides
- MPE
mole percent excess
- NEFA
non-esterfied fatty acids
- PA
phosphatidic acid
- TG
triglyceride
- TL
translocase
Author contributions
J.A.K.: design and conducting the study, analysis and interpretation of data, drafting the article, final approval of the published version. S.S.: design and conducting the study, analysis and interpretation of data, drafting the article, final approval of the published version. M.T.S.: conducting the study, analysis and interpretation of data, drafting the article, final approval of the published version. ZKG.: analysis and interpretation of data, drafting the article, final approval of the published version. M.D.J.: conception and design of the study, analysis and interpretation of data, drafting the article, final approval of the version to be published.
Authors' present addresses
Samyah Shadid: VieCuri Medical Center, Venlo, The Netherlands. Jill Kanaley: Department of Nutrition and Exercise Physiology, University of Missouri, Columbia, MO, USA. Michael Sheehan: Department of Endocrinology, Marshfield Clinic – Weston Center, Weston, WI 54476, USA.
References
- Boden G, Lebed B, Schatz M, Homko C, Lemieux S. Effects of acute changes of plasma free fatty acids on intramyocellular fat content and insulin resistance in healthy subjects. Diabetes. 2001;50:1612–1617. doi: 10.2337/diabetes.50.7.1612. [DOI] [PubMed] [Google Scholar]
- Burguera B, Proctor DN, Dietz W, Guo Z, Joyner MJ, Jensen MD. Leg FFA kinetics during exercise in men and women. Am J Physiol Endocrinol Metab. 2000;278:E113–E117. doi: 10.1152/ajpendo.2000.278.1.E113. [DOI] [PubMed] [Google Scholar]
- Chen KS, Heydrick S, Kurowski T, Ruderman NB. Diacylglycerol-protein kinase C signalling in skeletal muscle: a possible link to insulin resistance. Trans Assoc Am Physicians. 1991;104:206–212. [PubMed] [Google Scholar]
- Christie WW. Rapid separation and quantification of lipid classes by high pressure liquid chromatography and mass detection. J Lipid Res. 1985;26:507–512. [PubMed] [Google Scholar]
- Colberg S, Simoneau JA, Thaete F, Kelley DE. Skeletal muscle utilization of free fatty acids in women with visceral obesity. J Clin Invest. 1995;95:1846–1853. doi: 10.1172/JCI117864. [DOI] [PMC free article] [PubMed] [Google Scholar]
- Dagenais GR, Tancredi RG, Zierler KL. Free fatty acid oxidation by forearm muscle at rest, and evidence for an intramuscular lipid pool in the human forearm. J Clin Invest. 1976;58:421–431. doi: 10.1172/JCI108486. [DOI] [PMC free article] [PubMed] [Google Scholar]
- Doan AE, Peterson DR, Blackmon JR, Bruce RA. Myocardial ischemia after maximal exercise in healthy men. Am Heart J. 1965;69:11–25. doi: 10.1016/0002-8703(65)90211-5. [DOI] [PubMed] [Google Scholar]
- Ellis BA, Poynten A, Lowy AJ, Furler SM, Chisholm DJ, Kraegen EW, Cooney GJ. Long-chain acyl-CoA esters as indicators of lipid metabolism and insulin sensitivity in rat and human muscle. Am J Physiol Endocrinol Metab. 2000;279:E554–E560. doi: 10.1152/ajpendo.2000.279.3.E554. [DOI] [PubMed] [Google Scholar]
- Folch J, Lees M, Sloane Stanley GH. A simple method for the isolation and purification of total lipids from animal tissues. J Biol Chem. 1957;226:497–509. [PubMed] [Google Scholar]
- Frayn KN. Calculation of substrate oxidation rates in vivo from gaseous exchange. J Appl Physiol. 1983;55:628–634. doi: 10.1152/jappl.1983.55.2.628. [DOI] [PubMed] [Google Scholar]
- Goodpaster BH, Theriault R, Watkins SC, Kelley DE. Intramuscular lipid content is increased in obesity and decreased by weight loss. Metabolism. 2000;49:467–472. doi: 10.1016/s0026-0495(00)80010-4. [DOI] [PubMed] [Google Scholar]
- Guo Z, Burguera B, Jensen MD. Kinetics of intramuscular triglyceride fatty acids in exercising humans. J Appl Physiol. 2000;89:2057–2064. doi: 10.1152/jappl.2000.89.5.2057. [DOI] [PubMed] [Google Scholar]
- Guo Z, Jensen MD. Intramuscular fatty acid metabolism evaluated with stable isotopic tracers. J Appl Physiol. 1998;84:1674–1679. doi: 10.1152/jappl.1998.84.5.1674. [DOI] [PubMed] [Google Scholar]
- Guo Z, Mishra P, Macura S. Sampling the intramyocellular triglycerides from skeletal muscle. J Lipid Res. 2001;42:1041–1048. [PubMed] [Google Scholar]
- Guo Z, Nielsen S, Burguera B, Jensen MD. Free fatty acid turnover measured using ultralow doses of [U-13C]palmitate. J Lipid Res. 1997;38:1888–1895. [PubMed] [Google Scholar]
- Guo ZK, Yarasheski K, Jensen MD. High-precision isotopic analysis of palmitoylcarnitine by liquid chromatography/electrospray ionization ion-trap tandem mass spectrometry. Rapid Commun Mass Spectrom. 2006;20:3361–3366. doi: 10.1002/rcm.2753. [DOI] [PubMed] [Google Scholar]
- Humphreys SM, Fisher RM, Frayn KN. Micromethod for measurement of sub-nanomole amounts of triacylglycerol. Ann Clin Biochem. 1990;27:597–598. doi: 10.1177/000456329002700613. [DOI] [PubMed] [Google Scholar]
- Jacob S, Machann J, Rett K, Brechtel K, Volk A, Enn W, Aerker E, Atthaei S, Chick F, Laussen CD, Aring HU. Association of increased intramyocellular lipid content with insulin resistance in lean nondiabetic offspring of type 2 diabetic subjects. Diabetes. 1999;48:1113–1119. doi: 10.2337/diabetes.48.5.1113. [DOI] [PubMed] [Google Scholar]
- Jensen MD, Heiling V, Miles JM. Measurement of non-steady-state free fatty acid turnover. Am J Physiol Endocrinol Metab. 1990;258:E103–E108. doi: 10.1152/ajpendo.1990.258.1.E103. [DOI] [PubMed] [Google Scholar]
- Jensen MD, Johnson CM, Cryer PE, Murray MJ. Thermogenesis after a mixed meal: role of leg and splanchnic tissues in men and women. Am J Physiol Endocrinol Metab. 1995a;268:E433–E438. doi: 10.1152/ajpendo.1995.268.3.E433. [DOI] [PubMed] [Google Scholar]
- Jensen MD, Kanaley JA, Reed JE, Sheedy PF. Measurement of abdominal and visceral fat with computed tomography and dual-energy x-ray absorptiometry. Am J Clin Nutr. 1995b;61:274–278. doi: 10.1093/ajcn/61.2.274. [DOI] [PubMed] [Google Scholar]
- Jensen MD, Rogers PJ, Ellman MG, Miles JM. Choice of infusion-sampling mode for tracer studies of free fatty acid metabolism. Am J Physiol Endocrinol Metab. 1988;254:E562–E565. doi: 10.1152/ajpendo.1988.254.5.E562. [DOI] [PubMed] [Google Scholar]
- Kelley DE, Goodpaster B, Wing RR, Simoneau JA. Skeletal muscle fatty acid metabolism in association with insulin resistance, obesity, and weight loss. Am J Physiol Endocrinol Metab. 1999;277:E1130–E1141. doi: 10.1152/ajpendo.1999.277.6.E1130. [DOI] [PubMed] [Google Scholar]
- Kelley DE, Mandarino LJ. Fuel selection in human skeletal muscle in insulin resistance: a reexamination. Diabetes. 2000;49:677–683. doi: 10.2337/diabetes.49.5.677. [DOI] [PubMed] [Google Scholar]
- Kelley DE, Simoneau JA. Impaired free fatty acid utilization by skeletal muscle in non-insulin-dependent Diabetes mellitus. J Clin Invest. 1994;94:2349–2356. doi: 10.1172/JCI117600. [DOI] [PMC free article] [PubMed] [Google Scholar]
- Kiens B, Essen-Gustavsson B, Christensen NJ, Saltin B. Skeletal muscle substrate utilization during submaximal exercise in man: effect of endurance training. J Physiol. 1993;469:459–478. doi: 10.1113/jphysiol.1993.sp019823. [DOI] [PMC free article] [PubMed] [Google Scholar]
- Kiens B, Roepstorff C, Glatz JFC, Bonen A, Schjerling P, Knudsen J, Nielsen JN. Lipid-binding proteins and lipoprotein lipase activity in human skeletal muscle: influence of physical activity and gender. J Appl Physiol. 2004;97:1209–1218. doi: 10.1152/japplphysiol.01278.2003. [DOI] [PubMed] [Google Scholar]
- Koutsari C, Dumesic DA, Patterson BW, Votruba SB, Jensen MD. Plasma free fatty acid storage in subcutaneous and visceral adipose tissue in postabsorptive women. Diabetes. 2008;57:1186–1194. doi: 10.2337/db07-0664. [DOI] [PubMed] [Google Scholar]
- Koves TR, Noland RC, Bates AL, Henes ST, Muoio DM, Cortright RN. Subsarcolemmal and intermyofibrillar mitocondria play distinct roles in regulating skeletal muscle fatty acid metabolism. Am J Physiol Cell Physiol. 2005;288:C1074–C1082. doi: 10.1152/ajpcell.00391.2004. [DOI] [PubMed] [Google Scholar]
- Miles JM, Ellman MG, McClean KL, Jensen MD. Validation of a new method for determination of free fatty acid turnover. Am J Physiol Endocrinol Metab. 1987;252:E431–E438. doi: 10.1152/ajpendo.1987.252.3.E431. [DOI] [PubMed] [Google Scholar]
- Nielsen S, Guo ZK, Johnson CM, Hensrud DD, Jensen MD. Splanchnic lipolysis in human obesity. J Clin Invest. 2004;113:1582–1588. doi: 10.1172/JCI21047. [DOI] [PMC free article] [PubMed] [Google Scholar]
- Pan DA, Lillioja S, Kriketos AD, Milner MR, Baur LA, Bogardus C, Jenkins AB, Storlien LH. Skeletal muscle triglyceride levels are inversely related to insulin action. Diabetes. 1997;46:983–988. doi: 10.2337/diab.46.6.983. [DOI] [PubMed] [Google Scholar]
- Phillips DIW, Caddy S, Ilic V, Fielding BA, Frayn KN, Borthwick AC, Taylor R. Intramuscular triglyceride and muscle insulin sensitivity: evidence for a relationship in nondiabetic subjects. Metabolism. 1996;45:947–950. doi: 10.1016/s0026-0495(96)90260-7. [DOI] [PubMed] [Google Scholar]
- Randle PJ, Garland PB, Hales CN, Newsholme EA. The glucose-fatty acid cycle. Its role in insulin sensitivity and the metabolic disturbances of diabetes mellitus. Lancet. 1963;1:785–789. doi: 10.1016/s0140-6736(63)91500-9. [DOI] [PubMed] [Google Scholar]
- Rasmussen BB, Holmbäck UC, Volpi E, Morio-Liondore B, Paddon-Jones D, Wolfe RR. Malonyl coenzyme A and the regulation of functional carnitine palmitoyltransferase-1 activity and fat oxidation in human skeletal muscle. J Clin Invest. 2002;110:1687–1693. doi: 10.1172/JCI15715. [DOI] [PMC free article] [PubMed] [Google Scholar]
- Roepstorff C, Donsmark M, Thiele M, Vistisen B, Stewart G, Vissing K, Schjerling P, Hardie DG, Galbo H, Kiens B. Sex differences in hormone-sensitive lipase expression, activity, and phosphorylation in skeletal muscle at rest and during exercise. Am J Physiol Endocrinol Metab. 2006;291:E1106–E1114+. doi: 10.1152/ajpendo.00097.2006. [DOI] [PubMed] [Google Scholar]
- Sacchetti M, Saltin B, Olsen DB, van Hall G. High triacylglycerol turnover rate in human skeletal muscle. J Physiol. 2004;561:883–891. doi: 10.1113/jphysiol.2004.075135. [DOI] [PMC free article] [PubMed] [Google Scholar]
- Sacchetti M, Saltin B, Osada T, van Hall G. Intramuscular fatty acid metabolism in contracting and non-contracting human skeletal muscle. J Physiol. 2002;540:387–395. doi: 10.1113/jphysiol.2001.013912. [DOI] [PMC free article] [PubMed] [Google Scholar]
- Shadid S, Koutsari C, Jensen MD. Direct free fatty acid uptake into human adipocytes in vivo: relation to body fat distribution. Diabetes. 2007;56:1369–1375. doi: 10.2337/db06-1680. [DOI] [PubMed] [Google Scholar]
- Shaw CS, Jones DA, Wagenmakers AJ. Network distribution of mitochondria and lipid droplets in human muscle fibres. Histochem Cell Biol. 2008;129:65–72. doi: 10.1007/s00418-007-0349-8. [DOI] [PubMed] [Google Scholar]
- Sidossis LS, Stuart CA, Shulman GI, Lopaschuk GD, Wolfe RR. Glucose plus insulin regulate fat oxidation by controlling the rate of fatty acid entry into the mitochondria. J Clin Invest. 1996;98:2244–2250. doi: 10.1172/JCI119034. [DOI] [PMC free article] [PubMed] [Google Scholar]
- Spriet LL, Heigenhauser GJF, Jones NL. Endogenous triacylglycerol utilization by rat skeletal muscle during tetanic stimulation. J Appl Physiol. 1986;60:410–415. doi: 10.1152/jappl.1986.60.2.410. [DOI] [PubMed] [Google Scholar]
- Steffensen CH, Roepstorff C, Madsen M, Kiens B. Myocellular triacylglycerol breakdown in females but not in males during exercise. Am J Physiol Endocrinol Metab. 2002;282:E634–E642. doi: 10.1152/ajpendo.00078.2001. [DOI] [PubMed] [Google Scholar]
- Stratford S, Hoehn KL, Liu F, Summers SA. Regulation of insulin action by ceramide: dual mechanisms linking ceramide accumulation to the inhibition of Akt/protein kinase B. J Biol Chem. 2004;279:36608–36615. doi: 10.1074/jbc.M406499200. [DOI] [PubMed] [Google Scholar]
- Sun D, Cree MG, Zhang XJ, Boersheim E, Wolfe RR. Measurement of stable isotopic enrichment and concentration of long-chain fatty acyl-carnitines in tissue by HPLC-MS. J Lipid Res. 2006;47:431–439. doi: 10.1194/jlr.D500026-JLR200. [DOI] [PubMed] [Google Scholar]
- Wang Z, Gallagher D, Nelson ME, Matthews DE, Heymsfield SB. Total-body skeletal muscle mass: evaluation of 24-h urinary creatinine excretion by computerized axial tomography. Am J Clin Nutr. 1996;63:863–869. doi: 10.1093/ajcn/63.6.863. [DOI] [PubMed] [Google Scholar]
- Wang Z, Heo M, Lee RC, Kotler DP, Withers RT, Heymsfield SB. Muscularity in adult humans: proportion of adipose tissue-free body mass as skeletal muscle. Am J Hum Biol. 2001;13:612–619. doi: 10.1002/ajhb.1099. [DOI] [PubMed] [Google Scholar]