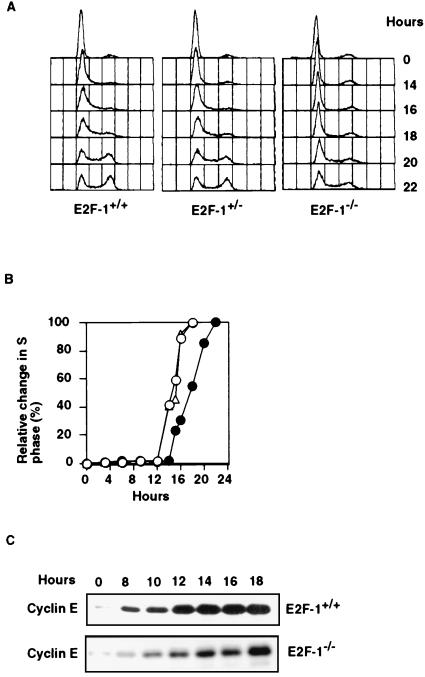
Figure 1.
Cell cycle kinetics of E2F-1 MEFs. (A) Cell cycle profiles of serum-starved E2F-1+/+, E2F-1+/−, and E2F-1−/− MEFs at indicated times after readdition of serum. (B) Relative increases in S phase E2F-1+/+ (○), E2F-1+/− (Δ), and E2F-1−/− (•) MEFs. (C) Western blot analysis of cyclin E in serum-starved E2F-1+/+ and E2F-1−/− MEFs at various times after serum stimulation.

