Abstract
MicroRNAs are small, non-protein coding RNA molecules known to regulate the expression of genes by binding to the 3′UTR region of mRNAs. MicroRNAs are produced from longer transcripts which can code for more than one mature miRNAs. miRGen 2.0 is a database that aims to provide comprehensive information about the position of human and mouse microRNA coding transcripts and their regulation by transcription factors, including a unique compilation of both predicted and experimentally supported data. Expression profiles of microRNAs in several tissues and cell lines, single nucleotide polymorphism locations, microRNA target prediction on protein coding genes and mapping of miRNA targets of co-regulated miRNAs on biological pathways are also integrated into the database and user interface. The miRGen database will be continuously maintained and freely available at http://www.microrna.gr/mirgen/.
INTRODUCTION
MicroRNAs (miRNAs) are single-stranded non-coding RNA molecules of ∼21 nucleotides in length, that function as regulators of gene expression by binding to messenger RNA (mRNA) molecules and destabilizing them or inhibiting their translation. They are found to be implicated in a wide range of physiological molecular processes, and their deregulation leads to diverse diseases (1–3).
MiRNAs are located in intergenic regions or in the introns of protein coding genes. They are transcribed by RNA Polymerase II as independent transcripts or as part of the transcript of a host gene. Only a small group of miRNAs located inside ALU repetitive elements is transcribed by RNA Polymerase III. A miRNA transcript can host more than one miRNA and can be several thousand nucleotides long including introns.
A promoter region is located around the transcription start site (TSS) of a transcript and is regulated by proteins that bind to this region. Evidence thus far suggests that binding sites for transcription factors (TFs) are similarly distributed within the promoters of both protein coding genes and miRNA transcripts (4). MiRNA primary transcripts (pri-miRNA) are processed in the nucleus to form pre-miRNAs, ∼70-nucleotide stem–loop structures also called miRNA hairpins. These are later processed into mature miRNAs in the cytoplasm via interaction with the endonuclease Dicer, which also initiates the formation of the RNA-induced silencing complex (RISC). Since primary transcripts are short lived and present only inside the nucleus, it is hard to identify them with standard molecular techniques.
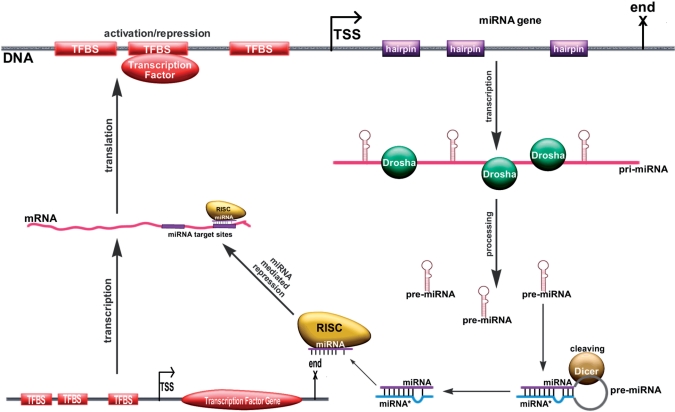
After the Dicer enzyme cleaves the pre-miRNA stem–loop, two complementary short RNA molecules are formed, but only one of them—the guiding strand—is predominantly integrated into the RISC complex. The remaining strand, known as the miRNA*, anti-guide or passenger strand, is usally degraded. However, the proportion of the integration of each strand varies with the miRNA species, with some miRNAs having almost equal abundance of each of the two strands incorporated into RISC. Another common nomenclature for complementary miRNA strands is the –3p and –5p naming convention—these names do not imply which miRNA is more commonly incorporated to the RISC complex. The miRNA–miRNA* and miRNA-3p–miRNA-5p nomenclatures are both widely used in the community, often to denote the same complementary miRNA pair. Mature miRNA molecules are bound by the RISC complex, are guided to specific motifs within the 3′UTR of protein coding mRNAs, and prevent these mRNAs from being translated into protein. The biogenesis of miRNAs and their regulation by TFs is diagrammed in Figure 1.
Figure 1.
A miRNA gene (top) is controlled by several TFs whose binding sites (TFBSs) are located near the TSS of this gene. When transcribed, the miRNA gene produces a long pri-miRNA molecule. The pri-miRNA molecule is cleaved by Drosha and yields the pre-miRNA stem-loop (hairpin) structure. The enzyme Dicer cleaves the loop part of the hairpin and produces the miRNA-miRNA* duplex. One chain of the miRNA duplex is incorporated into the RISC complex and can regulate mRNA translation by binding in a sequence specific manner to the 3′UTR region of mRNAs. In this example, the miRNA (produced after a TF binds to its promoter) regulates the translation of the promoter in a typical negative feedback control loop.
Single-nucleotide polymorphisms (SNPs) are DNA sequence positions at which a single nucleotide varies between individuals of the same species. SNPs are fairly common in mammalian genomes (the human genome contains ∼20 million SNP sites) and have been extensively linked to genetic abnormalities and disease (5).
In the previous version of the miRGen database (6), co-expressed miRNA clusters were identified based on their distance and genomic features surrounding them. With the availability of experimental data we were able, in miRGen 2.0, to mine prominent literature sources that identify miRNA primary transcripts in mammals (human and mouse genomes). Moreover, we have mapped TF binding sites (TFBSs) within the regions upstream of these miRNA primary transcript TSSs and incorporated expression profiles of miRNAs in several tissues, the mapping of SNPs within genomic locations of miRNA hairpins and the mapping of SNPs within the TFBSs found upstream of miRNA genes. The interplay of these different information sources concerning genomic features associated with miRNA genes and their expression levels can be used to study the function of miRNAs and their deregulation in disease. For instance, a user interested in a specific TF can find miRNA genes associated with this TF, find the expression levels of these miRNAs in a possible tissue of interest, possibly find some SNPs on the TFBSs or the miRNA locations on the genome that relate to a possible disease of interest and finally find predicted targets of the miRNAs associated with the TF of interest, and molecular pathways in which the targets of each of these miRNAs separately or together are implicated.
DATA GENERATION
miRNA coding transcripts
MiRNA transcripts in human and mouse were identified from four literature sources:
Corcoran et al. (7) used PolII immunoprecipitation data and ChIP–chip on lung epithelial cells to identify miRNA transcripts and their promoter regions.
Landgraf et al. (8) sequenced 250 small RNA libraries corresponding to 26 different organ systems and cell types of human and mouse, with ∼1000 miRNA clones per library and identified miRNA coding genes. In this study the whole transcripts of miRNA coding genes were identified, as well as protein coding genes that contain miRNAs.
Oszolak et al. (9) predicted the location of the proximal promoters of human miRNAs by combining nucleosome mapping with promoter chromatin signatures in MALME, HeLa and UACC62 cells. Although the TSS of miRNA genes was identified in this study, the end of the transcript was not provided. We have provided end of the last miRNA that is a member of a gene as an approximation of the transcript end.
Marson et al. (10) used ChIP-seq data to identify promoters of miRNA genes in embryonic stem cells. They identified promoters and co-regulated miRNAs, but the exact position of the TSS was not identified. For this reason we have used the start of the first miRNA of each cluster as the putative TSS. Additionally, coordinates provided by Marson et al. had to be lifted over using ‘UCSC lift over tool’ to the current genome build (hg18, mm9). In cases where putative rather than experimentally verified positions are used, they are denoted in the graphical interface as ‘computational TSS’.
In total, 812 human miRNA coding transcripts and 386 mouse miRNA coding transcripts were identified. Of them, 423 were shown in the corresponding papers to be associated with protein coding genes (intragenic miRNA transcripts). More than one of the above publications have usually identified transcripts corresponding to a miRNA. When this is the case, transcripts from all methods are returned to the user.
Since these studies were published, additional miRNAs have been identified. When novel miRNAs are located within the coordinates of clusters given by any of these publications, this miRNA is added to the cluster. For names that changed or were given differently than the current standard, manual curation with reference to mirBase (11) was used to identify and replace these names according to the current standard. For all the above reasons it is possible that the number of genes used in miRGen (Table 1) does not correspond perfectly to the number stated in the corresponding publications.
Table 1.
Number of miRNA coding genes and mature miRNAs identified in each of the experimental studies used to populate the miRGen database
TFBS identification
In order to determine putative TFBSs near the TSS of miRNA primary transcripts, we used the freely available tool MatchTM (12). MatchTM uses the public library of position weight matrices from Transfac 6.0—cite: TRANSFAC: an integrated system for gene expression regulation. We matched all vertebrate TF matrices to the regions spanning from 5 kb upstream of each TSS to 1 kb downstream of the TSS. As criterion for determining the cut-off values we chose the minimization of false positives in order to produce a strict set of predictions without too many falsely predicted TFBSs. Two scores are calculated for each putative TFBS. The matrix similarity score describes the quality of a match between a whole matrix and an arbitrary part of the input sequences. Analogously, the core similarity score denotes the quality of the match between the core sequence of a matrix (i.e. the five most conserved positions within a matrix) and a part of the input sequence.
miRNA expression profiles
miRNA expression profiles were identified from the mammalian miRNA expression atlas (8). Information for the expression profiles of 548 human and 451 mouse miRNAs over 172 human and 68 mouse small RNA libraries were derived from cell lines and tissues.
SNPs
SNPs located within the genomic positions of miRNA hairpins and corresponding TFBSs were downloaded from the UCSC table browser (13). For human, Polymorphism data from dbSnp database (14) or genotyping arrays SNP130 were used with 18 833 531 identified SNPs. For mouse, SNP128 was used with 14 893 502 identified SNPs.
Implementations
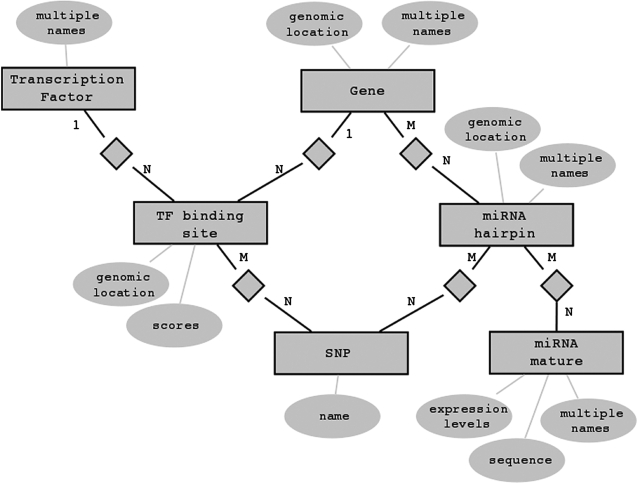
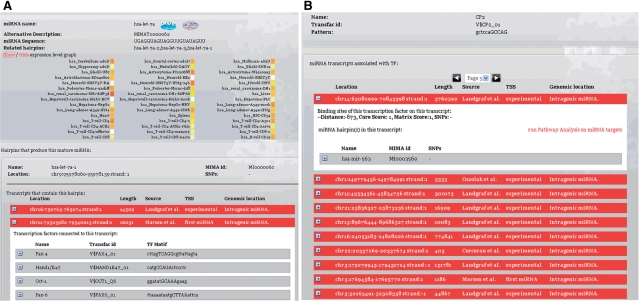
The miRGen repository has been implemented using relational database technology. All data are stored in a MySQL relational database management system. Figure 2 illustrates part of the entity-relationship model of our application. All results are available through a user-friendly interface that allows searches for miRNAs and for TFs of interest. For mature miRNAs, it is possible to view targets predicted by the program microT-ANN and for miRNAs found in the same transcript, the user can see a functional annotation of their targets on molecular pathways through the application DIANA-mirPath (15). Figure 3 shows an overview of the interface and highlights links to external databases—UCSC genome browser (13), iHop (16), dbSNP (14), mirBase (11).
Figure 2.
The miRGen database schema. TFs (top right) bind through TF binding sites to miRNA genes. miRNA genes (top) contain miRNA hairpins that signify the genomic location of the mature miRNA-miRNA* duplex. miRNA hairpins are processed into mature miRNAs. Usually, one miRNA hairpin produces two mature miRNAs, but a mature miRNA can be produced by more than one hairpin in different genomic locations. Both TFBSs and miRNA hairpins are genomic features that can contain SNPs. Mature miRNAs are associated with their expression levels in different tissues and cell types.
Figure 3.
The user is able to query the database either by miRNA name, or by the name of the TF of interest. When a miRNA search is performed (Figure 3a), all distinct locations on the genome (hairpins) that could code for this miRNA are returned, and the user can see details for any of the possible overlapping transcripts identified for each location, usually predicted by different papers. Each transcript tab contains information about TFBSs located from 5 kb upstream to 1 kb downstream of the transcript start. Additionally, information on the expression levels of the mature miRNA are displayed as a heat map. Searching for a TF of interest (Figure 3b) returns all miRNA coding genes for which at least one binding site for this TF is found. Information on the gene, the TFBSs, and the mature miRNAs coded for by the gene can be seen in tabs. All instances of TFBSs and miRNA hairpins are associated with corresponding SNPs mapping on their genomic locations. For all transcripts, the literature source of the gene is displayed, the identification of the TSS (experimental if the TSS was identified in the paper, computational if it was calculated by computational means and first miRNA if the start of the first miRNA serves as a substitute for an unknown TSS), and whether the gene is intragenic or is co-expressed with a protein-coding gene.
DISCUSSION
This version of miRGen is the first attempt to build a widely accessible and user-friendly database that connects TFs and miRNAs through putative and experimentally supported functional relationships. The connections identified in the database will further our understanding of the TF-mediated regulation of miRNA genes, and pave the way for the mapping of the interplay between TFs and miRNAs as regulatory molecules. The identification of SNPs on miRNA locations and their corresponding TFBSs, as well as the expression profiles of miRNAs can improve our insight into the involvement of miRNAs in developmental processes and disease.
Deregulation of TF-mediated gene expression has been shown to extensively affect protein coding genes, and lead to disease (17,18). MiRNA expression levels have also been shown to change significantly in different disease states (19,20). The availability of both these resources in the same database will allow researchers to identify regulatory elements, such as TFs that may affect the expression of miRNAs. For this reason, we believe miRGen 2.0 will be an important resource for researchers of diverse disciplines interested in miRNA regulation and function.
AVAILABILITY
The miRGen database will be continuously maintained and freely available at http://www.microrna.gr/mirgen/.
FUNDING
Aristeia Award from General Secretary Research and Technology, Greece. Funding for open access charge: The Aristeia Award from General Secretary Research and Technology, Greece.
Conflict of interest statement. None declared.
REFERENCES
- 1.Gartel AL, Kandel ES. miRNAs: little known mediators of oncogenesis. Semin. Cancer Biol. 2008;18:103–110. doi: 10.1016/j.semcancer.2008.01.008. [DOI] [PubMed] [Google Scholar]
- 2.Fabbri M, Croce CM, Calin GA. MicroRNAs in the ontogeny of leukemias and lymphomas. Leuk Lymphoma. 2009;50:160–170. doi: 10.1080/10428190802535114. [DOI] [PubMed] [Google Scholar]
- 3.Latronico MV, Catalucci D, Condorelli G. MicroRNA and cardiac pathologies. Physiol. Genomics. 2008;34:239–242. doi: 10.1152/physiolgenomics.90254.2008. [DOI] [PubMed] [Google Scholar]
- 4.Megraw M, Baev V, Rusinov V, Jensen ST, Kalantidis K, Hatzigeorgiou AG. MicroRNA promoter element discovery in Arabidopsis. RNA. 2006;12:1612–1619. doi: 10.1261/rna.130506. [DOI] [PMC free article] [PubMed] [Google Scholar]
- 5.Brookes AJ. The essence of SNPs. Gene. 1999;234:177–186. doi: 10.1016/s0378-1119(99)00219-x. [DOI] [PubMed] [Google Scholar]
- 6.Megraw M, Sethupathy P, Corda B, Hatzigeorgiou AG. miRGen: a database for the study of animal microRNA genomic organization and function. Nucleic Acids Res. 2007;35:D149–D155. doi: 10.1093/nar/gkl904. [DOI] [PMC free article] [PubMed] [Google Scholar]
- 7.Corcoran DL, Pandit KV, Gordon B, Bhattacharjee A, Kaminski N, Benos PV. Features of mammalian microRNA promoters emerge from polymerase II chromatin immunoprecipitation data. PLoS ONE. 2009;4:e5279. doi: 10.1371/journal.pone.0005279. [DOI] [PMC free article] [PubMed] [Google Scholar]
- 8.Landgraf P, Rusu M, Sheridan R, Sewer A, Iovino N, Aravin A, Pfeffer S, Rice A, Kamphorst AO, Landthaler M, et al. A mammalian microRNA expression atlas based on small RNA library sequencing. Cell. 2007;129:1401–1414. doi: 10.1016/j.cell.2007.04.040. [DOI] [PMC free article] [PubMed] [Google Scholar]
- 9.Ozsolak F, Poling LL, Wang Z, Liu H, Liu XS, Roeder RG, Zhang X, Song JS, Fisher DE. Chromatin structure analyses identify miRNA promoters. Genes Dev. 2008;22:3172–3183. doi: 10.1101/gad.1706508. [DOI] [PMC free article] [PubMed] [Google Scholar]
- 10.Marson A, Levine SS, Cole MF, Frampton GM, Brambrink T, Johnstone S, Guenther MG, Johnston WK, Wernig M, Newman J, et al. Connecting microRNA genes to the core transcriptional regulatory circuitry of embryonic stem cells. Cell. 2008;134:521–533. doi: 10.1016/j.cell.2008.07.020. [DOI] [PMC free article] [PubMed] [Google Scholar]
- 11.Griffiths-Jones S, Grocock RJ, van Dongen S, Bateman A, Enright AJ. miRBase: microRNA sequences, targets and gene nomenclature. Nucleic Acids Res. 2006;34:D140–D144. doi: 10.1093/nar/gkj112. [DOI] [PMC free article] [PubMed] [Google Scholar]
- 12.Kel AE, Gossling E, Reuter I, Cheremushkin E, Kel-Margoulis OV, Wingender E. MATCH: A tool for searching transcription factor binding sites in DNA sequences. Nucleic Acids Res. 2003;31:3576–3579. doi: 10.1093/nar/gkg585. [DOI] [PMC free article] [PubMed] [Google Scholar]
- 13.Karolchik D, Hinrichs AS, Kent WJ. The UCSC Genome Browser. Curr. Protoc. Bioinformatics. 2007 doi: 10.1002/0471250953.bi0104s17. Chapter 1, Unit 14. [DOI] [PubMed] [Google Scholar]
- 14.Smigielski EM, Sirotkin K, Ward M, Sherry ST. dbSNP: a database of single nucleotide polymorphisms. Nucleic Acids Res. 2000;28:352–355. doi: 10.1093/nar/28.1.352. [DOI] [PMC free article] [PubMed] [Google Scholar]
- 15.Papadopoulos GL, Alexiou P, Maragkakis M, Reczko M, Hatzigeorgiou AG. DIANA-mirPath: integrating human and mouse microRNAs in pathways. Bioinformatics. 2009;25:1991–1993. doi: 10.1093/bioinformatics/btp299. [DOI] [PubMed] [Google Scholar]
- 16.Fernandez JM, Hoffmann R, Valencia A. iHOP web services. Nucleic Acids Res. 2007;35:W21–W26. doi: 10.1093/nar/gkm298. [DOI] [PMC free article] [PubMed] [Google Scholar]
- 17.Karin M. Nuclear factor-kappaB in cancer development and progression. Nature. 2006;441:431–436. doi: 10.1038/nature04870. [DOI] [PubMed] [Google Scholar]
- 18.Maiese K, Chong ZZ, Shang YC, Hou J. Clever cancer strategies with FoxO transcription factors. Cell Cycle. 2008;7:3829–3839. doi: 10.4161/cc.7.24.7231. [DOI] [PMC free article] [PubMed] [Google Scholar]
- 19.Nikiforova MN, Chiosea SI, Nikiforov YE. MicroRNA expression profiles in thyroid tumors. Endocr. Pathol. 2009;20:85–91. doi: 10.1007/s12022-009-9069-z. [DOI] [PubMed] [Google Scholar]
- 20.Aslam MI, Taylor K, Pringle JH, Jameson JS. MicroRNAs are novel biomarkers of colorectal cancer. Br. J. Surg. 2009;96:702–710. doi: 10.1002/bjs.6628. [DOI] [PubMed] [Google Scholar]


