Abstract
BeetleBase (http://www.beetlebase.org) has been updated to provide more comprehensive genomic information for the red flour beetle Tribolium castaneum. The database contains genomic sequence scaffolds mapped to 10 linkage groups (genome assembly release Tcas_3.0), genetic linkage maps, the official gene set, Reference Sequences from NCBI (RefSeq), predicted gene models, ESTs and whole-genome tiling array data representing several developmental stages. The database was reconstructed using the upgraded Generic Model Organism Database (GMOD) modules. The genomic data is stored in a PostgreSQL relatational database using the Chado schema and visualized as tracks in GBrowse. The updated genetic map is visualized using the comparative genetic map viewer CMAP. To enhance the database search capabilities, the BLAST and BLAT search tools have been integrated with the GMOD tools. BeetleBase serves as a long-term repository for Tribolium genomic data, and is compatible with other model organism databases.
INTRODUCTION
The red flour beetle, Tribolium castaneum, is a sophisticated genetic model organism for studies of insect development and pest biology as well as comparative genomics (1,2). A burgeoning wealth of genomic information, including a whole genome shotgun (WGS) assembly of the genome sequence, has become available in recent years (2).
BeetleBase was developed to provide a centralized database to serve the growing needs of the Tribolium research community. The first version of BeetleBase (3) was based on genome release Tcas_1.0. The database provided access to unmapped scaffolds, Fgenesh predicted genes, genetic markers, BAC-end sequences and ESTs. The database was implemented using an early version of the Chado schema, GBrowse, and CMAP developed by the Generic Model Organism Database (GMOD) project (http://www.gmod.org/).
Additional data has become available since the initial release of BeetleBase, including updates to the genome assembly and annotation, necessitating updates to the BeetleBase schema and data content. Here we present an updated version of BeetleBase (http://www.beetlebase.org), implemented using recent versions of Generic Model Organism Database (GMOD) tools, and integrated with BLAST (4) and BLAT (5) alignment tools. Data content has been expanded to include the latest version of the genome assembly (Tcas_3.0), a comprehensive collection of gene sets including the first unified release of the Tribolium Official Gene Set (OGS), EST alignments to the genome, and whole-genome transcriptional information from DNA tiling array experiments. These updates will provide a valuable resource for the Tribolium community, and serve as a foundation for integration of future datasets.
DATA ACQUISITION
Genome sequence
The initial assembly of the Tribolium genome (Tcas_1.0) was composed of 1107 unmapped genomic sequence scaffolds. For the second version of the assembly (Tcas_2.0), 70% of the genome sequence was mapped to 10 linkage groups corresponding to nine autosomes and the X chromosome (2,6). Subsequently, an additional forty-two of the largest unmapped scaffolds have been integrated into the genetic linkage map, and used by the Baylor College of Medicine to create the third version of the assembly (Tcas_3.0). The Tribolium genome sequence is assembled into 9686 contigs of 156 Mb in combined length. When these are assembled into scaffolds containing captured gaps of estimated length, the genome assembly is ∼160 Mb. Scaffolds and contigs containing more than 90% of the sequenced genome have been assembled into 10 chromosome builds. The chromosome build statistics for Tcas_3.0 are summarized in Table 1. The GenBank accession numbers of the 9686 contigs that have been assembled into ten chromosome builds, 305 unmapped scaffolds and 1848 unmapped single contigs are AAJJ01000001–AAJJ01009708 (22 of which have been suppressed since their original submission), CM000276–CM000285 and DS497665–DS497969 and GG694051–GG695897, respectively. The genetic map has also been updated to include the additional 42 markers used to anchor scaffolds in the Tcas_3.0 assembly.
Table 1.
Genome sequence (Tcas_3.0) statistics
| Chromosome | Lengtha (bases) | Number of contigs (bases) | Number of captured gaps (bases) | Number of uncaptured gapsb (bases) |
|---|---|---|---|---|
| ChLGX | 10 877 635 | 338 (7 017 036) | 299 (265 951) | 12 (3 600 000) |
| ChLG2 | 20 218 415 | 393 (14 025 453) | 338 (505 072) | 19 (5 700 000) |
| ChLG3 | 38 791 480 | 1560 (27 070 658) | 1355 (1 568 829) | 34 (10 200 000) |
| ChLG4 | 13 894 384 | 331 (11 543 342) | 299 (554 338) | 6 (1 800 000) |
| ChLG5 | 19 135 781 | 388 (13 841 583) | 335 (502 879) | 16 (4 800 000) |
| ChLG6 | 13 176 827 | 667 (8 259 034) | 549 (747 290) | 14 (4 200 000) |
| ChLG7 | 20 532 854 | 445 (14 850 616) | 401 (591 423) | 17 (5 100 000) |
| ChLG8 | 18 021 898 | 676 (12 793 837) | 570 (761 081) | 15 (4 500 000) |
| ChLG9 | 21 459 655 | 695 (14 607 456) | 598 (892 186) | 20 (6 000 000) |
| ChLG10 | 11 386 040 | 585 (7 061 652) | 495 (442 098) | 13 (3 900 000) |
| Unknownc | 41 251 169 | 3616 (20 543 639) | 1254 (2 031 250) | 1848 (18 480 000) |
aChromosome builds include scaffolds and contigs as well as uncaptured gaps between them. In GBrowse, scaffolds are not shown explicitly, but can be deduced from the contigs and captured gaps between uncaptured gaps. Since some contigs overlap, the total length of each chromosome build (column 2) is somewhat smaller than the combined total of columns 3, 4 and 5.
bThe uncaptured gaps on chromosome builds X – 10 are blocks of 300 000 Ns that act as placeholders between the mapped scaffolds and contigs. The actually size of the uncaptured gaps is not known and may be considerably longer or shorter than 300 kb.
cUnknown is a linear compilation of scaffolds and contigs that have not been mapped to chromosomes.
Gene models
Several gene prediction programs were previously used to annotate the Tcas_2.0 assembly, and were combined into a consensus GLEAN gene set (2,7). More than 2000 genes were manually curated by members of the Tribolium Genome Sequencing Consortium (2); however, new and updated gene models were not combined into a unified gene set. We generated the first Tribolium Official Gene Set (OGS) by merging the GLEAN gene set with the manually curated gene annotations. First, each manually curated gene was mapped to the Tcas_3.0 assembly, and the validity of the mRNA, CDS, and/or peptide sequence for each of the manually curated genes was checked to ensure that the peptide sequence represented the same exons/splice sites as the mRNA and CDS sequences. Incorrectly annotated exons were replaced with exon coordinates determined by Splign (8). In some cases, genes required manual curation to determine the correct or most likely gene structure. A non-redundant Official Gene Set was constructed by merging the GLEAN and manually curated gene sets, automatically replacing GLEAN models with overlapping, manually curated models. Finally, unique identifiers were assigned to each gene to facilitate communication of Tribolium genes in research publications. A total of 16 561 official genes were generated, assigned identifiers such as ‘TC######’, and submitted to NCBI (Table 2).
Table 2.
Gene model and EST statistics
| Chromosome | Official Gene | Curated Gene | GLEAN | AUGUSTUS | Ensembl | Fgenesh | NCBI-ab initio | NCBI-sup | RefSeq | EST |
|---|---|---|---|---|---|---|---|---|---|---|
| ChLGX | 798 | 81 | 799 | 691 | 1782 | 1196 | 700 | 507 | 544 | 2119 |
| ChLG2 | 1661 | 287 | 1641 | 1225 | 3425 | 2524 | 1349 | 987 | 1018 | 4691 |
| ChLG3 | 1998 | 220 | 1967 | 1654 | 4304 | 3444 | 1512 | 1137 | 1182 | 5062 |
| ChLG4 | 1529 | 191 | 1530 | 1202 | 3029 | 2161 | 1293 | 868 | 954 | 3629 |
| ChLG5 | 1806 | 254 | 1769 | 1441 | 3851 | 2530 | 1393 | 1088 | 1192 | 4442 |
| ChLG6 | 1033 | 155 | 1021 | 908 | 2282 | 1281 | 904 | 660 | 695 | 2470 |
| ChLG7 | 1887 | 293 | 1850 | 1555 | 3969 | 2805 | 1645 | 1255 | 1277 | 4653 |
| ChLG8 | 1623 | 182 | 1618 | 1380 | 3391 | 2073 | 1394 | 976 | 1032 | 4735 |
| ChLG9 | 1509 | 161 | 1522 | 1229 | 3138 | 2206 | 1239 | 920 | 972 | 3447 |
| ChLG10 | 628 | 108 | 615 | 552 | 1432 | 896 | 515 | 375 | 398 | 2119 |
| Unknown | 2089 | 121 | 2086 | 1107 | 2358 | 2325 | 2018 | 653 | N/A | 13 006 |
| Total | 16 561 | 2053 | 16 418 | 12 944 | 32 961 | 23 441 | 13 962 | 9426 | 9264 | 50 277 |
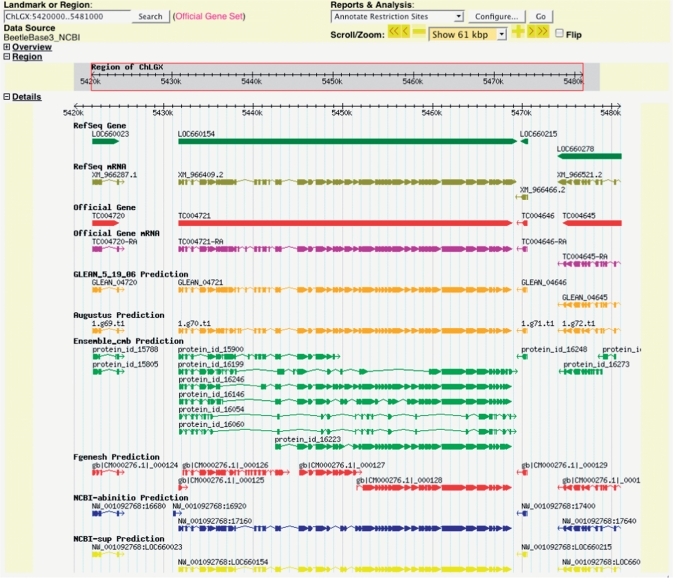
Since some researchers may benefit from access to other gene sets, we migrated the AUGUSTUS, Ensembl, Fgenesh, NCBI supported and ab initio gene models, and the combined GLEAN genes from the Genboree database hosted at Baylor College of Medicine (http://www.genboree.org), and converted their coordinates into the genome coordinates of Tcas_3.0 (Table 2). Only a few of the predicted genes were lost when the scaffolds were reorganized. In addition, the latest RefSeq annotation from NCBI (build 2.1, based on the same Tcas_3.0 assembly), which includes 3613 protein accessions that are new or changed from the original annotation run used for the GLEAN set, was imported into BeetleBase. Each gene set is available for viewing in a separate track in GBrowse (Figure 1).
Figure 1.
Tribolium gene models. Various gene models are shown in different tracks for easy comparison. By clicking one of the gene models, detailed information can be retrieved. The RefSeq gene models are linked to NCBI Entrez Gene report pages. The Tribolium official gene models and manually-curated gene models link to the BeetleBase gene report pages. Other gene models link to detailed pages provided by GBrowse.
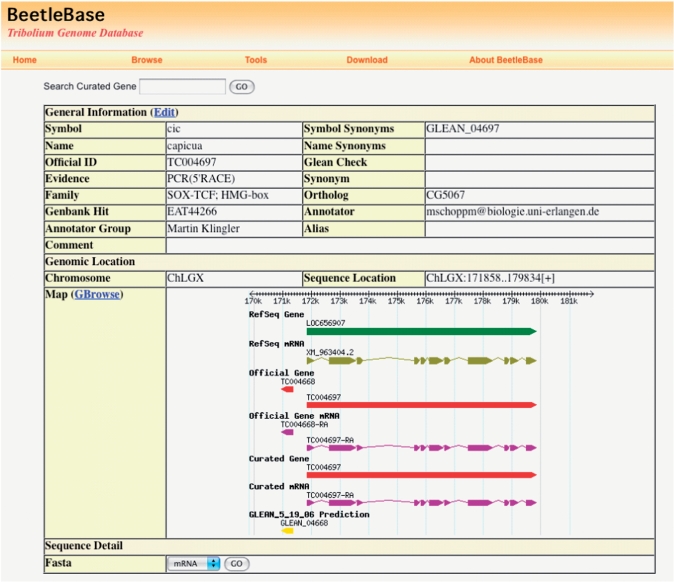
BeetleBase provides a detailed gene report page for each gene in the OGS, which can be accessed and managed through the web interface (Figure 2). The new BeetleBase database provides more comprehensive gene information than was previously available, including detailed information on the gene structure, nomenclature, and additional annotation data provided during the manual curation process. Links are also provided to overlapping RefSeq Gene and transcript records at NCBI (9,10) to facilitate use of data from both databases.
Figure 2.
Official gene report page. The report page provides detailed information for an official gene. The information can be modified by clicking ‘Edit’ after obtaining a password from the BeetleBase webmaster. The report page links to GBrowse by clicking ‘GBrowse’. The corresponding region will be highlighted in GBrowse.
EST and BAC-end sequences
EST and BAC-end sequences were downloaded from the dbEST and GSS databases, respectively, at NCBI. 55 616 ESTs from five different tissue- and stage-specific cDNA libraries (11) were cleaned and polyA sequences removed using in-house software tools (http://bioinformatics.ksu.edu/ArthropodEST) and aligned to the genome using the Exonerate algorithm (12). A total of 50 277 EST-genome alignments were generated. BAC-end sequences from the Tribolium BAC library (constructed by Exelixis, Inc, South San Francisco, CA and archived for distribution by the Clemson University Genomics Institute (https://www.genome.clemson.edu/) were mapped to the genome and added to the database. Out of 28 788 BAC-end sequences, 27 810 were aligned to the genome using BLAST.
Tiling arrays
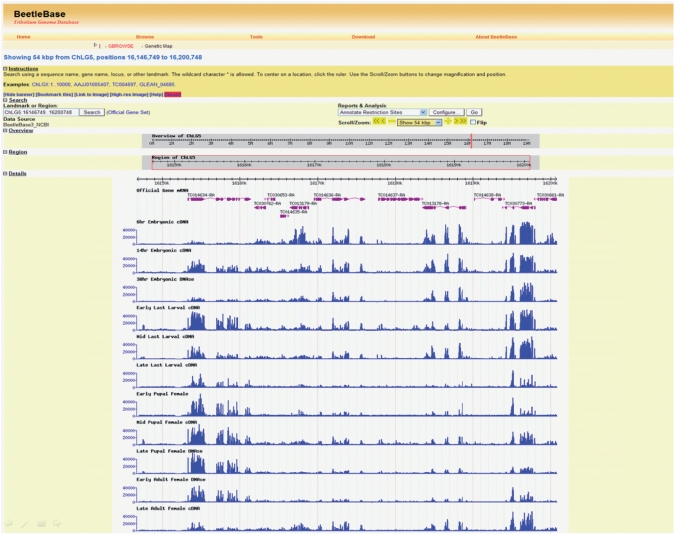
Using Roche NimbleGen HD2 whole genome DNA tiling arrays, whole genome expression data have been collected for several developmental stages including three embryonic, the last larval, three pupal and two adult stages. Briefly, fluorescently labeled cDNAs were hybridized to the custom-designed microarrays; GFF files were constructed using the signal intensities from each feature on the array that were quantified directly from the scanned array images without any data management such as background subtraction. This was done to provide immediate access to the data to help verify computed gene models and assist manual annotation efforts while the data are processed and further analyzed. Figure 3 shows empirically derived transcriptome tiling array data generated from several developmental stages for a portion of the Tribolium genome.
Figure 3.
Tribolium genome tiling arrays. Tracks for 11 developmental time points are shown. Blue vertical bars of each track represent fluorescence intensity values for oligonucleotide probes tiled across a 54 kb region on the array. The official gene mRNA track (above time point tracks) contains purple gene structures. Note the different expression patterns of the annotated genes across development.
FTP site
Datasets that can be downloaded from BeetleBase (ftp://bioinformatics.ksu.edu/pub/BeetleBase/3.0/) include the contig sequences, GFF (.gff3) and assembly files (.agp) for Tcas_3.0. Sequences of GLEAN genes, GLEAN cDNAs and GLEAN peptides as well as the corresponding files for the OGS are also available.
IMPLEMENTATION
All the genomic information was compiled into Genetic Feature Format Version 3 (GFF3), which is the most common extension of GFF. The compiled information was implemented using GMOD tools (http://www.gmod.org) such as PostgreSQL-based Chado 1.0, GBrowse 1.68, and CMAP 1.0. To query sequences against the Tribolium genome, we also installed stand alone BLAST and BLAT servers. In this release of BeetleBase, we improved the usability by integrating these components.
FUNDING
Grant number P20 RR016475 from the National Center for Research Resources (NCRR), a component of the National Institutes of Health. Work at NCBI was supported by the Intramural Research Program of the NIH, National Library of Medicine. Funding for open access charge: National Center for Research Resources National Institutes of Health (P20 RR016475).
Conflict of interest statement. None declared.
REFERENCES
- 1.Roth S, Hartenstein V. Development of Tribolium castaneum. Dev. genes Evol. 2008;218:115–118. doi: 10.1007/s00427-008-0215-2. [DOI] [PubMed] [Google Scholar]
- 2.Tribolium Genome Sequencing Consortium. The genome of the model beetle and pest Tribolium castaneum. Nature. 2008;452:949–955. doi: 10.1038/nature06784. [DOI] [PubMed] [Google Scholar]
- 3.Wang LJ, Wang S, Li Y, Paradesi MS, Brown SJ. Beetlebase: the model organism database for Tribolium castaneum. Nucleic Acid Res. 2007;35:D476–D479. doi: 10.1093/nar/gkl776. [DOI] [PMC free article] [PubMed] [Google Scholar]
- 4.Altschul SF, Madden TL, Schäffer AA, Zhang J, Zhang Z, Miller W, Lipman DJ. Gapped BLAST and PSI-BLAST: a new generation of protein database search. Nucleic Acids Res. 1997;25:3389–3402. doi: 10.1093/nar/25.17.3389. [DOI] [PMC free article] [PubMed] [Google Scholar]
- 5.Kent WJ. BLAT-The BLAST-like alignment tool. Genome Res. 2002;12:656–664. doi: 10.1101/gr.229202. [DOI] [PMC free article] [PubMed] [Google Scholar]
- 6.Lorenzen MD, Doyungan Z, Savard J, Snow K, Crumly LR, Shippy TD, Stuart JJ, Brown SJ, Beeman RW. Genetic linkage maps of the red flour beetle, Tribolium castaneum, based on bacterial artificial chromosomes and expressed sequence tags. Genetics. 2005;170:741–747. doi: 10.1534/genetics.104.032227. [DOI] [PMC free article] [PubMed] [Google Scholar]
- 7.Elsik CG, Worley KC, Zhang L, Milshina NV, Jiang H, Reese JT, Childs KL, Venkatraman A, Dickens CM, Weinstock GM, et al. Community annotation: Procedures, protocols, and supporting tools. Genome Res. 2007;16:1329–1333. doi: 10.1101/gr.5580606. [DOI] [PubMed] [Google Scholar]
- 8.Kapustin Y, Souvorov A, Tatusova T, Lipman D. Splign: algorithms for computing spliced alignments with identification of paralogs. Biol. Direct. 2008;3:20. doi: 10.1186/1745-6150-3-20. [DOI] [PMC free article] [PubMed] [Google Scholar]
- 9.Pruitt KD, Tatusova T, Maglott DR. NCBI Reference Sequence (RefSeq): a curated non-redundant sequence database of genomes, transcripts and proteins. Nucleic Acids Res. 2007;35:D61–D65. doi: 10.1093/nar/gkl842. [DOI] [PMC free article] [PubMed] [Google Scholar]
- 10.Maglott DR, Ostell J, Pruitt KD, Tatusova T. Entrez Gene: gene-centered information at NCBI. Nucleic Acids Res. 2007;35:D26–D31. doi: 10.1093/nar/gkl993. [DOI] [PMC free article] [PubMed] [Google Scholar]
- 11.Park Y, Aikins J, Wang LJ, Beeman RW, Oppert B, Lord JC, Brown SJ, Lorenzen MD, Richards S, et al. Analysis of transcriptome data in the red flour beetle, Tribolium castaneum. Insect Biochem. Mol. Biol. 2008;38:380–386. doi: 10.1016/j.ibmb.2007.09.008. [DOI] [PMC free article] [PubMed] [Google Scholar]
- 12.Slater GS, Birney E. Automated generation of heuristics for biological sequence comparison. BMC Bioinformatics. 2005;6:31. doi: 10.1186/1471-2105-6-31. [DOI] [PMC free article] [PubMed] [Google Scholar]


