

Abstract
Considerable evidence suggests that the brainstem pedunculopontine tegmentum (PPT) neurons are critically involved in the regulation of rapid eye movement (REM) sleep and wake (W); however, the molecular mechanisms operating within the PPT to regulate these two behavioral states remain relatively unknown. Here we demonstrate that the levels of calcium/calmodulin kinase II (CaMKII) and phosphorylated CaMKII expression in the PPT decreased and increased with “low W/high REM sleep” and “high W/low REM sleep” periods, respectively. These state-specific expression changes were not observed in the cortex, nor in the immediately adjacent medial pontine reticular formation (mPRF). Next, we demonstrate that CaMKII activity in the PPT is negatively and positively correlated with the “low W/high REM sleep” and “high W/low REM sleep” periods, respectively. These differences in correlations were not seen in the mPRF CaMKII activity. Finally, we demonstrate that with increased PPT CaMKII activity observed during high W/low REM sleep, there were marked shifts in the expression of genes that are involved in components of various signal transduction pathways. Collectively, these results for the first time suggest that the increased CaMKII activity within PPT neurons is associated with increased W at the expense of REM sleep, and this process is accomplished through the activation of a specific gene expression profile.
Keywords: ATF-2, CaMKII, gene expression, REM sleep, RT-PCR, wakefulness
Introduction
The pedunculopontine tegmentum (PPT) is situated in the dorsolateral tegmentum and contains a prominent group of cholinergic neurons that project widely throughout the brainstem and forebrain (Mesulam et al., 1983; Lai et al., 1993; Datta, 1995; Jones, 2004). Single cell recordings from the PPT in behaving cats and rats have identified several different classes of cells whose firing rates correlate with both wakefulness (W) and rapid eye movement (REM) sleep (El-Mansari et al., 1990; Steriade et al., 1990; Thakkar et al., 1998; Datta and Siwek, 2002). A number of neurophysiological and neurochemical studies have provided some definitive evidence in support of PPT cholinergic cell involvement in the regulation of REM sleep and W (Lydic and Baghdoyan, 1993; Garcia-Rill, 2001). Neurotransmitter-mediated excitation and inhibition of PPT cells are important processes for the regulation of both REM sleep and W. Recent neuropharmacological studies have demonstrated that the inhibitory neurotransmitter γ-aminobutyric acid (GABA) activates GABA-B receptors which inhibit PPT cholinergic cells and suppress REM sleep and W (Ulloor et al., 2004, Datta, 2007). On the other hand, the activation of PPT cholinergic cells by kainate receptors induces REM sleep, whereas the activation by N-methyl-D-aspartate (NMDA) receptors induces W (Datta and Siwek, 1997; Datta et al., 2001, 2002; Datta, 2002). Despite tremendous progress in the identification of specific neurotransmitters and receptors in the PPT for the regulation of REM sleep and W, the possible intracellular signal transduction and gene activation mechanisms within the PPT that may be involved in the regulation REM sleep and W remains incomplete.
It is known that Gi/Go G proteins inhibit adenylyl cyclase (AC) and inhibition of AC prevents activation of the cyclic adenosine monophosphate (cAMP)-protein kinase A (PKA) signal transduction pathway (Gilman 1987; Marinissen and Gutkind, 2001). Recently it has been demonstrated that the PPT GABA-B receptor-activation-induced suppression of REM sleep involves inhibition of AC that ultimately prevents activation of cAMP-PKA signaling pathway (Datta and Prutzman, 2005; Datta, 2007). Interestingly, one recent study using a combination of pharmacological and molecular techniques has suggested that the activation of cAMP-PKA within the PPT is involved in the induction of REM sleep (Bandyopadhya et al., 2006). While this has enhanced our understanding of signal transduction mechanisms operating within the PPT to promote the induction of REM sleep, the intracellular signal transduction mechanisms within the PPT responsible for the induction of W remain unknown. Since within the normal sleep-wake cycle, the end of REM sleep episodes corresponds to the beginning of W and, increased W suppresses the total amount of REM sleep, understanding the PPT signal transduction mechanisms promoting W is critical for our complete understanding of how REM sleep is regulated.
Given that activated NMDA receptors conduct calcium ions (Ca2+), it is reasonable to suggest that the PPT NMDA receptor activation-induced W may involve the Ca2+/calmodulin-dependent protein kinase II (CaMKII), a serine/threonine kinase constituting roughly 1–2% of total brain protein (Colbran, 1992; Soderling, 2000). Importantly, activation of NMDA receptors potentiates CaMKII activity (Strack & Colbran, 1998; Leonard et al., 1999). When active, CaMKII transduces membrane-mediated Ca2+ currents to affect transcriptional targets, such as the cAMP response element binding protein (CREB; Matthews et al., 1994). Notably, CaMKII is capable of autophosphorylation, which unhinges the enzyme from direct Ca2+-mediated activity (Hudmon and Schulman, 2002). To test the hypothesis that W may involve CaMKII, we quantified CaMKII and phosphorylated CaMKII (pCaMKII) within the PPT in both low W with high REM sleep (low W/high REM) and high W with low REM sleep (high W/low REM) conditions. In a separate study, we analyzed CaMKII activity in the PPT as a function of both W and REM sleep. Finally, we analyzed changes in PPT gene transcription in both low W/high REM sleep and high W/low REM sleep conditions.
Materials and Methods
Subjects
The final experiments were performed on 12 adult male Wistar rats (Charles River Labs, Wilmington, MA) weighing between 300–350 g. Subjects were housed individually at 24°C in a 12/12 hour light/dark cycle (lights on 7:00 a.m.) and allowed ad libitum access to food and water. Experiments were performed in accordance with the NIH Guide for the Care and Use of Laboratory Animals and were approved by the Boston University Animal Care Committee (AN-14084). Additional care was taken to ensure that any potential discomfort and the number of animals used were minimized. To reduce additional stress that might be imposed by the experimental handling, animals were gently handled daily for 15–20 min between 09:00 a.m. and 10:00 a.m. This habituation handling began one week prior to surgery and continued up to the experimental recording sessions.
Surgical procedures for electrode implantation
Stereotaxic surgeries were carried out as previously described (Datta, 2002; Datta et al.,2002), under pentobarbital anesthesia (40 mg/kg, i.p.; Abbott Labs, Chicago, IL). To record the behavioral states of vigilance, stereotaxically positioned electrodes were chronically implanted to record cortical electroencephalogram (CTX-EEG), dorsal neck muscle electromyogram (EMG), and hippocampal EEG (HPC-EEG). Post-operative pain was controlled with buprenorphine (0.05 mg/kg, s.c; Abbott Laboratories, Chicago, USA). After a post-surgical recovery of 5–7 days, rats were habituated to the recording cage, and free-moving polygraphic recording apparatus (Grass Amplifier System, West Warwick, RI, USA) for about 7 days as described earlier (Bandyopadhya et al., 2006). All adaptation recording sessions were performed between 9:00 a.m. and 4:00 p.m., when rats are normally sleeping.
Assessment of sleep/wake states
After adaptation, rats underwent an experimental recording session, during which polygraphic signals of all rats were recorded between 9:00 a.m. and 11:00 a.m. To determine wake-sleep states, polygraphic data was captured on-line using Gamma software (Grass product group, Astro-Med, Inc., West Warwick, RI, USA). From this captured data, using previously described criteria (Datta, 2002; Bandyopadhya et al., 2006), three behavioral states (W, non-REM sleep, and REM sleep) were distinguished and scored visually in 5-second epochs using Rodent Sleep Stager software (Grass product group, Astro-Med, Inc., West Warwick, RI, USA). These scored data of the two-hour recording period were then expressed as percentages of total time spent in W, non-REM, and REM sleep. Based on these percentage calculations, 12 rats with comparable total percentages of non-REM sleep (between 50% and 65%) were selected for the molecular study. These selected rats were then divided into two experimental groups based on total percentages of REM sleep and W: 1) low W/high REM sleep (REM sleep > 10%; n = 6 rats) and 2) high W/low REM sleep (REM sleep < 5%; n = 6 rats).
Tissue collection
Immediately after the end of the experimental recording session (at 11 a.m.), rats were killed with carbon dioxide and then the brains were quickly removed and frozen using dry ice. In order to minimize possible variations due to such differences in the sleep-wake state, at the time of death all animals were awakened by shaking their cage and kept awake for 1 min before they were killed with carbon dioxide. To rule out any diurnal factors contributing to the different levels of CaMKII activity in the different groups, all rats were killed at a fixed time of the day. From the frozen brain, the PPT, medial pontine reticular formation (mPRF) and frontal cortex were then dissected on an ice-chilled petri dish as described earlier (Ulloor and Datta, 2005; Bandyopadhya et al., 2006). The dissected brain parts were separately stored in pre-chilled microcentrifuge tubes at −80°C until further processing.
Assessment of CaMKII and pCaMKII expression
Brains were processed for western blot analyses. The PPT, mPRF and frontal cortex was dissected out of the brains on ice and homogenized using a tissue dounce in 650 μl of tissue lysate buffer containing PBS, 0.05% Triton X, 5mM EDTA, 1mM sodium orthovanadate, 25mM sodium fluoride, 5 mM phenylmethylsulfonyl fluoride, and one Complete Mini tablet (Roche, Indianapolis, IN). The lysate was centrifuged at 20000 × g for 20 minutes at 4°C. The crude protein extract was contained in the supernatant, which was removed from each sample and assayed for total protein concentration using a bicinchoninic acid assay kit (Thermo Fisher, Rockford, IL), measuring the spectrographic signal at 562 nm with a Benchmark Plus spectrophotometer (Bio-Rad, Hercules, CA). Samples were separated on NuPage 4–12% Bis-Tris gels in MOPS buffer (Invitrogen, Carlsbad, CA), and transfered to nitrocellulose membranes (Bio-Rad, Hercules, CA). The membranes were then probed for CaMKII and pCaMKII (Cell Signaling, Danvers, MA), and protein loading was controlled for by subsequent assessment of alpha-tubulin (Millipore, Billerica, MA) on the same membrane. Quantification of CaMKII, pCamKII and alpha-tubulin was performed via densitometric analysis using NIH Image J (Rasband, 1997–2007).
Assessment of CaMKII activity
For CaMKII enzyme-linked immunosorbent assay (ELISA), the crude protein extract was further purified by passing it through a mini-spin column (Micro Bio-Spin 6 chromatographic columns, Bio-Rad). The columns were equilibrated with 250 μl of the tissue lysate buffer, and centrifuged at 2000 × g for 30 sec. 200 μl of each crude extract was loaded on to an equilibrated column and centrifuged at 2000 × g for 30 sec. The flow-through solution was saved as a purified extract, and 10 μl was used to measure protein concentration as noted above. The remaining purified extract was used to determine CaMKII activity using a non-radiographic CaMKII ELISA (Cyclex CaM Kinase II Assay Kit, MBL International, Woburn, MA). For each sample, 10 μl of purified extract was added to 90 μl of CaM kinase buffer, and incubated at 30°C for 20 min. The samples were then rinsed five times in the wash buffer supplied with the kit, using a Model 1575 ImmunoWash (Bio-Rad, Hercules, CA). After the wash, 100 μl of the chromographic substrate reagent containing tetra-methylbenzidine was added to each well, and incubated for 18 min at room temperature. Immediately after, 100 μl of a stop solution was applied to each well containing substrate reagent. The plate was then immediately read at 450 nm using a Benchmark Plus spectrophotometer (Bio-Rad, Hercules, CA). The spectra obtained for each sample was subsequently normalized against the protein concentration for data analysis.
Assessment of gene expression
Gene expression analyses were carried out using a real time PCR-based RT2 Profiler Array (Rat Signal Transduction PathwayFinder PCR Array, SABiosciences, Frederick, MD). This analysis allows for a quantitative assessment of gene expression on a panel of genes involved in signal transduction pathways. For the low W/high REM sleep and high W/low REM sleep conditions, RNA was isolated. Unilateral PPT was dissected out on an ice-chilled petri dish as described earlier (Ulloor and Datta, 2005; Bandyopadhya et al., 2006) and placed in 1 ml of Trizol reagent (Invitrogen, Carlsbad, CA). The samples were homogenized using a PowerGen 125 tissue grinder (Fisher Scientific, Pittsburgh, PA). After incubating for 10 min at room temperature (RT), 200 μl of chloroform (Sigma, St. Louis, MO) was added and mixed thoroughly, and the samples were centrifuged at 10000 × g for 15 min at 4°C. The aqueous phase was removed from each sample and placed in a sterile tube. One volume of isopropanol (Sigma, St. Louis, MO) was added to each and the samples were incubated for 10 min at RT. Samples were then spun at 12000 × g for 15 min, and the supernatant was removed and placed in a sterile tube. 1 ml of 70% ethanol was added to each, and the samples were incubated for 10 min at RT. Afterward, 700 μl of each sample was loaded on to a RNeasy Mini Spin column (Invitrogen, Carlsbad, CA). The columns were spun at 9000 × g for 15 sec, and the flow-trough was discarded. This process was repeated with any remaining sample. With the total sample passed through the column, 700 μl of RW1 solution from an RNeasy Lipid Tissue Mini kit (Invitrogen, Carlsbad, CA) was added to the column, and the column was spun at 9000 × g for 15 sec, with the flow-through discarded. 500 μl of RPE solution was added to each column, and the column was spun at 9000 × g for 15 sec, with the flow-through discarded. An additional 500 μl of RPE solution was added to each column, and the column was spun at 9000 × g for 2 min, with the flow-through discarded. The columns were then placed in sterile collection tubes, and 35 μl of RNase-free water was added directly to the center of each column membrane. The RNA was eluted by centrifugation at 9000 × g for 1 min. The captured eluted RNA was reapplied to the column membrane, which was re-eluted by centrifugation at 9000 × g for 1 min. The RNA concentration was determined by measuring the 260/280 ratio using a NanoDrop 1000 spectrophotometer (Thermo Fisher Scientific, Waltham, MA)
A cDNA library was created for each sample from the isolated RNA, using an RT2 First Strand kit (SABiosciences, Frederick, MD). Briefly, 293 ng of RNA was added to 2 μl of GE 5X gDNA Elimination buffer, and the total volume was brought to 10 μl with RNase-free water. The sample was gently triturated, incubated at 42°C for 5 min, and chilled on ice. A reverse transcriptase cocktail containing 4 μl of BC3 5X RT buffer 3, 1 μl of P2 Primer buffer, and 2 μl of RE3 Reverse Transcriptase Enzyme Mix was added to 10 μl of the GE treated RNA. The sample was subsequently incubated at 42°C for 15 min, followed by 95°C for 5 min using an ABI 7500 Real Time PCR system (Applied Biosystems, Foster City, CA). After incubation, 91 μl of ultra-pure water was added to each sample containing 20 μl of cDNA. This cDNA was then subjected to qRT-PCR using a 96-well Rat Signal Transduction PathwayFinder PCR Array (PARN-014A, SABiosciences, Frederick, MD). Briefly, a master mix containing 1275 μl of 2X RT2 qPCR master mix (SABiosciences, Frederick, MD), 102 μl of the cDNA sample, and 1173 μl of ultra pure water was prepared. 25 μl was added to each well of the 96-well PCR Array plate. The plate was spun at 1000 × g for 1 min to remove any air bubbles, prior to analysis on the ABI 7500 Real Time PCR system using the cycle parameters: 95°C for 10 minutes, 40 cycles of 95°C for 15 seconds, followed by 60°C for 1 min. Signal detection and data collection occurred during the extension phase. Raw data was acquired using the ABI 7500 System SDS software (Applied Biosystems, Foster City, CA).
The threshold cycle (CT) was obtained for all genes, and the ΔCT was determined, using the average CT for the control genes of each plate (Rplp1, Hprt, Rpl13a, Ldha and Actb). Fold changes were determined by raising 2 to the power of the negative value for each ΔCT and subsequently calculating the Log10 for each.
Statistical analyses
Analysis of interval scale data involving only two independent groups was accomplished through utilization of the standard student’s t-test. To assess relative correlations between CaMKII enzymatic activity and W/REM sleep, Pearson correlations, which assumes a Gaussian distribution, were calculated. For all data, a Tukey outlier analysis, based on interquartile range, was performed to screen for significant outliers. All analyses were performed using Graphpad Prism statistical software (v5.0; GraphPad Software, La Jolla, CA).
Results
Sleep/wake states
During the 2 h of sleep-wake recording, a comparison of the total percentage of time spent in W between low W/high REM sleep and high W/low REM sleep subjects revealed a significant 42% reduction in W in the low W/high REM sleep group (t = 3.510, p = 0.0066; Figure 1). An opposite trend was observed when comparing the percentage of REM sleep in each group. There was a significant 209% increase in REM sleep in the low W/high REM group compared to the high W/low REM sleep group (t = 7.130, p < 0.0001; Figure 1). Conversely, a comparison of the percentage of time spent in non-REM sleep between the low W/high REM sleep and high W/low REM sleep groups revealed no significant difference (t = 0.8967, n.s.), demonstrating that the only behavioral distinction between the two groups was observed in the relative proportion of W and REM sleep.
Figure 1.

Polygraphic recording traces differentiating behavioral states W and REM sleep. A. Polygraphic trace profiles representative of W and REM sleep. In the REM sleep traces, there is a lack of muscle tone in the EMG, and presence of the theta wave in the HPC-EEG. B. An analysis of the mean percentage of time spent in REM sleep, wake, and non-REM sleep. Examination of the mean percentage of time spent in REM sleep revealed low W/high REM sleep subjects spent significantly significantly more time in REM sleep (13.27%) compared to high W/low REM sleep subjects (4.06%; t = 7.130, p < 0.0001), while an analysis of the mean percentage of time spent in wake revealed low W/high REM sleep subjects spent significantly less time in wake (24.97%) compared to high W/low REM sleep subjects (46.16%; t = 3.510, p = 0.0066). In contrast, an analysis of the mean percentage of time spent in non-REM sleep revealed no difference between the high REM sleep and low REM sleep conditions (t = 0.8967, n.s.). * indicates a significant difference <0.01; # indicates a significant difference <0.001.
CaMKII and pCaMKII expression in the PPT and mPRF
A western blot analysis was performed to probe the nature of CaMKII expression within the PPT associated with low W/high REM sleep and high W/low REM sleep conditions. CaMKII expression within the PPT was significantly reduced (29.2%) in the low W/high REM sleep group compared to the high W/low REM sleep condition (t = 18.48, p = 0.003; Figure 2). This effect was regionally specific, as an analysis of CaMKII expression within the mPRF (t = 1.874, n.s.) and the cortex (t = 0.4347, n.s.) revealed no difference between the low W/high REM sleep and high W/low REM sleep conditions. These data suggest that alterations in CaMKII expression within the PPT are coincident with the amounts of time spent in W and REM sleep. We also examined the expression of pCaMKII in the PPT associated with REM sleep. CaMKII is activated by Ca2+/calmodulin, though once active, CaMKII can autophosphorylate at Thr286, uncoupling CaMKII activity from Ca2+/calmodulin regulation. Analysis of pCaMKII revealed a significant 40.6% reduction in pCaMKII within the PPT in the low W/high REM sleep group compared to the high W/low REM sleep condition (t = 4.467, p = 0.0466, Figure 3). Importantly, when normalized to CaMKII, pCaMKII expression in the PPT was also significantly reduced by 24.1% (t = 4.405, p = 0.048, data not shown). In contrast, there was no difference observed in the expression of pCaMKII within the mPRF between the low W/high REM sleep and the high W/low REM sleep conditions (t = 0.5346, n.s.). This suggest that changes in the phosphorylation status of CaMKII may contribute to alterations in activity patterns of CaMKII within the PPT during both high W/low REM sleep and low W/high REM sleep conditions.
Figure 2.

Analysis of CaMKII expression in the PPT, mPRF and cortex of low W/high REM sleep and high W/low REM sleep subjects. Western blot analysis of CaMKII expression in the PPT revealed a significant 29.2% reduction in the low W/high REM sleep group compared to the high W/low REM sleep condition (t = 18.48, p = 0.003). In contrast, western blot analysis of CaMKII expression in the adjacent mPRF (t = 1.874, n.s.) and the cortex (t = 0.4347, n.s.) revealed no difference between the low W/high REM sleep and high W/low REM sleep conditions. All analyses of CaMKII expression are normalized against α-tubulin. * indicates a significant difference <0.01.
Figure 3.

Analysis of pCaMKII expression in the PPT and mPRF of low W/high REM sleep and high W/low REM sleep subjects. Densitometric measurements from western blots of pCaMKII expression in the PPT revealed a significant (40.6%) reduction in phosphorylated CaMKII in the low W/high REM sleep group compared to the high W/low REM sleep group (t= 4.467, p = 0.0466). In contrast, an analysis of pCaMKII expression within the adjacent mPRF revealed no difference between low W/high REM sleep group and the high W/low REM sleep group (t = 0.5346, n.s.). * indicates a significant difference <0.05.
CaMKII activity in the PPT and mPRF
Given the potential role CaMKII may play in support of W and/or REM sleep, it was of interest to probe potential differences in CaMKII activity associated with periods of high W with low REM sleep and low W with high REM sleep. An ELISA analysis of CaMKII activity within the PPT demonstrated a negative correlation between CaMKII activity and REM sleep (r2 = 0.788, F = 6.918, p = 0.039; Figure 4A), whereas a positive correlation was observed between CaMKII activity and W within the PPT (r2 = 0.536, F = 22.26, p = 0.003; Figure 4B). In contrast, there was no significant correlation observed between CaMKII activity within the immediately adjacent mPRF and REM sleep (r2 = 0.105, F = 0.942, n.s.; Figure 4C). Similarly, there was no significant correlation between CaMKII activity within the mPRF and W (r2 = 0.099, F = 0.879, n.s.; Figure 4D). This demonstrates that the increase in CaMKII activity within the PPT during the high W period, and the reduction in CaMKII activity within the PPT during the high REM sleep period is a regionally specific effect, suggesting that within the PPT, CaMKII operates to both promote W and/or suppress REM sleep.
Figure 4.

Analysis of CaMKII activity in the PPT and mPRF of low W/high REM sleep and high W/low REM sleep subjects. A. An analysis of CaMKII activity in the PPT reveals a negative correlation between CaMKII activity and REM sleep (r2 = 0.7262; F = 18.56, p = 0.0035). B. Conversely, a significant positive correlation between CaMKII activity within the PPT and W was observed (r2 = 0.536, F = 22.26, p = 0.003). C. In contrast, within the adjacent mPRF, there is no correlation observed between CaMKII activity and REM sleep (r2 = 0.105, F = 0.942, n.s.). D. Similarly, there is no correlation observed between CaMKII activity within the mPRF and W (r2 = 0.099, F = 0.879, n.s.)
Changes in gene expression associated with alterations in CaMKII activity
Given the upstream position of CaMKII within molecular signaling cascades that regulate transcription factor activity, it was of particular interest in the present study, in the context of altered CaMKII expression and activity associated with the relative amounts of W and REM sleep, to determine whether the reduction in CaMKII activity within the PPT coincident with low W and high REM sleep was associated with a subsequent alteration in gene expression. To assess potential CaMKII-mediated signal transduction modification, a PCR microarray was performed. This method permitted the comparison of a panel of genes associated with signal transduction in both the low W/high REM sleep and high W/low REM sleep conditions. Table 1 shows genes in the PPT which were over-expressed in low W/high REM sleep vs. high W/low REM sleep, while Table 2 shows genes in the PPT which were under-expressed in low W/high REM sleep vs. high W/low REM sleep. These shifts in gene expression are represented graphically in Figure 5. There were 9 genes whose expression demonstrated a marked increased in the PPT coincident with low W and high REM sleep: two genes encoding cytokine factors (Bmp4 and Ccl2); three transcription factors (Foxa1, Hoxa1 and Junb); one gene involved in cell adhesion (Selp); one gene involved in DNA repair (Gadd45a); one gene involved in cellular iron regulation (Trfc); and one gene involved in extracellular matrix maintenance (Mmp7).
Table 1.
Genes over-expressed in the PPT in the low wakefulness/high REM sleep condition compared to the high wakefulness/low REM sleep condition
Table 2.
Genes under-expressed in the PPT in the low wakefulness/high REM sleep condition compared to the high wakefulness/low REM sleep condition
| Gene Symbol | GenBank # | Fold Change |
|---|---|---|
| Atf2 | NM_031018 | −34.154 |
| Bax | NM_017059 | −7.382 |
| Bcl2 | NM_016993 | −5.832 |
| Bcl2l1 | NM_031535 | −21.766 |
| Birc1b | XM_226742 | −4.451 |
| Birc3 | NM_023987 | −7.280 |
| Birc5 | NM_022274 | −5.293 |
| Bmp2 | NM_017178 | −20.592 |
| Brca1 | NM_012514 | −7.331 |
| Ccnd1 | NM_171992 | −14.662 |
| Cd5 | NM_019295 | −5.996 |
| Cdk2 | NM_199501 | −5.479 |
| Cdkn1a (p21) | NM_080782 | −3.717 |
| Cdkn2b | NM_130812 | −23.818 |
| Ei24 | NM_001025660 | −2.936 |
| Fgf4 | NM_053809 | −6.122 |
| Fn1 | NM_019143 | −3.396 |
| Hk2 | NM_012735 | −3.640 |
| Hsf1 | XM_001061027 | −10.733 |
| Igfbp4 | NM_001004274 | −2.856 |
| Lep | NM_013076 | −4.639 |
| Mmp10 | NM_133514 | −8.110 |
| Nfkb1 | XM_342346 | −15.889 |
| Sele | NM_138879 | −3.605 |
| Tnf | NM_012675 | −14.123 |
| Fas | NM_139194 | −3.317 |
| Vcam1 | NM_012889 | −3.074 |
| Vegfa | NM_031836 | −2.969 |
Figure 5.
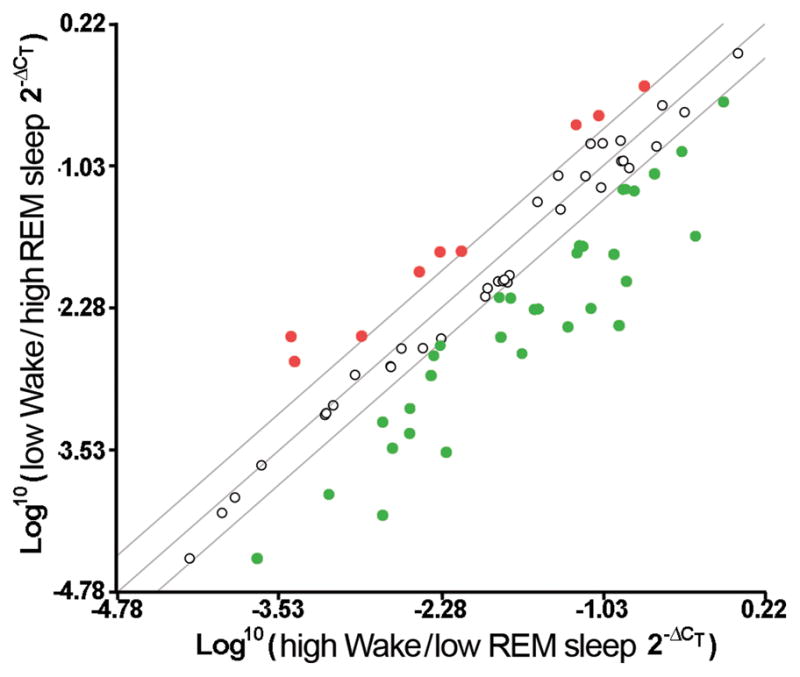
A scatter plot of fold changes in gene expression between a low W/high REM sleep and a high W/low REM sleep subject. Fold changes were determined by raising 2 to the power of the negative value for each ΔCT and subsequently calculating the Log10 for each. Examination of fold changes greater than 2.5 revealed 9 genes whose expression was elevated in low W/high REM sleep compared to high W/low REM sleep (each represented by a red circle), while examination of fold changes less than −2.5 revealed 28 genes whose expression was reduced in low W/high REM sleep compared to high W/low REM sleep (each represented by a green circle). In addition there were 49 genes whose expression did not vary between the low W/high REM sleep and high W/low REM sleep conditions, with fold changes less than ± 2.5.
Of genes whose expression was shown to decrease in the PPT coincident with low W and high REM sleep, 28 were observed (Table 2): there were three transcription factors (Atf2, Hsf1, and Vegfa); nine genes whose products play a role in cell death pathways (Bax, Bcl2, Bcl21, Birc1b, Birc3, Birc5, Brca, Ei24, and Nfkb1); six genes encoding proteins that interact with surface receptors (Bmp2, Cd5, Fgf4, Igfbp4, Lep, and Tnf); three genes whose products are expressed at the cell surface and are involved in signal transduction regulation (Fas, Fn1, and Vcam1); four genes encoding cyclin related kinases (Ccdn1, Cdk2, Cdkn1a, and Cdkn2b); one gene encoding a protein involved in cellular metabolism (Hk2); one gene encoding a protein involved in extracellular maintenance (Mmp10), and one gene whose protein product is involved inflammatory processes (Sele).
In addition, there were 49 genes whose expression did not change between the low W/high REM sleep and high W/low REM sleep conditions (fold change < ± 2.5, Table 3). There were also two other genes which were not found to be expressed within the PPT (Cyp19a1 and Ccl20, data not shown).
Table 3.
Genes with no expression difference in the PPT in the low wakefulness/high REM sleep condition compared to the high wakefulness/low REM sleep condition
| Gene Symbol | GenBank # | Fold Change | Gene Symbol | GenBank # | Fold Change |
|---|---|---|---|---|---|
| Cdh1 | NM_031334 | −2.43 | Mdm2 | XM_235169 | −1.45 |
| Cdkn1b | NM_031762 | −1.68 | Myc | NM_012603 | −1.75 |
| Cdkn2a | NM_031550 | −1.12 | Nab2 | XM_235224 | −1.84 |
| Cebpb | NM_024125 | 1.93 | Nfkbia | XM_343065 | −1.31 |
| Cxcl1 | NM_030845 | 2.30 | Nos2 | NM_012611 | −1.10 |
| Cxcl9 | NM_145672 | −2.11 | Nrip1 | XM_221724 | 2.17 |
| Egr1 | NM_012551 | −1.75 | Odc1 | NM_012615 | 2.38 |
| Fasn | NM_017332 | −2.36 | Pparg | NM_013124 | −1.06 |
| Fos | NM_022197 | −1.27 | Prkce | NM_017171 | 1.21 |
| Hspb1 | NM_031970 | −2.33 | Ptch1 | XM_345570 | −2.33 |
| Icam1 | NM_012967 | −1.55 | Pten | NM_031606 | −1.14 |
| Igfbp3 | NM_012588 | −1.96 | Ptgs2 | NM_017232 | −2.30 |
| Ikbkb | NM_053355 | −1.77 | Rbp1 | NM_012733 | 1.57 |
| Il1a | NM_017019 | −1.62 | Tank | NM_145788 | −1.52 |
| Il2 | NM_053836 | 1.00 | Tcf7 | XM_343891 | −1.37 |
| Il2ra | NM_013163 | −1.34 | Tert | NM_053423 | 1.18 |
| Il4ra | NM_133380 | −1.15 | Tmepai | XM_230899 | 1.80 |
| Irf1 | NM_012591 | −1.75 | Faslg | NM_012908 | −1.75 |
| Jun | NM_021835 | 1.17 | Tp53 | NM_030989 | 1.53 |
| Lef1 | NM_130429 | −1.88 | Wisp1 | NM_031716 | −1.13 |
| RGD1564108 | XM_238042 | 1.09 | Wnt1 | XM_235639 | −1.20 |
| Lta | NM_080769 | −1.30 | Wnt2 | XM_575397 | −1.65 |
Discussion
Within the brainstem, the PPT has emerged as an important regulator of W and REM sleep in all terrestrial mammals, including humans (Steriade et al., 1990; Datta and Siwek, 2002; Lim et al., 2007). Through cholinergic regulation of downstream nuclei responsible for the individual physiological properties of REM sleep (e.g. - activated cortical EEG, muscle atonia, and autonomic fluctuations), the activity of certain PPT neurons correlates well with REM sleep episodes, while others are well correlated with W (Datta and MacLean, 2007; Datta et al., 2009). Intracellularly, cascades involving cyclic AMP-dependent PKA are active within PPT neurons and promote REM sleep (Datta and Prutzman, 2005; Bandyopadhya et al., 2006; Datta et al., 2009), while activation of NMDA receptors promotes W (Datta et al., 2001). The ability of NMDA receptor activation to promote W and thus suppress REM sleep may result from signal transduction modifications due to the increase in intracellular Ca2+ during receptor conductance (MacDermott et al., 1986). As demonstrated by the current results, CaMKII and pCaMKII expression in the PPT is significantly reduced coincident with periods of increased REM sleep. This decrease in CaMKII and perhaps more acutely, pCaMKII, corroborates the finding that CaMKII enzymatic activity is reduced coincident with periods of increased REM sleep when compared to periods of increased wake.
The finding that pCaMKII expression is reduced coincident with periods of decreased W and increased REM sleep is intriguing, given that dephosphorylation of CaMKII occurs with increasing adenosine diphosphate (ADP) concentrations (Kim et al., 2001), opening the possibility of homeostatic regulation of CaMKII activity through alternating metabolite concentrations (Datta and MacLean, 2007). During wake, when PPT Wake-REM-on neurons are firing robustly, metabolic byproducts, including ADP, would accumulate (Datta and MacLean, 2007). This could then inactivate CaMKII, through dephosphorylation, which would allow for activity in REM sleep promoting molecular pathways, including protein kinase A (Bandyopadhya et al., 2006). These results suggest that CaMKII activity within PPT neurons is associated with promoting W, likely through a suppression of PPT regulated REM sleep. Consistent with this view, it follows that CaMKII, via REM sleep suppression, may promote transitions from REM sleep to W.
To evaluate the potential consequence of CaMKII modulation within PPT neurons coincident with periods of high and low W with low and high REM sleep, it was of interest to probe potential transcriptional alterations. While the observed transcriptional alterations are exploratory in nature, their utility resides in the ability to guide future study, and thus it is of value to explore such findings here. It is also important to acknowledge here that in the current analysis, changes in gene expression and its links to CaMKII discussed here are hypothetical in nature. When CaMKII activity within PPT neurons was reduced coincident with periods of decreased W and increased REM sleep, there were 8 genes involved in cell death whose expression in the PPT was also reduced (Bax, Bcl2, Bcl21, Birc1b, Birc3, Brca, Ei24, and Nfkb1). While the role CaMKII may occupy in modulating cell death through gene expression is unclear, CaMKII activity has been demonstrated to modulate Akt kinase activity (Howe et al., 2002; Wright et al., 1997), a central regulatory kinase within cell death pathways (Hemmings, 1997). The observed changes in cell death-related gene expression may reflect the ability of REM sleep to confer neuroprotection within the PPT. For example, REM sleep deprivation results in a significant reduction in the incorporation of BrdU labeling within hippocampal dentate gyrus (Guzmán-Marín et al., 2003). Reductions in BrdU staining concomitant with REM sleep deprivation suggest that there may a potentiation of neurogenesis associated with REM sleep. Alternatively, REM sleep may promote neurogenesis by preventing neuronal death, a mechanism that is supported by the reduction of cell-death associated genes coincident with periods of increased REM sleep and decreased W.
Several additional genes reduced concurrent with decreased W and increased REM sleep, including TNFα and Atf2, retain known links to CaMKII. Activating transcription factor-2 (ATF-2) is a member of the b-ZIP family, and can modulate transcription by targeting the ATF consensus site (Hai et al., 1989) and cAMP response element (CRE) sequences (Reimold et al., 1996). ATF-2 binding to DNA is mediated via phosphorylation of the protein, and heterodimerization with other b-ZIP family members (Bhoumik & Ronai, 2008). Expression of Atf2, which is markedly reduced concurrent with increased REM sleep, is regulated through concerted interaction between the transcription factor Sp1 and the Atf2 promoter (Nagase et al, 1990).
While CaMKII may influence Atf2 expression, possibly through interactions with Sp1, CaMKII has been shown to directly modulate Sp1 transcriptional activity (Sohm et al., 1998). As well, CaMKII is known to interact with the extracellular signal-regulated kinase (ERK; Borbiev et al., 2003), which itself can activate Sp1 (Merchant et al., 1999). In this regard CaMKII activity, acting through Sp1 within the PPT could suppress REM sleep episodes and promote W by affecting Atf2 expression. As a result, ATF-2 itself could effect a W specific transcriptional profile. With a decrease in CaMKII activity within the PPT coincident with REM sleep, a concomitant reduction in Atf2 expression could lead to a cessation of W and release of REM sleep suppression, through an alteration of the transcriptional profile of PPT neurons. It is interesting to note that CaMKII can indirectly influence the activity of ATF-2 via interactions with the protein kinases ERK and p38 mitogen activated protein kinase (MAPK; Borbiev et al., 2003; Gee et al., 2007). ERK and p38 MAPK phosphorylate ATF-2 (Raingeaud et al., 1995; Borbiev et al., 2003), and when dually phosphorylated, ATF-2 is transcriptionally active (Ouwens et al., 2002). This offers the possibility of post-transcriptional modulation representing an additional level of CaMKII control over ATF-2 activity within the PPT.
While CaMKII is well positioned to modify transcriptional processes in PPT neurons to influence W and REM sleep, it is also of interest to uncover the mechanisms driving CaMKII expression. Tumor necrosis factor alpha (TNFα), which is expressed in brain (Krueger and Majde, 1994) is well characterized as a modulator of immunological processes (Fiers, 1991), and is known to regulate gene expression through activity in second messenger cascades (Wang et al., 2005; Inoue et al., 2006). In regards to CaMKII, TNFα may play a role in modulating CaMKII expression, through regulation of the transcription factor Myb (Schachner et al., 1988), for which there are two putative binding sites within the CaMKII promoter (Sunyer and Sahyoun, 1990). As well, TNFα is known to promote CaMKII activity (Lee et al., 2008). This latter effect is consistent with diurnal concentrations of TNFα in the rat midbrain, which are elevated during daytime and reduced at night-time (Floyd & Kruger, 1997). The 14-fold reduction in TNFα expression concurrent with REM sleep would suggest that TNFα concentration variations are a result of transcriptional down-regulation, and it is interesting to speculate that such fluctuations in TNFα expression would translate to alterations in CaMKII activity. In this CaMKII-centric regulation of W and REM sleep view, diurnal fluctuations in TNFα could promote CaMKII activity, resulting in Atf2 expression, via activation of CaMKII-dependent Sp1, as well as suppression of CREB-mediated transcriptional activity (Sun et al., 2009). In this view, it is interesting to speculate that ATF-2 activity may play an important role in shifting the transcriptional profile of relevant PPT REM-on neurons and Wake-REM-on neurons, so that they promote W and not REM sleep.
While CaMKII activity may promote W and repress REM sleep, there were also positive shifts in transcription associated with REM sleep observed in PPT neurons. A REM sleep-specific transcription profile, perhaps mediated by protein kinase A (Bandyopadhya et al., 2006) would likely promote REM sleep through modulation of REM-on and Wake-REM-on neurons within the PPT. For example, the increase in several transcription factors may be important for the promotion of a REM sleep-specific transcriptional profile. In this regard, the forkhead box protein a2 (Foxa2), a forkhead family member transcription factor, is involved in insulin sensitivity (Puigserver & Rodgers, 2006). When insulin is present, Foxa2 is phosphorylated, resulting in nuclear exclusion and transcriptional repression (Wolfrum et al., 2004). During fasting (while sleeping), when circulating insulin is low, Foxa2 is unphosphorylated, resulting in Foxa2 transcriptional activity. This is consistent with reduced levels of insulin secretion observed coincident with REM sleep (Kern et al., 1996), suggesting that the increase in Foxa2 gene expression observed concurrent with REM sleep is consistent with oscillations of insulin secretion observed concurrent REM sleep.
There is also an increase observed in the expression of several cytokines within the PPT coincident with reduced W and increased REM sleep, and these are likely play a positive role in PPT neuronal function. For example, C-C chemokine ligand 2 (Ccl2), which is elevated within the PPT concurrent with REM sleep, promotes the release of brain-derived neurotrophic factor (BDNF) from microglia (Scholz and Woolf, 2007). Interestingly, BDNF levels in the brainstem are reduced in sleep deprived rats (Sei et al., 2000), and intracerebral BDNF injection has been shown to promote REM sleep in rabbits (Kushikata et al., 1999). Furthermore, the elevation of several cytokines coincident with REM sleep is consistent with recent data demonstrating a sleep-associated up-regulation of Aif-1 expression, which can be induced by cytokines (Autieri, 1996; Romcy-Pereira et al., 2009).
While there are multiple changes in the transcriptional profile within PPT neurons that are markedly altered concurrent with periods of decreased W and increased REM sleep, it is likely that CaMKII is one of the principal kinases regulating this aggregate shift. Importantly, autonomous CaMKII activity mediated by CaMKII autophosphorylation represents a novel mechanism whereby shifts in metabolic activity may regulate CaMKII, and thus play a role in the CaMKII-mediated transcriptional profile observed coincident with high wake. Certainly, additional progress defining the molecular cascades active in PPT neurons during REM sleep and wake periods will be valuable in the pursuit of a more complete picture of REM sleep-associated transcriptional changes. Notwithstanding, the current data support a novel role for CaMKII within PPT neurons in promoting W and suppressing REM sleep.
Acknowledgments
This research was supported by Grant Numbers MH59839 and NS34004 from the National Institutes of Health. The content is solely the responsibility of the authors and does not necessarily represent the official views of the National Institutes of Health. We thank Max P. Huang for his technical assistance.
Abbreviations
- AC
adenylyl cyclase
- ATF-2
activating transcription factor-2
- ADP
adenosine diphosphate
- BDNF
brain-derived neurotrophic factor
- cAMP
cyclic adenosine monophosphate
- Ca2+
calcium
- CaMKII
calcium/calmodulin kinase II
- Ccl2
C-C chemokine ligand 2
- CRE
cAMP response element
- CREB
cAMP response element binding protein
- CT
cycle threshold
- CTX-EEG
cortical electroencephalogram
- ELISA
enzyme-linked immunosorbent assay
- ERK
extracellular signal-regulated kinase
- EMG
muscle electromyogram
- Foxa2
forkhead box protein a2
- GABA
γ-aminobutyrate
- high W/low REM
high wakefulness with low REM sleep
- mPRF
medial pontine reticular formation
- HIP/EEG
hippocampal electroencephalogram
- low W/high REM
low wakefulness with high REM sleep
- NMDA
N-methyl-D-aspartate
- pCaMKII
phosphorylated Ca2+/calmodulin kinase II
- PKA
protein kinase A
- PPT
pedunculopontine tegmentum
- REM
rapid eye movement
- TNFα
tumor necrosis factor alpha
- W
wakefulness
Footnotes
Disclosure/conflict of interest
The authors declare there is no conflict of interest.
References
- Autieri MV. cDNA cloning of human allograft in amatory factor-1: tissue distribution, cytokine induction, and mRNA expression in injured rat carotid arteries. Biochem Biophys Res Commun. 1996;228:29–37. doi: 10.1006/bbrc.1996.1612. [DOI] [PubMed] [Google Scholar]
- Bandyopadhya RS, Datta S, Saha S. Activation of pedunculopontine tegmental protein kinase A: a mechanism for rapid eye movement sleep generation in the freely moving rat. J Neurosci. 2006;26:8931–8942. doi: 10.1523/JNEUROSCI.2173-06.2006. [DOI] [PMC free article] [PubMed] [Google Scholar]
- Bhoumik A, Ronai Z. ATF2: a transcription factor that elicits oncogenic or tumor suppressor activities. Cell Cycle. 2008;7:2341–2345. doi: 10.4161/cc.6388. [DOI] [PubMed] [Google Scholar]
- Borbiev T, Verin AD, Birukova A, Liu F, Crow MT, Garcia JGN. Role of CaM kinase II and ERK activation in thrombin-induced endothelial cell barrier dysfunction. Am J Physiol Lung Cell Mol Physiol. 2003;285:L43–54. doi: 10.1152/ajplung.00460.2001. [DOI] [PubMed] [Google Scholar]
- Colbran RJ. Regulation and role of brain calcium/calmodulin-dependent protein kinase II. Neurochem Int. 1992;21:469–497. doi: 10.1016/0197-0186(92)90080-b. [DOI] [PubMed] [Google Scholar]
- Datta S. Neuronal activity in the peribrachial area: relationship to behavioral state control. Neurosci Biobehav Rev. 1995;19:67–84. doi: 10.1016/0149-7634(94)00043-z. [DOI] [PubMed] [Google Scholar]
- Datta S. Evidence that REM sleep is controlled by the activation of brain stem pedunculopontine tegmental kainate receptor. J Neurophysiol. 2002;87:1790–1798. doi: 10.1152/jn.00763.2001. [DOI] [PubMed] [Google Scholar]
- Datta S. Activation of pedunculopontine tegmental PKA prevents GABAB receptor activation-mediated rapid eye movement sleep suppression in the freely moving rat. J Neurophysiol. 2007;97:3841–3850. doi: 10.1152/jn.00263.2007. [DOI] [PubMed] [Google Scholar]
- Datta S, Maclean RR. Neurobiological mechanisms for the regulation of mammalian sleep-wake behavior: reinterpretation of historical evidence and inclusion of contemporary cellularand molecular evidence. Neurosci Biobehav Rev. 2007;31:775–824. doi: 10.1016/j.neubiorev.2007.02.004. [DOI] [PMC free article] [PubMed] [Google Scholar]
- Datta S, Patterson EH, Spoley EE. Excitation of the pedunculopontine tegmental NMDA receptors induces wakefulness and cortical activation in the rat. J Neurosci Res. 2001;66:109–116. doi: 10.1002/jnr.1202. [DOI] [PubMed] [Google Scholar]
- Datta S, Prutzman L. Novel Role of Brain Stem Pedunculopontine Tegmental Adenylyl Cyclase in the Regulation of Spontaneous REM Sleep in the Freely Moving Rat. J Neurophysiol. 2005;94:1928–1937. doi: 10.1152/jn.00272.2005. [DOI] [PMC free article] [PubMed] [Google Scholar]
- Datta S, Spoley EE, Mavanji VK, Patterson EH. A novel role of pedunculopontine tegmental kainate receptors: a mechanism of rapid eye movement sleep generation in the rat. Neurosci. 2002;114:157–164. doi: 10.1016/s0306-4522(02)00250-6. [DOI] [PubMed] [Google Scholar]
- Datta S, Siwek DF. Excitation of the brain stem pedunculopontine tegmentum cholinergic cells induces wakefulness and REM sleep. J Neurophysiol. 1997;77:2975–2988. doi: 10.1152/jn.1997.77.6.2975. [DOI] [PubMed] [Google Scholar]
- Datta S, Siwek DF. Single cell activity patterns of pedunculopontine tegmentum neurons across the sleep-wake cycle in the freely moving rats. J Neurosci Res. 2002;70:611–621. doi: 10.1002/jnr.10405. [DOI] [PubMed] [Google Scholar]
- Datta S, Siwek DF, Stack EC. Identification of cholinergic and noncholinergic neurons in the pons expressing phosphorylated cAMP response element-binding protein (pCREB) as a function of rapid eye movement (REM) sleep. Neurosci. 2009;163:397–414. doi: 10.1016/j.neuroscience.2009.06.035. [DOI] [PMC free article] [PubMed] [Google Scholar]
- El-Mansari M, Sakai K, Jouvet M. Responses of presumed cholinergic mesopontine tegmental neurons to carbachol microinjections in freely moving cats. Exp Brain Res. 1990;83:115–23. doi: 10.1007/BF00232199. [DOI] [PubMed] [Google Scholar]
- Fiers W. Tumor Necrosis Factor. Characterization at the molecular, cellular and in vivo level. FEBS Lett. 1991;285:199–212. doi: 10.1016/0014-5793(91)80803-b. [DOI] [PubMed] [Google Scholar]
- Floyd RA, Krueger JM. Diurnal variation of TNF in the rat brain. Neuroreport. 1997;8:915–918. doi: 10.1097/00001756-199703030-00020. [DOI] [PubMed] [Google Scholar]
- Garcia-Rill E, Skinner RD, Miyazato H, Homma Y. Peduculoponitne stimulation induces prolonged activation of pontine reticular neurons. Neuroscience. 2001;104:455–465. doi: 10.1016/s0306-4522(01)00094-x. [DOI] [PubMed] [Google Scholar]
- Gee K, Angel JB, Mishra S, Blahoianu MA, Kumar A. IL-10 regulation by HIV-Tat in primary human monocytic cells: involvement of calmodulin/calmodulin-dependent protein kinase-activated p38 MAPK and Sp-1 and CREB-1 transcription factors. J Immunol. 2007;178:798–807. doi: 10.4049/jimmunol.178.2.798. [DOI] [PubMed] [Google Scholar]
- Gilman AG. G proteins: transducers of receptor-generated signals. Annu Rev Biochem. 1987;56:615–649. doi: 10.1146/annurev.bi.56.070187.003151. [DOI] [PubMed] [Google Scholar]
- Guzmán-Marín R, Suntsova N, Stewart DR, Gong H, Szymusiak R, McGinty D. Sleep deprivation reduces proliferation of cells in the dentate gyrus of the hippocampus in rats. J Physiol. 2003;592:563–571. doi: 10.1113/jphysiol.2003.041665. [DOI] [PMC free article] [PubMed] [Google Scholar]
- Hai T, Liu F, Coukus WJ, Green MR. Transcription factor ATF cDNA clones: an extensive family of leucine zipper proteins able to selectively form DNA-binding heterodimers. Genes Dev. 1989;3:2083–2090. doi: 10.1101/gad.3.12b.2083. [DOI] [PubMed] [Google Scholar]
- Hemmings BA. Akt signaling: linking membrane events to life and death decisions. Science. 1997;275:628–630. doi: 10.1126/science.275.5300.628. [DOI] [PubMed] [Google Scholar]
- Howe CJ, LaHair MM, Maxwell JA, Lee JT, Robinson PJ, Rodriguez-Mora O, McCubrey JA, Franklin RA. Participation of the calcium/calmodulin-dependent kinases in hydrogen peroxide-induced IkB phosphorylation in human T lymphocytes. J Biol Chem. 2002;277:30489–30476. doi: 10.1074/jbc.M205036200. [DOI] [PubMed] [Google Scholar]
- Hudmon A, Schulman H. Neuronal Ca2+/calmodulin-dependent Protein Kinase II: The role of structure and autoregulation in cellular function. Ann Rev Biochem. 2002;71:473–510. doi: 10.1146/annurev.biochem.71.110601.135410. [DOI] [PubMed] [Google Scholar]
- Inoue K, Kobayashi M, Yano K, et al. Through the suppression of vascular cell adhesion molecule-1 expression histone deacetylase inhibitor reduces monocyte adhesion to endothelium. Artrioscler Thromb Vasc Biol. 2006;26:2652–2659. doi: 10.1161/01.ATV.0000247247.89787.e7. [DOI] [PubMed] [Google Scholar]
- Jones BE. Paradoxical REM sleep promoting and permitting neuronal networks. Arch Ital Biol. 2004;142:379–396. [PubMed] [Google Scholar]
- Kern W, Offenheuser S, Born J, Fehm HL. Entrainment of ultradian oscillations in the secretion of insulin and glucagon to the nonrapid eye movement/rapid eye movement sleep rhythm in humans. J Clin Endocrinol Metab. 1996;81:1541–1547. doi: 10.1210/jcem.81.4.8636364. [DOI] [PubMed] [Google Scholar]
- Kim SA, Hudmon A, Volmer A, Waxham MN. CaM-kinase II dephosphorylates Thr286 by a reversal of the autophosphorylation reaction. Biochem Biophys Res Commun. 2001;282:773–780. doi: 10.1006/bbrc.2001.4651. [DOI] [PubMed] [Google Scholar]
- Krueger JM, Majde JA. Microbial products and cytokines in sleep and fever regulation. Crit Rev Immunol. 1994;14:355–379. doi: 10.1615/critrevimmunol.v14.i3-4.70. [DOI] [PubMed] [Google Scholar]
- Kushikata T, Fang J, Krueger JM. Brain-derived neurotrophic factor enhances spontaneous sleep in rats and rabbits. Am J Physiol. 1999;276:R1334–R1338. doi: 10.1152/ajpregu.1999.276.5.R1334. [DOI] [PubMed] [Google Scholar]
- Lai YY, Clements JR, Siegel JM. Glutamatergic and Cholinergic Projections to the Pontine Inhibitory Area Identified With Horseradish Peroxidase Retrograde Transport and Immunohistochemistry. J Comp Neurol. 1993;336:321–330. doi: 10.1002/cne.903360302. [DOI] [PMC free article] [PubMed] [Google Scholar]
- Lee CW, Lin CC, Luo SF, Lee HC, Lee IT, Aird WC, Hwang TL, Yang CM. Tumor necrosis factor-α enhances neutrophil adhesiveness: induction of vascular cell adhesion molecule-1 via activation of Akt and CaM kinase II and modifications of histone acetyltransferase and histone deacetylase 4 in human tracheal smooth muscle cells. Mol Pharmacol. 2008;73:1454–1464. doi: 10.1124/mol.107.038091. [DOI] [PubMed] [Google Scholar]
- Leonard AS, Lim IA, Hemsworth DE. Calcium/calmodulin-dependent protein kinase II is associated with the N-methyl-D-aspartate receptor. Proc Natl Acad Sci USA. 1999;96:3239–3244. doi: 10.1073/pnas.96.6.3239. [DOI] [PMC free article] [PubMed] [Google Scholar]
- Lim AS, Lozano AM, Moro E, Hamani C, Hutchinson WD, Dostrovsky JO, Wennberg RA, Murray BJ. Characterization of REM-sleep associated ponto-geniculo-occipital waves in the human pons. Sleep. 2007;30:823–827. doi: 10.1093/sleep/30.7.823. [DOI] [PMC free article] [PubMed] [Google Scholar]
- Lydic R, Bagdoyan HA. Pedunculopontine stimulation alters respiration and increases ACh release in the pontine reticular formation. Am J Physiol. 1993;264:R544–R554. doi: 10.1152/ajpregu.1993.264.3.R544. [DOI] [PubMed] [Google Scholar]
- MacDermott AB, Mayer ML, Westbrook GL, Smith SJ, Barker JL. NMDA-receptor activation increases cytoplasmic calcium concentration in cultured spinal cord neurones. Nature. 1986;321:519–522. doi: 10.1038/321519a0. [DOI] [PubMed] [Google Scholar]
- Marinissen MJ, Gutkind JS. G-protein-coupled receptors and signaling networks: emerging paradigms. Trends Pharmacol Sci. 2001;22:368–376. doi: 10.1016/s0165-6147(00)01678-3. [DOI] [PubMed] [Google Scholar]
- Matthews RP, Guthrie CR, Wailes LM, Zhao X, Means AR, McKnight GS. Calcium/calmodulin-dependent protein kinase types II and IV differentially regulate CREB-dependent gene expression. Mol Cell Biol. 1994;14:6107–6116. doi: 10.1128/mcb.14.9.6107. [DOI] [PMC free article] [PubMed] [Google Scholar]
- Merchant JL, Du M, Todisco A. Sp1 phosphorylation by Erk 2 stimulates DNA binding. Biochem Biophys Res Commun. 1999;254:454–461. doi: 10.1006/bbrc.1998.9964. [DOI] [PubMed] [Google Scholar]
- Mesulam MM, Mufson EJ, Wainer BH, Levey AI. Central cholinergic pathways in the rat: an overview based on an alternative nomenclature (Ch1–Ch6) Neuroscience. 1983;10:1185–1201. doi: 10.1016/0306-4522(83)90108-2. [DOI] [PubMed] [Google Scholar]
- Nagase T, Sudo T, Maekawa T, Yoshimura T, Fujisawa J, Yoshida M, Ishii S. Promoter region of the human CRE-BP1 gene encoding the transcriptional regulator binding to the cyclic AMP response element. J Biol Chem. 1990;265:17300–17306. [PubMed] [Google Scholar]
- Ouwens DM, de Rulter ND, van der Zon GCM, et al. Growth factors can activate ATF2 via a two-step mechanism: phosphorylation of Thr71 through the Ras-MEK-ERK pathway and of Thr69 through RalGDS-Src-p38. EMBO J. 2002;21:3782–3793. doi: 10.1093/emboj/cdf361. [DOI] [PMC free article] [PubMed] [Google Scholar]
- Puigserver P, Rodgers JT. Foxa2, a novel transcriptional regulator of insulin sensitivity. Nat Med. 2006;12:38–39. doi: 10.1038/nm0106-38. [DOI] [PubMed] [Google Scholar]
- Raingeaud J, Gupta S, Rogers JS, Dickens M, Han J, Ulevitch RJ, Davis RJ. Pro-inflammatory cytokines and environmental stress cause p38 mitogen-activated protein kinase activation by dual phosphorylation on tyrosine and threonine. J Biol Chem. 1995;270:7420–7426. doi: 10.1074/jbc.270.13.7420. [DOI] [PubMed] [Google Scholar]
- Rasband WS, Image J. U.S. National Institutes of Health; Bethesda, Maryland, USA: 1997–2007. http://rsb.info.nih.gov/ij/ [Google Scholar]
- Reimold AM, Grusby MJ, Kosaras B, et al. Chodrodysplasia and neurological abnormalities in ATF-2-deficient mice. Nature. 1996;379:262–265. doi: 10.1038/379262a0. [DOI] [PubMed] [Google Scholar]
- Romcy-Pereira RN, Erraji-Benchekroun L, Smyrniotopoulos P, Ogawa S, Mello CV, Sibille E, Pavlides C. Sleep-dependent gene expression in the hippocampus and prefrontal cortex following long-term potentiation. Physiol Behav. 2009;98:44–52. doi: 10.1016/j.physbeh.2009.04.010. [DOI] [PMC free article] [PubMed] [Google Scholar]
- Schachner J, Blick M, Freireich E, Gutterman J, Beran M. Suppression of c-myc and c-myb expression in myeloid cell lines treated with recombinant tumor necrosis factor-alpha. Leukemia. 1988;2:749–753. [PubMed] [Google Scholar]
- Scholz J, Woolf CJ. The neuropathic pain triad: neurons, immune cells, and glia. Nat Neurosci. 2007;10:1361–1368. doi: 10.1038/nn1992. [DOI] [PubMed] [Google Scholar]
- Sei H, Saitoh D, Yamamoto K, Morita K, Morita Y. Differential effects of short-term REM sleep deprivation on NGF and BDNF protein levels in the rat brain. Brain Res. 2000;877:387–390. doi: 10.1016/s0006-8993(00)02708-6. [DOI] [PubMed] [Google Scholar]
- Soderling TR. CaM-kinases: modulators of synaptic plasticity. Curr Opin Neurobiol. 2000;10:375–380. doi: 10.1016/s0959-4388(00)00090-8. [DOI] [PubMed] [Google Scholar]
- Sohm F, Gaiddon C, Antoine M, Boutillier AL, Loeffler JP. The retinoblastoma susceptibility gene product/Sp1 signalling pathway modulated by Ca2+/calmodulin kinases II and IV activity. Oncogene. 1998;18:2762–2769. doi: 10.1038/sj.onc.1202634. [DOI] [PubMed] [Google Scholar]
- Steriade M, Datta S, Oakson PG, Dossi RC. Neuronal activities in brain-stem cholinergic nuclei related to tonic activation processes in thalamocortical systems. J Neurosci. 1990;10:2541–2559. doi: 10.1523/JNEUROSCI.10-08-02541.1990. [DOI] [PMC free article] [PubMed] [Google Scholar]
- Strack S, Colbran RJ. Autophosphorylation-dependent targeting of calcium/calmodulin-dependent protein kinase II by the NR2B subunit of the N-methyl-D-aspartate receptor. J Biol Chem. 1998;273:20689–20692. doi: 10.1074/jbc.273.33.20689. [DOI] [PubMed] [Google Scholar]
- Sun P, Enslen H, Myung PS, Maurer RA. Differential activation of CREB by Ca2+/calmodulin-dependent protein kinases type II and type IV involves phosphorylation of a site that negatively regulates activity. Genes Dev. 2009;8:2527–2539. doi: 10.1101/gad.8.21.2527. [DOI] [PubMed] [Google Scholar]
- Sunyer T, Sahyoun N. Sequence analysis and DNA-binding interactions within the 5’ flanking region of the Ca2+/calmodulin-dependent protein kinase II α-subunit gene. Proc Natl Acad Sci USA. 1990;87:278–282. doi: 10.1073/pnas.87.1.278. [DOI] [PMC free article] [PubMed] [Google Scholar]
- Thakkar MM, Strecker RE, McCarley RW. Behavioral state control through differential serotonergic inhibition in the mesopontine cholinergic nuclei: a simultaneous unit recording and microdialysis study. J Neurosci. 1998;18:5490–5497. doi: 10.1523/JNEUROSCI.18-14-05490.1998. [DOI] [PMC free article] [PubMed] [Google Scholar]
- Ulloor J, Mavanji V, Saha S, Siwek DF, Datta S. Spontaneous REM sleep is modulated by the activation of the pedunculopontine tegmental GABAB receptors in the freely moving rat. J Neurophysiol. 2004;91:1822–1831. doi: 10.1152/jn.01104.2003. [DOI] [PubMed] [Google Scholar]
- Ulloor J, Datta S. Spatio-temporal activation of cyclic AMP response element-binding protein, activity-regulated cytoskeletal-associated protein and brain-derived nerve growth factor: a mechanism for pontine-wave generator activation-dependent two-way active-avoidance memory processing in the rat. J Neurochem. 2005;95:418–428. doi: 10.1111/j.1471-4159.2005.03378.x. [DOI] [PubMed] [Google Scholar]
- Wang CC, Lin WN, Lee CW, Lin CC, Luo SF, Wang JS, Yang CM. Involvement of p42/p44 MAPK, p38 MAPK, JNK, and NF-kappaB in IL-1beta-induced VCAM-1 expression in human tracheal smooth muscle cells. Am J Physiol Lung Cell Mol Physiol. 2005;288:L227–L237. doi: 10.1152/ajplung.00224.2004. [DOI] [PubMed] [Google Scholar]
- Wolfrum C, Asilmaz E, Luca E, Friedman JM, Stoffel M. Foxa2 regulates lipid metabolism and ketogenesis in the liver during fasting and in diabetes. Nature. 2004;432:1027–1032. doi: 10.1038/nature03047. [DOI] [PubMed] [Google Scholar]
- Wright DC, Schellenberger U, Ji L, Wang H, Larrick JW. Calcium induces increases in peroxisome proliferator-activated receptor δ coactivator-1α and mitochondrial biogenesis by a pathway leading to p38 mitogen-activated protein kinase activation. J Biol Chem. 1997;282:18793–18799. doi: 10.1074/jbc.M611252200. [DOI] [PubMed] [Google Scholar]