Abstract
Kinetic parameters and static images from dynamic SPECT imaging of 99mTc-teboroxime have been shown to reflect blood flow in dogs and in humans at rest and during adenosine stress. When compartment modeling is used, steady-state physiological conditions are assumed. With standard adenosine stress protocols, imaging of teboroxime would likely involve significant changes in flow, even if performed only for five minutes. These flow changes may significantly bias the kinetic parameter estimates. On the other hand, when static imaging is performed, large flow changes during acquisition may improve contrast between normal and occluded regions. Computer simulations were performed to determine the effect of changing flows on kinetic parameter estimation and on static (average tissue uptake) images. Two canine studies were also performed in which adenosine was given with a standard protocol, and then imaging was repeated with adenosine infusion held constant. The simulations predicted biases on the order of 7% for kinetic washin parameter estimation and 18% for the washout parameter. Contrast for static studies was found to depend critically on the time-activity behavior of the distribution as well as on the stress protocol. The differences in washin contrast from the standard and continous adenosine dog studies was slightly larger than predicted from the simulations. Optimal imaging of teboroxime with adenosine using compartment modeling will require non-standard adenosine stress protocols, although sub-optimal imaging may still be useful clinically.
I. Introduction
Teboroxime is a neutral lipophilic tracer that is taken up from the vasculature and then quickly washed out [1]. This rapid uptake and washout of teboroxime presents additional challenges and opportunities compared to imaging 201Tl and 99mTc-sestamibi, which redistribute much more slowly. In this work, we focus on the challenges and opportunities afforded by 99mTc-teboroxime cardiac imaging with adenosine. Standard clinical adenosine stress protocols call for a 6 minute adenosine infusion of 0.14mg/kg/min, with injection at 3 minutes. Vasodilation from adenosine has a half-life on the order of 10–20 seconds; blood flows return to baseline 145±67 seconds after the end of infusion [2]. Thus, imaging of 99mTc-teboroxime involves significant changes in flow, if performed for longer than 3–4 minutes. This reduction in flow to baseline levels may be problematic if the teboroxime data are fit to compartment models to extract parameters related to blood flow, since compartmental modeling assumes steady-state physiological conditions. Longer adenosine infusions may be practical, but are likely riskier and large-scale testing of such protocols has not been performed. Longer infusions also require more adenosine, resulting in an increased cost. Dipyridamole may be a practical alternative, as its effects are not as transient as adenosine. The plasma concentration of dipyridamole has a half-life of approximately 25 minutes [3]. Decreased specificity when using dipyridamole with 201Tl has been reported, however [3]. For this reason, and the fact that adenosine turns vasodilation on and off more quickly, it is worthwhile to investigate teboroxime imaging with the use of adenosine stress. Since others have reported teboroxime is in essence a first pass tracer [1]- the extraction fraction is very high the first time through but decreases afterwards, it is possible that changes in flow after initial uptake have minimal impact, at least on the washin parameter. However, washout is also a function of flow, and may be more sensitive to flow reductions.
In addition, for static imaging of teboroxime, changes in flow concurrent with imaging may possibly be exploited to provide additional contrast. It has been demonstrated that contrast between occluded and normal regions diminishes over time due to slower clearance from low-flow areas [4]. This equalization of the image intensities can be delayed by ending vasodilation early so that washout rates return to baseline values. Beanlands et al. suggested such an approach to permit “longer data acquisition times with a more stable tracer distribution” [5], but the idea has not yet been evaluated.
Kinetic parameters estimated from dynamic SPECT imaging of teboroxime have been shown to correlate with microsphere-based blood flow measurements at stress in large myocardial regions in dogs, using 17 minute dynamic acquisitions [6]. The studies by Smith et al. maintained a constant stress level by continuous infusion of adenosine. Dynamic teboroxime imaging with adenosine stress has also been reported in humans. In healthy human volunteers, coronary flow reserve ratio calculated by kinetic washin parameters at stress divided by washin parameters at rest was reported to be 2.7 ± 1.1 [7]. The k21 washin parameters were obtained from compartment model fits to data acquired from injection of teboroxime over 20 seconds, two minutes after the start of adenosine infusion. Adenosine infusion was continued for a total of 6 minutes, and the first 6.7 minutes of imaging data were used for fitting [7].
This work seeks to first establish a reasonable model for the spatial-temporal flux of teboroxime during blood flow changes. With this model, computer simulations will be presented in order to answer the following questions:
What is the impact on dynamic SPECT kinetic parameter estimates from using a standard adenosine infusion protocol, compared to using continuous adenosine infusion?
Is there a dynamic acquisition protocol that minimizes these impacts? Specifically, what is the optimal scan duration when using a standard adenosine protocol and compartment modeling?
Can contrast in static teboroxime images be improved by the use of adenosine stress for periods shorter than the 6 minutes called for by the standard adenosine protocol?
In addition to the computer simulation studies, two dog studies were performed in order to evaluate dynamic and static imaging when changing from vasodilation to baseline.
II. Methods
A. Modeling the Change from Vasodilation to Rest
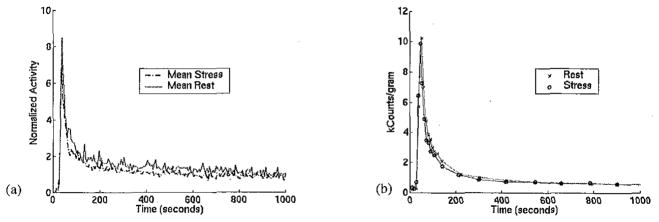
Data from six teboroxime dog experiments [8] were reviewed in order to identify typical blood, myocardial tissue, and occluded tissue time-activity curves at vasodilation and at rest. The vasodilation was induced by continuous infusion of adenosine. Blood clearance, i.e. the blood input function, was noted to depend little on vasodilation, as has been reported previously in experiments on dogs with dipyridamole [9]. Figure 1(a) shows the mean blood curve at stress and at rest from the six experiments. The mean was calculated after normalizing each blood input curve by the corresponding injected dose of teboroxime. Also included in calculating the mean is an additional study in which the standard adenosine protocol was used (see Methods Section C. for more details). Figure 1(b) shows plasma time-activity curves from blood samples taken during stress and rest in one study (scaled by dose). Figure 1 implies that the use of a single input function for the simulation of the teboroxime input curve is reasonable. Thus, the same blood input was used for both vasodilated and baseline conditions; the average of the stress and rest inputs in Figure 1(a) was interpolated to give samples every 0.5 second and used for all of the simulations. Tissue uptake was modeled as the convolution of the blood input and a two compartment model. Specifically:
| (1) |
where fv is the fraction of blood in the myocardium due to capillaries and partial volume effects, k21 is the washin parameter (thought to represent flow times extraction), k12 is the washout rate constant, b(t) is the blood input function, ⊗ represents convolution, and the measured data a(t) is collected over the time interval Δt. This model has been shown to fit dynamic teboroxime data well [6–8].
Figure 1.
(a) Average blood input time-activity curves for teboroxime at stress and at rest, from regions of interest drawn on the images of six dog studies. (b) Plasma time-activity curves from one dog study. The input functions are similar at stress and at rest, justifying the use of a single blood input in the simulation.
The rate constants k21 and k12 for the simulations were taken from the average values obtained from the six studies at stress and at rest, from normally perfused areas of the myocardium and from occluded regions (Table 1). It was then assumed that the transition from vasodilation to rest was well-modeled as no change for the first 12.8 seconds after adenosine infusion was turned off, and then as an exponential decrease with a half-life of 10 seconds. This corresponds to data from humans published in [2]. A value of 0.1 was used for fv in all of the simulations in this paper.
Table 1.
Average Kinetic Parameters (min−1)
| k21 | k12 | |
|---|---|---|
| Stress normal | 2.1 | 1.1 |
| Stress occluded | 0.72 | 0.63 |
| Rest normal | 1.2 | 0.75 |
| Rest occluded | 0.52 | 0.47 |
B. Computer Simulations
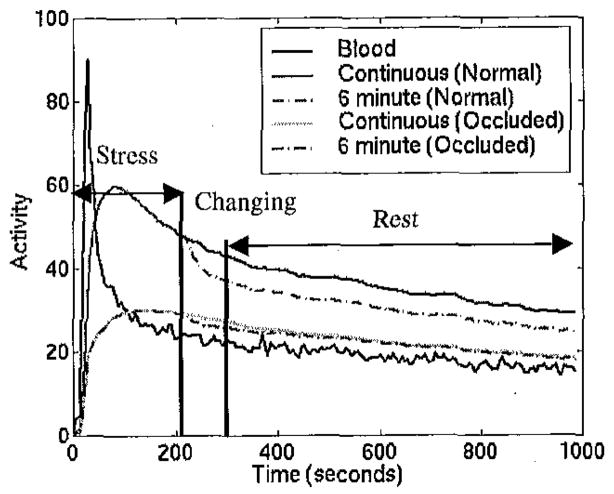
Computer simulations of time-activity curves were performed to investigate the effect of changing flows on kinetic parameter estimation. To simulate the continuous infusion case, kinetic parameters from stress conditions were used in equation (1). The curves were sampled every half second and then integrated to simulate imaging frames every 5.5 seconds. A total of 180 frames (990 seconds) were generated. Figure 2 shows the time-activity curves generated in this fashion.
Figure 2.
Simulated time-activity curves. The dip seen in the transition period for the 6 minute curves arises because washin and washout are changing at different rates. That is, the distribution volume (k21/k12) is decreasing (see Table 1).
Based on the report of 84±46 seconds as the average time between the start of adenosine infusion and maximal vasodilation in 30 patients [1], we redefine the standard adenosine protocol here as injection of teboroxime at 150 seconds after the onset of adenosine infusion. The total time of infusion is kept at 360 seconds (6 minutes). To simulate this standard adenosine protocol, the simulated curves begin with a stress flow level, and then begin transitioning to rest at 222 seconds post-injection (Figure 2). Activity data for the transition period was calculated numerically from the appropriate time point of a time-activity curve with washin and washout values that were exponentially decreased from the initial stress values using a half-life of 10 seconds, until the resting values given in Table 1 were reached.
After 282 seconds of imaging, baseline resting values were used. The remaining simulated time points correspond to those that would be obtained from a study in which the animal began and remained at rest. Subsets of the 180 frames of simulated data corresponding to imaging durations of 306, 420, 552, and 990 seconds were used.
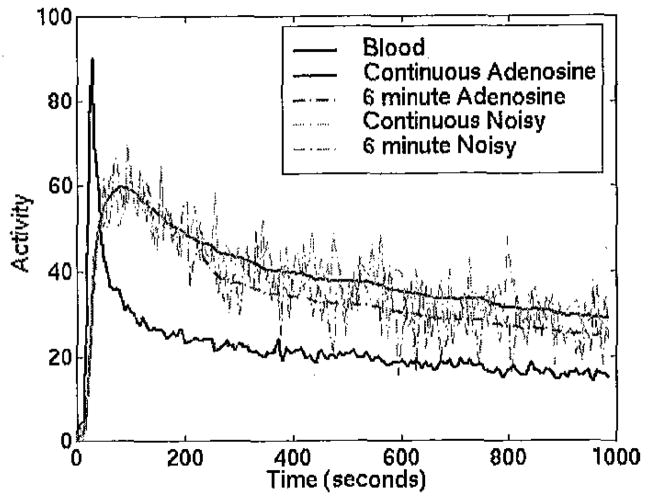
The curves were scaled to values representative of studies done in dogs and Gaussian noise (zero mean, variance equal to the time-activity curve value) was added to the curves. Figure 3 shows an example of one noise realization of the simulated time-activity curves for the normal region. Twenty-five noise realizations of the curves were generated and fit. This process was performed with curves from all of the kinetic parameters given in Table 1. A Student’s t-test was used when comparing parameters and O/N ratios to the true simulated values.
Figure 3.
Simulated time-activity curves with noise added.
Contrast was evaluated as the ratio of the kinetic parameters in low flow (occluded) regions divided by the parameter values in their respective normal region and is referred to as occluded to normal or O/N ratios.
Static studies were also created from the time-activity curves. The data were summed beginning from either 0 or 30 seconds post-injection and ending 246 seconds later. Four different stress protocols were used:
Continuous stress
100 seconds of stress post-injection
50 seconds of stress post-injection
30 seconds of stress post-injection.
O/N ratios were calculated from the results to compare contrast between the different methods. Another set of resting kinetic parameters (normal k21 =0.8, k12 =0.4, occluded k21=0.7, k12=0.35) was also investigated in this simulation, to more closely simulate the situation when abnormal (e.g. occluded) and normal regions differ little at rest (see Discussion).
C. Canine Studies
Two canine studies were performed in which adenosine was given with a standard protocol (0.14 mg/kg/min infusion for 6 minutes, with injection of teboroxime at 3 minutes). Simultaneously with the bolus i.v. injection of teboroxime, radioactive microspheres (46Sc) were injected into the left atrium to determine true flows. These studies were part of a larger study comparing 201Tl and teboroxime; details of the canine model and preparation are given in [8]. In the same animals, an additional teboroxime stress study was also performed. The additional study began 53 minutes later for one dog and 43 minutes later for the other. In these later studies, adenosine infusion was held constant at 0.14 mg/kg/min for the duration of the scan (17 minutes). No microspheres were available for these studies. For all studies, a complete set of projections was acquired every 5.66 seconds and reconstructed with attenuation and detector response compensation. The transaxial images were reoriented to short axis slices and a region (approximately 2.5 cm3) in a normal territory, and a region (2 cm3) in an occluded area were used. The resulting curves were fit with equation (1). Washin and washout occluded/normal (O/N) ratios were compared to values from microsphere-determined flows. Also, two sets of static images of 5.5 minutes total duration with different time delays post-injection (22 seconds and 147 seconds) were created by summing reconstructed short axis frames. Note that it is important to perform “static” imaging by averaging rapidly acquired reconstructed images to reduce artifacts. A single slow acquisition gives more inconsistent data since the radionuclide distribution changes greatly between the first projection and the nth projection. These images were analyzed using the same occluded and normal regions as used with the dynamic studies.
III. Results
A. Computer Simulations
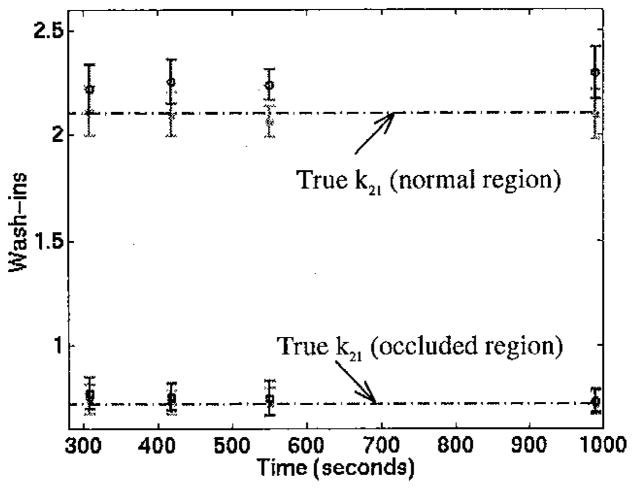
The goodness of the fit to the measured data a(t) in equation (1) deteriorated with the model mismatch induced by the changing blood flow. Table 2 summarizes the results from the dynamic simulations using 552 seconds of data. The reported bias was calculated as (estimated-truth)/truth and expressed as a percentage. Also, the variance over the multiple noise realizations increased with flow changes. Figures 4 and 5 graphically depict the results in Table 2 as well as results from different acquisition durations (306, 420, 552, and 990 seconds).
Table 2.
Bias of Parameter Estimates, 552 seconds of imaging
| k21 | k12 | fv | |
|---|---|---|---|
| Continuous stress - normal region | −1.8% | −2.3% | −5.2% |
| 6 min. stress– normal region | 6.6% | 18.3% | −40.3% |
| Continuous stress– occ. Region | 0.6% | 1.0% | −12.4% |
| 6 min. stress– occ. Region | 3.5% | 7.2% | −16.7% |
Figure 4.
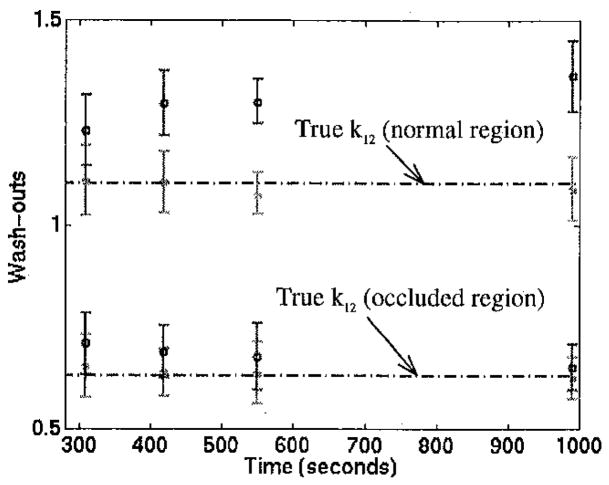
k21 parameters from simulated data. The lighter symbols marked with * are from 25 noise realizations of continuous stress. The ‘o’ symbols are from the 6 minute stress protocol. The error bars show ± one standard deviation. All of the continuous stress results are not significantly different from the true washin (p>0.05). All of the 6 minute results are significantly different from truth (p<0.05), except when 990 seconds of occluded data is used.
Figure 5.
Washout (k12) parameters from simulated data. Symbols are the same as described in Figure 4. Differences between continuous stress and truth were not significant (p>0.05); 6 min. stress results were all significantly different from truth (p<0.05).
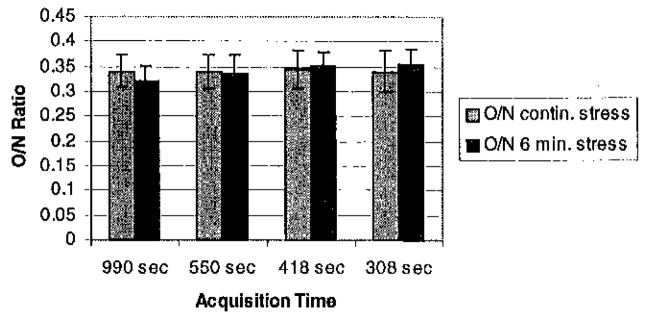
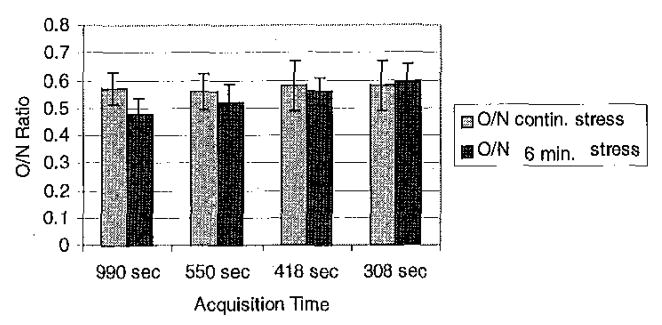
O/N ratios for the parameter estimates in Figures 4–5 are presented in Figures 6 and 7. Note that for all of the dynamic studies, “6 minute stress” refers to stress flows being held for 222 seconds post-injection, as described in the Methods section. Washin provides greater contrast than washout and changes relatively little for different total acquisition times. As expected from Figures 4–5, results from continuous and 6 minute stress protocols are comparable.
Figure 6.
Washin parameter O/N ratios. Only the 990 sec. acquisition for the 6 min. stress case was significantly different (p<0.05) from the true O/N ratio of 0.34.
Figure 7.
Washout (k12) O/N ratios. Only the 990 sec. acquisition for the 6 min. stress case was significantly different (p<0.05) from the true O/N ratio of 0.57.
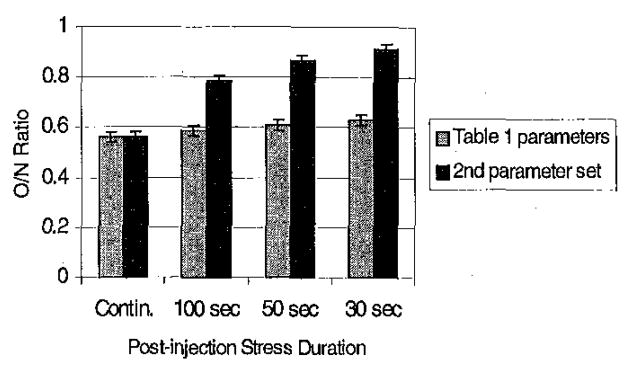
Static O/N ratios are shown in Figure 8. Depending on the uptake and washout in the normal and occluded regions, it is possible with a short stress protocol to achieve results similar to that obtained with a continuous stress study (results not shown). However, it is also possible to do significantly worse, as is the case with both sets of parameters shown in Figure 8. This is the opposite of the expected finding, and is discussed in Section IV.
Figure 8.
O/N ratios for summed data. With the model and parameters used in this paper, it was not possible to improve contrast by switching to rest during image acquisition. All of the ratios were significantly different (p<0.05) from the true O/N ratio of 0.34.
B. Canine Studies
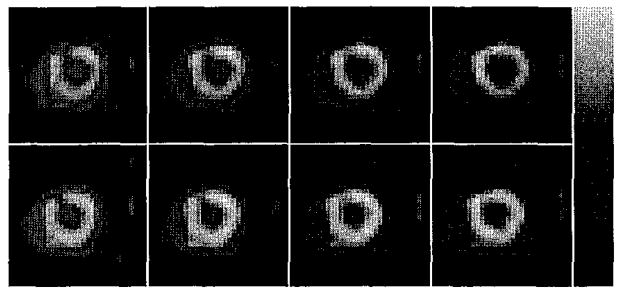
Several static short axis slices from the standard stress protocol and from the continuous infusion are shown in Figure 9.
Figure 9.
Top row: short axis slices from standard 6 min. adenosine protocol (5.5 minutes total scan time, started 147 seconds post-injection of teboroxime). Bottom row: slices from continuous infusion (same scan time and delay).
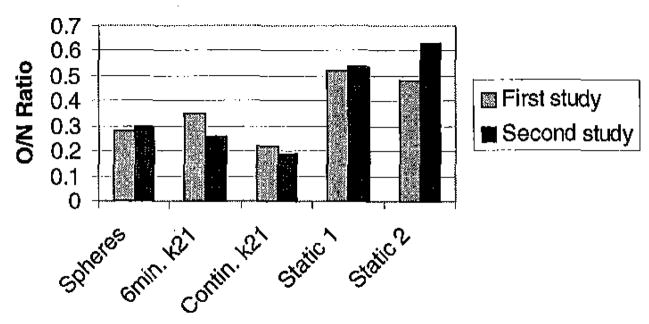
O/N ratios for spheres and for kinetic parameters and static images are shown in Figure 10. Note that the microsphere flows would be expected to be the same regardless of whether a short (6 minute) or continuous adenosine infusion was used. The ratios from the 6 minute infusion were similar to microsphere-derived ratios - the 6 minute infusion method resulted in approximately 15% less contrast (O/N ratio of 0.34 compared to O/N ratio from microspheres of 0.29) for the first study and 9% more contrast for the second study. However, the ratios from the 6 minute adenosine infusion displayed less contrast than from the continuous stress scans.
Figure 10.
O/N ratios for the categories labeled on the x-axis for two dog studies. Static 1 and 2 refer to time delays of 22 and 147 seconds post-injection, respectively.
IV. Discussion
The simulation results show that estimates of the washin parameter k21 are significantly different than the true washin parameter. However, the parameter bias is relatively small - the parameters are altered approximately 7% by changes in flow if stress is maintained for the initial 222 seconds of imaging. Washout k12 estimates in normal regions are more biased. From inspection of Figures 4 and 5, 552 seconds of imaging gave washin and washout parameters with the least bias and low variance. However, the greatest O/N contrast was obtained with parameters estimated from 990 seconds of simulated data. These results depend critically on the kinetic parameters; for example, the occluded regions typically have less bias. The parameters chosen here were taken from dog studies in order to be realistic. In some ways, these parameters represent a worst case, in that the distribution volume (k21/k12) changes significantly between rest and stress. The distribution volume for teboroxime has been reported not to change greatly in humans (1.7±0.4) [6]. The parameters in Table 1 result in a greater change from stress to rest than if a constant distribution volume had been assumed. In another way, however, the parameters used may not fairly test the robustness of comparment modeling with changing flows. Stress k21s from the canine data were 1.75 times resting flows. The average increase in flow in humans with a standard adenosine protocol is 4.4±0.9 [2] and an increase by a factor of 2.7 ± 1.1 in k21 was seen with teboroxime [7]. Results (not shown) from using a 2.7 times increase in flow and a constant distribution volume were not greatly different from the results presented here and in fact showed slightly less bias.
It has been suggested that significantly more contrast may be achieved when “statically” imaging teboroxime by ending adenosine infusion early, as opposed to continuous infusion. The mechanism for the increase in contrast is that the different washout rates seen at stress can equalize; the entire myocardium may have a relatively constant washout rate at were to change more in the occluded region than in the normal region, more contrast could result. Our results indicated that contrast is not improved by such a strategy, because not only washout rates change when stress is ended but the rate of uptake of teboroxime also decreases. While this change in uptake may not be an accurate model of physiology, it is likely that the inaccuracy is only one of degree. Any equalization in washin will tend to decrease improvements in contrast that are afforded by equalization of washout.
The extraction of teboroxime has been reported to vary as a function of time [1]. Extraction during the first minute is relatively constant at 99%. Extraction then declines exponentially to 57% at 5 minutes in rats [1]. These simulations (and the previous work of Smith [6] and Chiao [7]) did not consider the time-varying extraction. The result likely is that washout parameters are much higher than truth. Since work thus far has focused on washin parameters, this shortcoming may not be important for compartment modeling. For static imaging, however, the decreasing extraction fraction may provide a mechanism so that contrast would be increased by the previously discussed scheme of a short stress protocol. That is, if washin occurs mainly in the first minute or two, later reduced washin rates may not degrade contrast.
Teboroxime distribution 70 seconds post-injection has been shown to have a linear relationship with flow up to 4.5 ml/min/g in dogs [5,9]. These flows are higher than the flows used in this work. If this relationship rolled off at lower flows this would represent a change in extraction fraction from stress to rest that is not modeled in our simulations.
Liver uptake can affect clinical teboroxime imaging but was not considered here. The guidelines as to optimal imaging protocols discussed in this paper may need to be modified when liver uptake is considered.
One of the dog studies reported here employed a flow probe on the coronary artery just proximal to the occlusion. The probe data indicated a vasodilation half-life on the order of 50 seconds. This is a longer half-life than reported in humans. A slower transition to rest should only improve the compartment modeling results, but would likely have little effect. We also note that the results from the continuous infusion canine studies are largely anecdotal since the true flows are unknown.
V. Conclusions
Accurate quantification of myocardial blood flow with teboroxime at adenosine stress requires relatively constant blood flow. Decreased flows at later time points result in lower estimates of washin and washout parameters - reflecting a non-linear “average” between the stress and rest states, and provides less stable estimates. However, the impact on k21 parameters may not be clinically significant; a bias of 7% was found with simulated data and a difference on the of 10–15% from microsphere ratios was found in O/N ratios from canine studies.
Estimates of the kinetic parameters can be improved by using longer adenosine infusions, though this increases risk and cost. Inclusion of information regarding the stress the time that the adenosine infusion is turned off is known, one can include that information in the model and estimate two additional kinetic parameters. Since this approach would involve several assumptions, it is unlikely to be more valuable than using e.g. dipyridamole. However, such an approach may have merit in that it could possibly give stress and rest measurements rapidly from a single injection.
For static studies of teboroxime, it was found that contrast was not increased by using a very short period of stress. These results depended on the model and the kinetic parameters used and thus may not reflect what will occur in patients.
Acknowledgments
We would like to acknowledge the assistance of Paul E. Christian, BS and Scott Mc James, BS in obtaining the canine study data.
Footnotes
This work was supported by NIH grant R01 HL50663.
VII. References
- 1.Stewart RE, Schwaiger M, Hutchins GD, Chiao PC, Gallgher KP, Nguyen N, Petry NA, Rogers WL. Myocardial clearance kinetics of technetium-99m-sq30217: a marker of regional myocardial blood flow. J Nucl Med. 1990;31:1183–11990. [PubMed] [Google Scholar]
- 2.Wilson RF, Wyche K, Christensen BV, Zimmer S, Laxson DD. Effects of adenosine on human coronary arterial circulation. Circ. 1990;82:1595–1606. doi: 10.1161/01.cir.82.5.1595. [DOI] [PubMed] [Google Scholar]
- 3.Iskandrian AE. State of the art for pharmacologic stress imaging. In: Zaret, Beller, editors. Nuclear Cardiology. 2. St. Louis: Mosby; 1999. pp. 312–330. [Google Scholar]
- 4.Glover DK, Ruiz M, Bergmann EE, Simanis JP, Smith WH, Watson DD, Beller GA. Myocardial technetium-99m-teboroxime uptake during adenosine-induced hyperemia in dogs with either a critical or mild coronary stenosis: comparison to thallium-201 and regional blood flow. J Nucl Med. 1995;36:476–483. [PubMed] [Google Scholar]
- 5.Beanlands R, Muzik O, Nguyen N, Petry N, Schwaiger M. The relationship between myocardial retention of technetium-99m teboroxime and myocardial blood flow. J Am Coll Cardiol. 1992;20:712–719. doi: 10.1016/0735-1097(92)90029-m. [DOI] [PubMed] [Google Scholar]
- 6.Smith AM, Gullberg GT, Christian PE. Experimental verification of technetium-99m-labeled teboroxime kinetic parameters in the myocardium with dynamic single-photon emission computed tomography: Reproducibility, correlation to flow, and susceptibility to extravascular contamination. J Nucl Cardiol. 1996;3:130–142. doi: 10.1016/s1071-3581(96)90005-7. [DOI] [PubMed] [Google Scholar]
- 7.Chiao PC, Ficaro EP, Dayanikli F, Rogers WL, Schwaiger M. Compartmental analysis of technetium-99m-teboroxime kinetics employing fast dynamic SPECT at rest and stress. J Nucl Med. 1994;35:265–1273. [PubMed] [Google Scholar]
- 8.Di Bella EVR, Ross SG, Kadrmas DJ, Khare HS, Christian PE, Mc James S, Gullberg GT. Compartmental modeling of technetium 99m-labeled teboroxime with dynamic SPECT: comparison to static Tl-201 in a canine model. doi: 10.1097/00004424-200103000-00007. submitted to Circ. [DOI] [PMC free article] [PubMed] [Google Scholar]
- 9.DiRocco RJ, Rumsey WL, Kuczynski BL, Linder KE, Pirro JP, Narra RK, Nunn AD. Measurement of myocardial blood flow using a co-injection technique for technetium-99m-teboroxime, technetium-96-sestamibi and thallium-201. J Nucl Med. 1992;33:1152–1159. [PubMed] [Google Scholar]


