

Abstract
Purpose
Examine changes in demographics of participants and performance trends at the Western States 100-Mile Endurance Run (WSER) since its inception in 1974.
Methods
Name, age, sex, and finish information was obtained on runners in the WSER from 1974 to 2007. Linear regression analyses, ANOVA, and t-tests were used to examine participation and performance trends.
Results
The mean age of participants increased (P < 0.001) to around 45 yr, with men being an average of 3 yr older (P < 0.001) than women. The increase in average age of starters was accounted for by the growth in participation among women ≥40 yr and men ≥50 yr, and by the decreasing participation among men <50 yr. Between 1986 and 2007, there was an increasing participation among women to around 20% of all starters. With this came improved (P < 0.01) finish times for the top 5 overall women and the top 5 women in the 30–39 and 40–49 yr age groups, whereas performances among the men did not improve over this time span. Average ages of the top performers increased (P ≤ 0.002) since 1990 to the upper 30s for both sexes, but the fastest times among men were comparable across the 30–39 and 40–49 yr age groups.
Conclusions
Participation in the WSER has increased among women and older athletes, and the ages of the fastest runners at the WSER have gradually risen to the extent that these runners are older than the ages at which the fastest marathons are run. In contrast to what has been observed for men, finish times have improved for the top women across the last two decades at the WSER.
Keywords: AEROBIC EXERCISE, AGING, ENDURANCE EXERCISE, SEX, SPORT
The Western States 100-Mile Endurance Run (WSER) is a point-to-point foot race on trails of the Sierra Nevada in northern California. Beginning in Squaw Valley at an altitude of 1890 m, the current course ascends nearly 780 m from the valley floor in the first 7 km. From there, the course follows original trails used by the gold and silver miners of the 1850s, ultimately climbing a total of 5500 m and descending a total of 7000 m before reaching the finish in Auburn 100.2 miles (161.3 km) from the start. Most of the route passes through remote and rugged territory reaching a maximum altitude of 2667 m. Snow cover on the early sections of the course, and high temperatures later in the event, often add to the challenges. This run is considered to be one of the most demanding organized running events in the United States.
The origins of the run date back to 1974 when a contestant in a horse race covering a course similar to the current WSER successfully completed the distance on foot after his horse had gone lame before the event (7). At the time, the United States was in the midst of an explosion in the popularity of marathon running (9), but there were very few ultramarathons and a 161-km race over mountain trails was unprecedented. In 1975, the horse race was attempted on foot by another man who dropped out only a few kilometers from the finish. Then, in 1976, the event was successfully completed on foot by a different man. The event was established as an official foot race in 1977 with 16 starters of which only three finished. By 1979, the race was recognized as an international event, and there were over 250 starters by 1980. During these early years, there had been recognition that the course was not a full 161 km, and after some course adjustments, the present course was established for the 1986 event. The course has remained unchanged since that time except for modifications to the early sections of the route during some years because of snow conditions and forest fire damage.
Very little has been published on the demographics of ultramarathon runners (19), trends in participation and performance in ultramarathon running (10,15), and factors related to success in competitions of ultramarathon distances (1,4,5,16). This is in contrast to the marathon (42.2 km), which has been discussed in several books and scientific papers (for instance, see [3,6,12,20]). Given that the WSER is the premier 161-km trail running competition and remains one of the largest and most prominent of these events, an analysis of the event is of interest. Thus, the intent of this work was to summarize historical information about the WSER since its inception over 30 yr ago. We were specifically interested in defining the characteristics of the participants and examining changes in runner demographics and performance since the event was established.
METHODS
This study was approved by our institutional review board with waiver of the requirement for informed consent given that the study involved the analysis of publicly available data.
Data source
Race results posted on the WSER Web site were used to compile a spreadsheet, which included the year of the event, name, sex and age of each starter, and finish time of those who finished. Complete data for all starters were available for the events of 1986 through 2007. However, information before 1986 only included the name, sex and age of finishers, and the total number of starters. No results for 2008 are included in the analyses because the race was canceled because of the proximity of forest fires.
Name, age, and sex discrepancies were reconciled to the extent possible through line-by-line examination of the data. A calculated birth year on the basis of the reported age assisted with this process by allowing names to be grouped by birth year. The names were then examined to identify individuals who were not consistently listed with the same name. Particular attention was directed at identifying name changes associated with marriage or divorce, incorrect name spellings, and the listing of different given names. In some cases, age was missing from the results data. Under these circumstances, attempts were made to determine the runner's age from results for other years the individual had run the WSER or from other publicly available race results. Similarly, when the calculated birth year varied for a given individual, attempts were made to rectify through comparison with other race results.
Statistical analyses
Linear regression analyses were used to assess change across years in the mean ages of starters, the percentage of starters in different age groups for both sexes, the mean age of top 5 finishers of both sexes, and the mean finish times for men and women among the top 5 overall finishers and for all finishers and top 5 finishers within different age groups. The difference in average finish times between the top 5 women and top 5 men as a percentage of the average time for the top 5 men was determined for each year. The difference in finish times between the fifth and first finishers as a percentage of the time for the first finisher (defined as top 5 time spread) was also determined for both men and women for each year. Linear regression models were computed to compare the trends in the latter two variables between men and women. Analyses of top 5 finisher data rather than just that of the fastest finishers were included in analyses to eliminate the extreme variations that could have been caused by exceptional isolated individual performances.
Average finish times and best finish times for each year by sex and age group were computed, and repeated-measures ANOVA was used to compare these average and best times between each pair of age groups separately for both sexes. Tukey's test was used to adjust for multiple comparisons. Ages were compared between finishers and nonfinishers separately for men and women by two unpaired t-tests. Finish rates were computed for each year separately for men and women and subsequently compared between the sexes with a paired t-test. Statistical significance was accepted at P < 0.05.
RESULTS
From 1974 to 2007, there were 6462 total finishes accounted for by 3459 different individuals (551 women and 2908 men). Complete data were obtained for all finishers from 1974 to 1985, and for all starters and finishers from 1986 to 2007 with the exception of ages being unknown for a total of four finishers in the races of 1980 and 1985.
Participation trends
The number of starters each year over the history of the event is shown in Figure 1. There was a rapid rise in the number of starters after 1977, which has remained relatively stable since 1986. Nonetheless, the number of female starters has progressively increased. Women accounted for 10%–12% of the field in 1986–1988 and have accounted for 20%–22% of the field since 2001.
FIGURE 1.
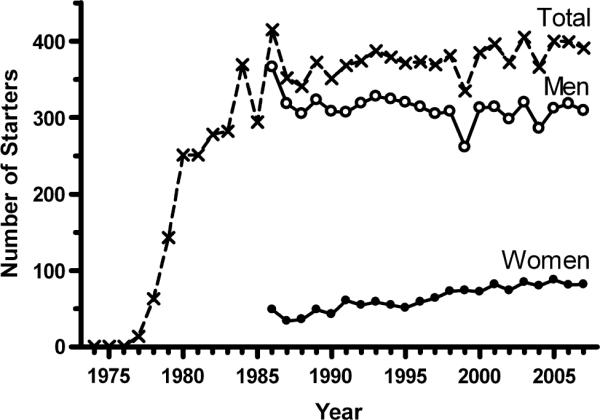
Total number of starters from 1974 to 2007, and number of starters of each sex from 1986 to 2007. Sex-specific starting data are not available before 1986.
The age distribution of starters from 1986 to 2007 is displayed in Figure 2. Ages of the starters have ranged from 18 to 75 yr. Mean ± SD ages were 44.4 ± 9.0 and 41.7 ± 8.0 yr for men and women, respectively. The 5-yr age bracket with the largest participation has been 40–44 yr for both sexes.
FIGURE 2.
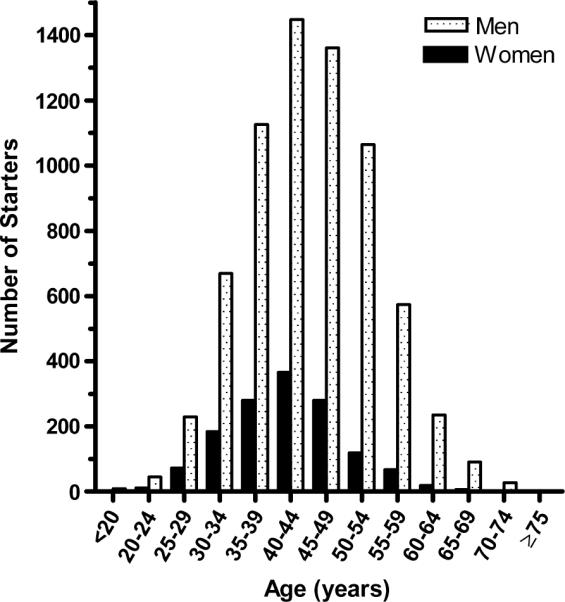
Age distribution of starters from 1986 to 2007.
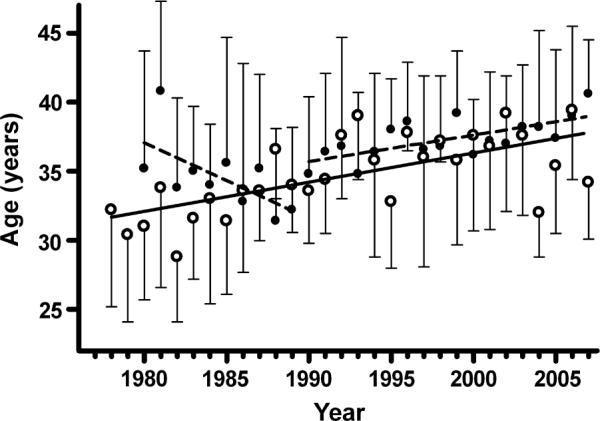
The average age among all starters gradually increased (P < 0.001) since 1986 at a rate of 0.22 yr of age per calendar yr (Fig. 3). Men averaged 41 yr of age in 1986 and 45–47 yr between 2000 and 2007. Women were approximately 3 yr younger (P < 0.001) than men and had no difference (P = 0.90) from the men in the rate of change of average age across this time span. The increase in the average age of participants was accounted for by growth in participation among women ≥40 yr of age, increasing participation among men ≥50 yr of age, and decreasing participation among men <50 yr of age (Fig. 4).
FIGURE 3.
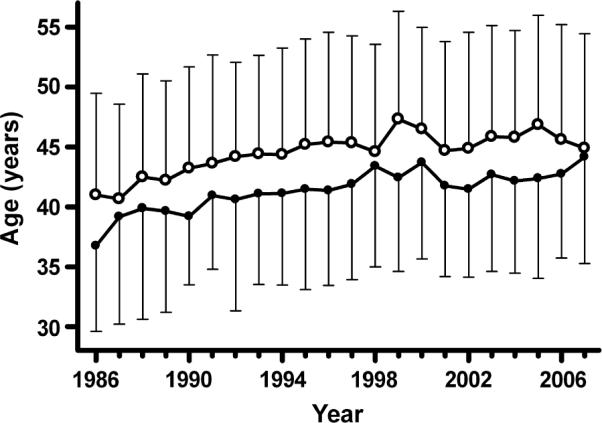
Mean ages of starters across the period of 1986 through 2007. Men are represented by open circles, and women are represented by closed circles. Brackets represent 1 SD and are displayed in only one direction for clarity.
FIGURE 4.

Linear regressions defining the percentages of starters within different age groups across the period of 1986 through 2007. Solid lines represent conditions where the slopes of the linear regressions were significantly different (P < 0.05) from zero. Dashed lines are indicative of slopes that were not significantly different from zero.
Across the years of 1974 through 2007, those runners who had completed the WSER had done so an average of 1.9 times. Yet, a total of 2184 individuals (63.1% of all finishers; 350 women and 1834 men) had only finished the run one time (Fig. 5). The number of runners who had finished more than once follows a fairly smooth curvilinear decrease with one woman having finished the run 14 times and 8 different men having finished between 15 and 25 times.
FIGURE 5.
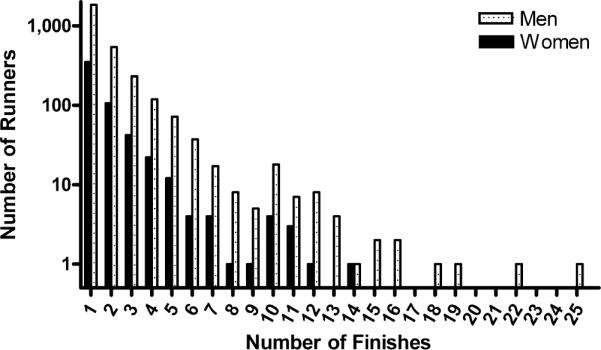
Frequency distribution of number of finishes for those individuals having finished the run from 1974 to 2007. Note that the vertical axis is on a log scale.
Performance trends
Overall yearly finish rates have ranged from 48% to 80% since 1978 (Fig. 6). Throughout the period of 1986 through 2007, the overall finish rate for men (mean = 64%, range = 51%–79%) was comparable (P = 0.21) to that for women (mean = 62%, range = 42%–82%).
FIGURE 6.
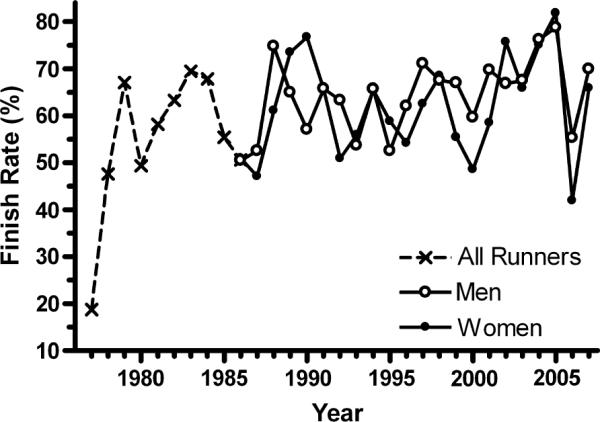
Finish rates from 1977 to 2007. Sex-specific finish rates were not available until 1986, so overall finish rates are displayed from 1977 through 1985.
Finishers have ranged in age from 18 to 71 yr. For both men and women, the finishers averaged 3 yr younger (P < 0.001) than the nonfinishers over the time span of 1986 through 2007.
The distribution of finish times from 1986 to 2007 is shown in Figure 7. With a best time of 15:36:27 and two other finishes during the 16th hour of the race, there was a progressive increase in number of finishers each hour until 24 h, followed by a dramatic drop-off in number of finishers the next hour, and then a steady increase each hour until 30 h.
FIGURE 7.
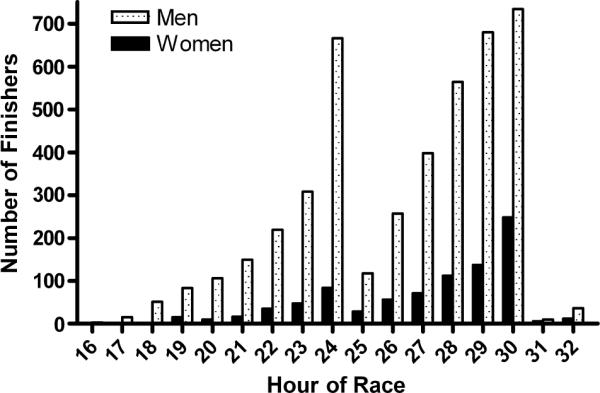
Distribution of finish times for years 1986 through 2007. Men are represented by stippled bars; women are represented by solid bars. The small number of finishers between 30 and 32 h was because cutoff times were extended to 32 h in 1995 and 1998 because of heavy snow on the early portion of the course.
Across the period of 1986 through 2007, mean finish times among all finishers appeared to increase reasonably linearly with age for both men and women (Fig. 8). However, ANOVA revealed that there were no significant differences in finish times between the <30 and the 30–39 yr age groups for either sex. In contrast, comparison of the best time each year across age groups showed a different pattern. The best times among the women were produced by the 30–39 yr age group, and the mean finish time for each age group was significantly different (P < 0.05) from each of the other age groups. However, examination of the best times among the men revealed that the 40–49 yr age group was no different from the <30 yr and the 30–39 yr groups, but each other pairwise comparison was statistically different.
FIGURE 8.
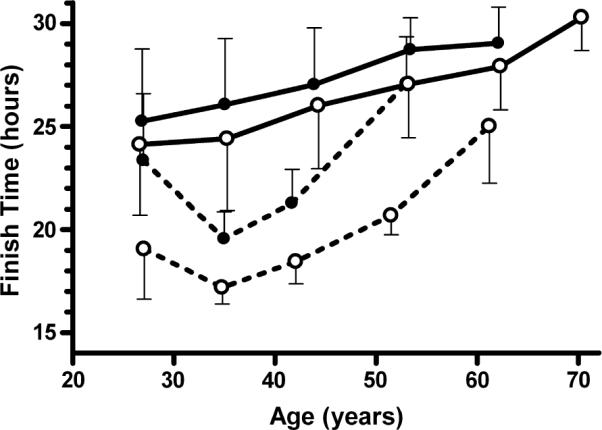
Mean finish times as a function of age group (<30, 30–39, 40–49, 50–59, 60–69, and ≥70 yr) for men (open circles) and women (closed circles), considering the average for all finishers (solid lines) as well as the fastest finishes (broken lines) for each year. Data are for 1986 through 2007, plotted at the mean age of those considered within each age group. Brackets represent 1 SD and are displayed in only one direction for clarity. Data displayed for the ≥70 men represent a total of four finishes in 2 yr.
The mean ages of the top 5 overall men and women finishers are shown in Figure 9. Ages for the top 5 men have increased over the history of the race from around 30 yr to generally being in the upper 30s (slope = 0.21, P < 0.001). Although the average ages of the top 5 women seemed to be slightly higher than for the men in the early 1980s and decreased (slope = −0.55, P = 0.045) through the decade, the ages of the top 5 women have gradually increased since 1990 (slope = 0.19, P = 0.0015) in a similar pattern as for the men to reach the upper 30s in recent years.
FIGURE 9.
Mean ages of top 5 overall men and women finishers from 1978 for men (open circles) and 1980 (first year with more than five women finishers) for women (closed circles). Brackets represent 1 SD and are displayed in only one direction for clarity. Solid line represents the linear trend for men (slope = 0.21, r2 = 0.43, P < 0.001). The two broken lines represent linear trends for women across the time ranges of 1980 through 1989 (slope = −0.55, r2 = 0.41, P = 0.045) and 1990 through 2007 (slope = 0.19, r2 = 0.48, P = 0.0015).
Trends in finish times among the top 5 men and women overall finishers are shown in Figure 10. The men showed no change in finish times between 1979 and 2007. However, the women improved (P = 0.0006) by 37 min per decade over the time span of 1980 through 2007. As such, differences in average finish times between the top 5 women and top 5 men as a percentage of the average time for the top 5 men also diminished (P = 0.0002) at a rate of 4% per decade to around 14% in 2007.
FIGURE 10.

Mean finish times for the top 5 overall finishers across time (top panel) and differences in average finish times between the top 5 women and top 5 men as a percentage of the average time for the top 5 men (bottom panel). In the top panel, data are presented from 1978 for men and 1980 for women, which were the first years in which there were more than five finishers from either sex. The linear regression curve for the women was defined by the equation y = −0.062x + 144.9 (r2 = 0.37, P = 0.0006); the curve for the men had a slope that was not significantly different from zero. In the bottom panel, the linear regression curve was defined by the equation y = −0.402x + 821.1 (r2 = 0.43, P = 0.0002). Data before 1986 (when the course was less than a full 161 km) were included because other yearly variations in performance seemed to have greater effects on finish times than the modifications in the course.
Figure 11 shows the trends in finish times for the top 5 and all finishers subdivided by different age groups across the years 1986 through 2007. Whether considering mean top 5 finish times or the finish times among all finishers, there were no significant changes across years within any age group for men. In contrast, the average finish times for the top 5 women improved between 1986 and 2007 in both the 30–39 yr (slope = −0.101, P = 0.003) and the 40–49 yr (slope = −0.142, P = 0.001) age groups. Furthermore, the mean finish times among all women in the 30–39 yr age group also showed improvement over this time span (slope = −0.054, P = 0.02), although there was a slowing of finish times among the <30 yr age group (slope = 0.158, P = 0.04).
FIGURE 11.

Mean finish times by year for top 5 finishers (upper panels) and all finishers (lower panels) in each age group for women (left side) and men (right side). Solid lines represent conditions where the slopes of the linear regressions were significantly different (P < 0.05) from zero. Dashed lines indicate the slopes of the linear regressions were not significantly different from zero. Top 5 data were considered when there were ≥10 finishers in the age group, and the all-finisher data were considered when there were ≥5 finishers in the age group. Lines traverse only the range of years for which data were considered.
Trends in top 5 time spreads are shown in Figure 12. When examined across the entire history of the race, the slopes of this relationship, for both the men and the women, were not different from zero. However, at year 1980 (the first year for which this quantity was computed for women, and the year of minimum difference between these relationships), the value for women was 7 percentage points higher (P < 0.05) than for men (20% rather than 13%). When the trend from 1990 to 2007 for the women was computed, there was a significant decrease across time (P = 0.003). At year 2007, the difference in top 5 time spread between men and women was not statistically significant.
FIGURE 12.
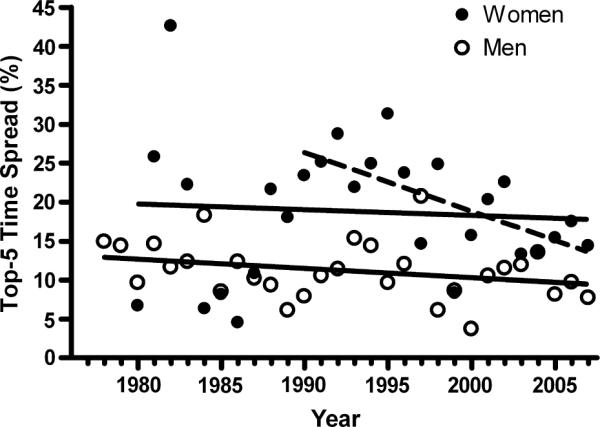
Top 5 time spreads for men and women across time. Data are shown from 1978 for men and 1980 for women (first years with more than five finishers for either sex) with linear regressions across this time span shown by the solid lines. The slopes for both curves were not different from zero (P = 0.12 for men, P = 0.72 for women), but the top 5 time spread for women in 1980 was 7 percentage points higher (P < 0.05) than for men. The dashed line is the linear regression for women between 1990 and 2007, where time spread decreased by 0.75 percentage points per annum (P = 0.003).
DISCUSSION
The Western States Endurance Run is the premier 161-km trail running race. Whereas multiple-day “pedestrian” races in the United States date back to the 1800s (2,11,12), the WSER is thought to be the first event of this distance traversing mountain trails. From its inadvertent origins in 1974, the race quickly grew, and participation would have continued to expand had restrictions not been placed on the event because the course crosses a designated national wilderness area. In fact, approximately 1350 applications were received for fewer than 400 starting spots in the 2008 event. Although the WSER is no longer the largest 161-km running event in the United States, it is the oldest and the most recognized. It is still regarded as one of the more challenging events of this distance in the world.
Starters of the WSER have ranged in age from 18 to 75 yr, and finishers have ranged from 18 to 71 yr. Between these extremes, the ages of starters are close to normally distributed, and the largest number of runners has been in the 40–49 yr age range. This is comparable to the findings from a limited analysis of participation in ultramarathon runs across a variety of distances in 1982 and 1991 (10). However, the findings differ from what has been observed in shorter road races. For instance, in the New York City Marathon, the largest marathon in the world, the greatest proportion of finishers in 2006 and 2007 was in the 30–39 yr age group (18). Furthermore, among all road races in the United States, the greatest proportion of finishers has been in the 30–39 yr age group during this decade (14).
The average age of participants in the WSER has increased since 1986. For instance, the men averaged around 41 yr of age in 1986 and 1987, and age gradually increased to a plateau of 45–47 yr in 1995. Women have typically averaged approximately 3 yr younger than men but have shown the same trend of an increase in average age over time. This increasing age has largely been accounted for by growth in participation among the older age groups (≥40 yr for women and ≥50 yr for men) and by decreases in participation among men <50 yr old. Examination of data from finishers of all marathons in the United States reveals parallels with the WSER. For marathons, the mean ages of men and women increased respectively from 34 and 31 yr in 1980 to 40 and 36 yr in 2007 (13). Thus, the average age of WSER participants has increased comparably to that for marathon participants, women tend to average 3–4 yr younger than men in the WSER and marathons, and WSER finishers have remained a few years older than marathon finishers across the last two decades.
Participation among women in the WSER has steadily increased since the inception of the event. Whereas they accounted for only 10%–12% of the starters in the late 1980s, women now account for 20%–22%. In contrast, participation by women in road races up to the marathon distance has grown more rapidly than in the WSER. For instance, women accounted for 10.5% of finishers among all marathons in the United States in 1980 and 40% in 2007 (13). Similarly, among all road races in the United States, 21% of the finishers were women in 1987, whereas the percentage was nearly 50% in 2007 (14). Thus, relative to road races up to the marathon distance, the participation among women in the WSER remains relatively low.
WSER participants who finish the race in less than 24 h are awarded a silver belt buckle, whereas those who finish between 24 h and the cutoff time (30 h except for 1995 and 1998 when the time was increased to 32 h because of snow conditions) are awarded a bronze buckle. The distribution of finish times demonstrates the marked effect of these cutoff times (Fig. 7). Whether starters set one of these times as a personal goal before the start of the event or adjusted their goal during the event, the focus on breaking the 24- and 30-h marks is evident. In addition, the distribution of number of WSER finishes shows a relatively greater number of runners have finished 10 times than the general trend would predict for this number of finishes (Fig. 5). This is probably because of the special recognition that individuals receive who have achieved this number of finishes.
Average finish times in the WSER among all finishers between 1986 and 2007 increased fairly linearly with age for both men and women. However, the fastest times did not follow this pattern. The fastest times, averaged during the 22 yr, were slower in the <30 yr age bracket than the 30–39 yr age bracket for both sexes. The fastest times were in the 30–39 yr age group among women and spanned the 30–39 and 40–49 yr age brackets among men. Data are available for comparison with two other endurance events, the marathon and the Olympic distance triathlon (1.5-km swim, 40-km cycle, 10-km run), both of which are typically performed in less than one-seventh of the amount of time as the WSER. Jokl et al. (6) examined the finish time data for the top 50 finishers in each age group of the New York City Marathon between 1983 and 1999 and found that, regardless of sex, times either were comparable for the 20–29 and 30–39 yr age groups or were slightly slower for the younger group, followed by a curvilinear increase in times over the older age groups. Furthermore, review of the United States all-time best marathon performances (21,22) reveals that the fastest times have typically been achieved at ages of 25 to 35 yr. In contrast, an analysis of top 10 finish times in each age group at the Olympic distance triathlon World Championships in 2006 and 2007 demonstrated that top-level performances were maintained to 40 yr for women and to 45 yr for men (17). Thus, it appears that the fastest finish times extend into slightly older ages at the WSER compared with the marathon but are comparable to what has been observed for the Olympic distance triathlon.
In addition to comparing best finish times across different age groups, we looked for trends in the age of top performers across the history of the WSER. The average age of the top 5 finishers at the WSER has typically remained within the 30–39 yr range since 1978 (Fig. 9). However, the average age of the top 5 finishers has increased over the history of the event from the early 30s to the upper 30s. This rate of increase in average age of the top 5 finishers is comparable to the increase in average age of all starters (approximately 0.2 yr in age per calendar yr). Thus, not only has the WSER been attracting an increasingly older group of participants, but the ages of the best runners have also been gradually increasing.
From 1986 to 2007, the WSER course has remained essentially unchanged. During these years, the yearly finish rates varied between 51% and 80% and were similar for men and women when compared without consideration of age or other individual characteristics (Fig. 6). On the whole, men have been faster than women when compared across age groups whether considering the entire group of finishers or the fastest finishers for each year (Fig. 8). Yet, the performance gap between men and women has been narrowing.
Finish times for the men, whether for the top 5 finishers among all men or within different age groups, did not change between 1986 and 2007 (Figs. 10 and 11). In contrast, finish times improved for women who placed in the top 5 among all women (Fig. 10, top), in the top 5 within the 30–39 and 40–49 yr age groups (Fig. 11, top left), and among all women in the 30–39 yr age group (Fig. 11, bottom left). As a result, the women finishing in the top 5 overall averaged 25% slower than the corresponding group of men in 1980 but were only 14% slower in 2007. This 14% difference between men and women in average top 5 finish times at the 2007 WSER is comparable to the 12% differences between the sexes in average top 5 finish times for both the 2007 Hawaii Ironman and the 2007 New York City Marathon.
Across the history of the WSER, the fastest women have narrowed the performance gap relative to the fastest men by approximately 4% per decade. This is comparable to the relative improvement of 2.8% per decade for the top 10 women over the top 10 men in the run portion of the Hawaii Ironman Triathlon across the time span of 1988 to 2007 (8). Although the total time for the Ironman is approximately half that for the WSER and the run portion, at 42 km, is much shorter than the WSER, the fact that the run follows a 3.8-km swim and 180-km cycle may help account for the similar findings.
The improvements in finish times among the fastest women along with the relative improvement for the women compared with men may reflect advances for the women in training programs, an accumulation of experience at such events, and a general increase in the level of competition associated with the larger number of women starters. As a measure of the depth of the highest level of competition at the WSER, we examined trends in the difference in finish times between the fifth and first finishers. The concept of this measure is attributed to Lepers (8) and his analysis of Hawaii Ironman Triathlon results where he referred to the proportional difference between the 10th and 1st finishers as the “performance density.” We chose to refer to this entity as a “time spread” and examined the difference between fifth and first because fewer people participate each year in the WSER than in the Hawaii Ironman. We anticipated a decrease in the top 5 time spread among women and found this to be the case when the regression model was limited to the period between 1990 and 2007. In this model, the time spread in 2007 was not significantly different for women than for men. This is similar to the finding of Lepers (8) for the Hawaii Ironman in that he showed the top 10 performance densities for men and women to approach the same value across the period between 1988 and 2007.
This work summarizes characteristics of participants in the premier 100-mile trail running event and the way these characteristics have changed over the history of the event. There has been increasing participation among older athletes (≥40 yr of age for women, ≥50 yr of age for men) and increasing participation among women, which has been associated with improvements in finish times and depth of competition among the top women. The age of the fastest runners at the WSER has risen into the upper 30s, which seems to be slightly older than the age range at which the fastest marathon times are attained.
Acknowledgments
This publication was made possible by grant number UL1 RR024146 from the National Center for Research Resources, a component of the National Institutes of Health (NIH), and NIH Roadmap for Medical Research. This work was also supported by the Western States Endurance Run Foundation. The results of the present study do not constitute endorsement by ACSM.
REFERENCES
- 1.Bam J, Noakes TD, Juritz J, Dennis SC. Could women outrun men in ultramarathon races? Med Sci Sports Exerc. 1997;29(2):244–7. doi: 10.1097/00005768-199702000-00013. [DOI] [PubMed] [Google Scholar]
- 2.Brannen D, Milroy A. Across America on foot: The Bunion Derbies of 1928 and 1929. In: Allison D, editor. A Step Beyond: A Definitive Guide to Ultrarunning. UltraRunning Publishers; Weymouth (MA): 2004. pp. 280–9. [Google Scholar]
- 3.Coyle EF. Physiological regulation of marathon performance. Sports Med. 2007;37(4–5):306–11. doi: 10.2165/00007256-200737040-00009. [DOI] [PubMed] [Google Scholar]
- 4.Hoffman MD. Ultramarathon trail running comparison of performance-matched men and women. Med Sci Sports Exerc. 2008;40(9):1681–6. doi: 10.1249/MSS.0b013e318177eb63. [DOI] [PubMed] [Google Scholar]
- 5.Hoffman MD. Anthropometric characteristics of ultramarathoners. Int J Sports Med. 2008;29:1–4. doi: 10.1055/s-2008-1038434. [DOI] [PubMed] [Google Scholar]
- 6.Jokl P, Sethi PM, Cooper AJ. Master's performance in the New York City Marathon 1983–1999. Br J Sports Med. 2004;38(4):408–12. doi: 10.1136/bjsm.2002.003566. [DOI] [PMC free article] [PubMed] [Google Scholar]
- 7.Klein N. The history of Western States: journey through the 24-year history leading to the silver anniversary of the ultimate ultra trail race. Marathon and Beyond. 1998;2(3):26–51. [Google Scholar]
- 8.Lepers R. Analysis of Hawaii Ironman performances in elite triathletes from 1981 to 2007. Med Sci Sports Exerc. 2008;40(10):1828–34. doi: 10.1249/MSS.0b013e31817e91a4. [DOI] [PubMed] [Google Scholar]
- 9.Maron MB, Horvath SM. The marathon: a history and review of the literature. Med Sci Sports. 1978;10(2):137–50. [PubMed] [Google Scholar]
- 10.McKenzie P. When do ultrarunners stop running ultras? Ultrarunning. 1992;11(10):31. [Google Scholar]
- 11.Milroy A. Captain Barclay: nineteenth century super ultrarunner. In: Allison D, editor. A Step Beyond: A Definitive Guide to Ultrarunning. UltraRunning Publishers; Weymouth (MA): 2004. pp. 258–63. [Google Scholar]
- 12.Noakes T. Lore of Running. 4th ed. Oxford University Press; South Africa: 2003. pp. 460–7. [Google Scholar]
- 13.Running USA Inc Web site [Internet] Running USA—Road Running Information Center Annual Marathon Report; Ventura (CA): 2007. [cited 2008 Dec]. Available from: http://www.runningusa.org/cgi/mar_repts.pl. [Google Scholar]
- 14.Running USA Inc Web site [Internet] Running USA—Road Running Information Center Trends and Demographics. State of the Sport; Ventura (CA): 2008. [cited 2008 Dec]. Available from: http://www.runningusa.org/cgi/trends.pl. [Google Scholar]
- 15.Siguaw S. Finishing and racing 100 miles: a statistical analysis. Ultrarunning. 1990;9(9):22–3. [Google Scholar]
- 16.Speechly DP, Taylor SR, Rogers GG. Differences in ultraendurance exercise in performance-matched male and female runners. Med Sci Sports Exerc. 1996;28(3):359–65. doi: 10.1097/00005768-199603000-00011. [DOI] [PubMed] [Google Scholar]
- 17.Sultana F, Brisswalter J, Lepers R, Hausswirth C, Bernard T. Effet de l'âge et du sexe sur l'énvolution des performances en triathlon olympique (Effects of age and gender on Olympic triathlon performances) Sci Sports. 2008;23:130–5. [Google Scholar]
- 18.The ING New York City Marathon Web site [Internet] The ING New York City Marathon Results; New York (NY): [cited 2008 Dec]. Available from: http://www.nycmarathon.org/results/index.php. [Google Scholar]
- 19.Thompson W, Nequin N. Ultrarunners—who are they? Ultrarunning. 1983;3(5):22–3. [Google Scholar]
- 20.Trappe S. Marathon runners: how do they age? Sports Med. 2007;37(4–5):302–5. doi: 10.2165/00007256-200737040-00008. [DOI] [PubMed] [Google Scholar]
- 21.USA Track and Field Web site [Internet] USA Track and Field. U.S. All-time list—marathon, men; Indianapolis (IN): [cited 2008 Dec]. Available from: http://www.usatf.org/statistics/all-time/Marathon/men.asp. [Google Scholar]
- 22.USA Track and Field Web site [Internet] USA Track and Field. U.S. All-time list—marathon, women; Indianapolis (IN): [cited 2008 Dec]. Available from: http://www.usatf.org/statistics/all-time/Marathon/women.asp. [Google Scholar]