Abstract
The authors are developing a computer-aided detection (CAD) system for masses on digital breast tomosynthesis mammograms (DBT). Three approaches were evaluated in this study. In the first approach, mass candidate identification and feature analysis are performed in the reconstructed three-dimensional (3D) DBT volume. A mass likelihood score is estimated for each mass candidate using a linear discriminant analysis (LDA) classifier. Mass detection is determined by a decision threshold applied to the mass likelihood score. A free response receiver operating characteristic (FROC) curve that describes the detection sensitivity as a function of the number of false positives (FPs) per breast is generated by varying the decision threshold over a range. In the second approach, prescreening of mass candidate and feature analysis are first performed on the individual two-dimensional (2D) projection view (PV) images. A mass likelihood score is estimated for each mass candidate using an LDA classifier trained for the 2D features. The mass likelihood images derived from the PVs are backprojected to the breast volume to estimate the 3D spatial distribution of the mass likelihood scores. The FROC curve for mass detection can again be generated by varying the decision threshold on the 3D mass likelihood scores merged by backprojection. In the third approach, the mass likelihood scores estimated by the 3D and 2D approaches, described above, at the corresponding 3D location are combined and evaluated using FROC analysis. A data set of 100 DBT cases acquired with a GE prototype system at the Breast Imaging Laboratory in the Massachusetts General Hospital was used for comparison of the three approaches. The LDA classifiers with stepwise feature selection were designed with leave-one-case-out resampling. In FROC analysis, the CAD system for detection in the DBT volume alone achieved test sensitivities of 80% and 90% at average FP rates of 1.94 and 3.40 per breast, respectively. With the 2D detection approach, the FP rates were 2.86 and 4.05 per breast, respectively, at the corresponding sensitivities. In comparison, the average FP rates of the system combining the 3D and 2D information were 1.23 and 2.04 per breast, respectively, at 80% and 90% sensitivities. The difference in the detection performances between the 2D and the 3D approach, and that between the 3D and the combined approach were both statistically significant (p=0.02 and 0.01, respectively) as estimated by alternative FROC analysis. The combined system is a promising approach to improving automated mass detection on DBTs.
Keywords: digital breast tomosynthesis, computer-aided detection, masses, SART
INTRODUCTION
In conventional mammography, the sensitivity of cancer detection is often limited by the presence of overlapping dense fibroglandular tissue in the breast. The dense parenchyma reduces the conspicuity of the abnormalities, which is one of the main causes of missed breast cancer.1 In addition, the overlapping dense tissue may mimic lesions, which often leads to unnecessary workup or biopsy. New breast imaging modalities such as digital breast tomosynthesis mammography (DBT) or breast computed tomography are being developed to alleviate these problems. In DBT, a series of projection view (PV) images is acquired as the x-ray source is rotated about the fulcrum over a limited range of angles. Because of the wide dynamic range and high detective quantum efficiency of digital detectors, each of the PV images can be acquired with a fraction of the x-ray exposure used for a regular mammogram. The total dose required for DBT may therefore be kept at nearly the same or only slightly higher than that of a regular mammogram. Tomographic slices focused at any depths of the imaged volume can be generated with reconstruction techniques from the series of PV images. The DBT slices provide quasi-three-dimensional (3D) structural information and may reduce the camouflaging effects of fibroglandular tissues. DBT is one of the promising methods that may improve the sensitivity and specificity for breast cancer detection, especially in dense breasts.2, 3, 4, 5
Although DBT may offer higher sensitivity than regular mammograms, the number of images that radiologists have to read for a DBT examination increases dramatically. With a well-designed display system for viewing the DBT slices, the reading time for each DBT slice will be much less than that for a corresponding mammogram. However, the overall increase in workload will still be substantial and the chance for oversight of subtle lesions may not be negligible. Computer-aided detection (CAD) has been shown to improve breast cancer detection in mammography.6, 7, 8 CAD will potentially play an important role in DBT interpretation. Several groups have been developing CAD systems for DBT.9, 10, 11, 12, 13, 14, 15, 16 However, the developments are still at an early stage because the availability of patient DBT cases is very limited for this new modality.
During a DBT scan, the small shifts in the projection angles among the PVs will change the perspective of the overlapping tissues in the images. A mass superimposed with glandular tissues in some PVs may be better visualized in the other PVs. This offers the possibility of improving detection and diagnosis by either human or CAD systems if information from all PVs is combined. Therefore, for development of CAD systems for DBT, there are two basic approaches. One approach uses the reconstructed DBT slices as input. The multiple-PV information is combined by tomosynthesis reconstruction before image analysis. The image quality of the reconstructed DBT slices, and thus the performance of the CAD system, will depend on the reconstruction algorithms and the parameters used. Another approach is to use the individual PVs as input. Image information is extracted from the individual PVs and then the information from all PVs is merged. The latter approach may not be practical for human readers but can be advantageous for CAD systems. First, current CAD algorithms developed for regular mammograms can be applied to the PVs, and only an information fusion scheme will need to be designed to complete the process. Second, the CAD system using PVs as input will be independent of the reconstruction method and thus more easily to be adapted to DBT systems from different manufacturers.
We have previously developed a prototype CAD system for mass detection using the 3D volume from the reconstructed DBT as input and compared its performance with that using the two-dimensional (2D) PV as input in a preliminary study.9, 10, 11 Using a small data set of 26 DBT mammograms, the detection accuracy obtained by the 3D approach appeared to be higher than that by the 2D approach. In a recent study,14 we obtained a detection sensitivity of 80% and 90% at an average false positive (FP) rate of 1.6 and 3.0 per breast volume, respectively, using a 3D approach in a DBT data set from 52 breasts. Reiser et al.15 conducted a preliminary study with a data set of 21 DBT breast volumes. They performed detection and feature extraction on the reconstructed slices and 3D volume and obtained a detection sensitivity of 76% at 11 FPs per breast volume. In a later study, Reiser et al.16 investigated a 2D approach of performing mass detection on the PV views using the same data set of 21 DBT volumes with masses and another 15 without masses. They obtained a sensitivity of 90% at an average FP rate of 1.5 per breast volume. Although the major image processing steps of these or other CAD systems are similar, the specific lesion detection and feature extraction techniques developed by different research groups and for different applications are different. Since the data sets used in these feasibility studies were small, the reported performance could not be directly compared. The purpose of the current study is to compare the 2D and 3D approaches using a larger common data set. In addition, the performance of a combined CAD system that merges the information from the 3D CAD system with that from the 2D CAD system will be evaluated with the same data set.
MATERIALS AND METHODS
Data set
In this study, we used a data set of 100 DBT cases acquired with a GE first generation prototype DBT system in the Breast Imaging Research Laboratory at the Massachusetts General Hospital with the approval of the Institutional Review Board. Patients were recruited with written informed consent. Eligible patients were those who were found to have a suspicious lesion during their clinical care and no normal subjects were recruited. The DBT system has a flat panel CsI∕a:Si detector with a pixel size of 0.1 mm×0.1 mm. It acquired 11 PVs in 5-deg increments over a 50-deg arc. The protocol was to take a mediolateral oblique (MLO) view DBT of the breast with the suspicious lesion so that each case contained only a single MLO view. The total dose for the 11 PVs was designed to be about 1.5 times that of a single standard film mammogram. We reconstructed the DBT slices using the simultaneous algebraic reconstruction technique (SART).17 The reconstructed slices had a pixel size of 0.1 mm×0.1 mm and a slice interval of 1 mm. Each DBT volume had a mass of concern so that there were a total of 100 masses (69 malignant and 31 benign) in this data set. The location of the mass in each case was identified by an experienced Mammography Quality Standards Act approved radiologist. The radiologist marked the “central” slice, defined as the slice on which the mass was most conspicuous, and estimated the mass size as the longest diameter on the central slice. The top and the bottom slices where the mass became almost invisible were marked as the top and bottom of a rectangular volume of interest (VOI) enclosing the mass. The radiologist also provided an estimate of the breast density. Since there is not yet a breast imaging reporting and data system (BI-RADS) density category designed for DBT mammograms, the four BI-RADS category designed for regular mammograms was used.
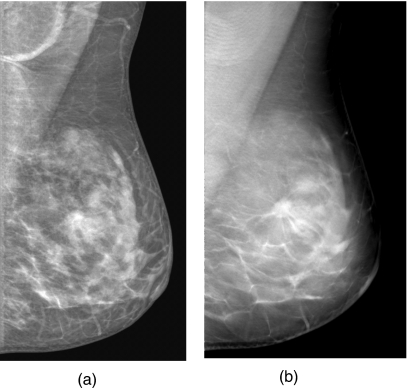
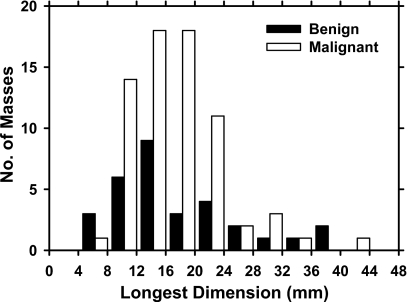
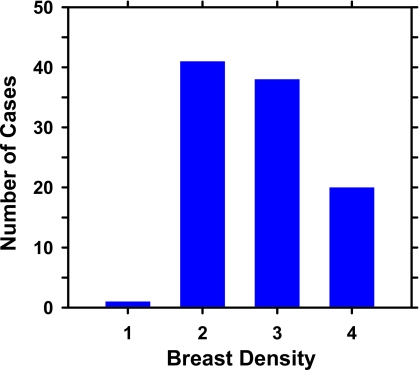
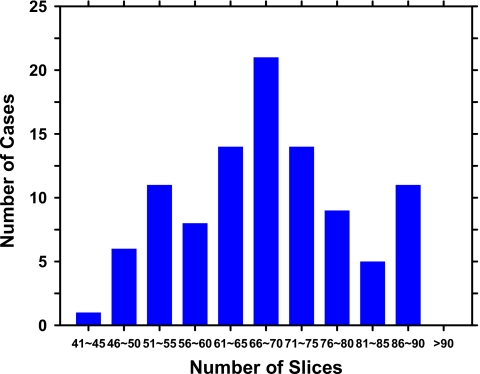
An example of a DBT mammogram with a spiculated mass is demonstrated in Fig. 1, in which the PV at 0 deg and a SART reconstructed slice approximately through the center of the mass are shown. The distributions of the malignant and benign mass sizes are shown separately in Fig. 2. The mass size ranged from 5.5 to 43.4 mm (mean=17.4 mm, median=15.9 mm). The distribution of the breast densities is shown in Fig. 3. Most of the breasts are in BI-RADS categories 2 and 3. The distribution of the number of slices in the reconstructed DBT volume is shown in Fig. 4.
Figure 1.
An example of DBT mammogram with a spiculated mass. (a) The multiscale-enhanced projection view image at 0 deg. (b) An SART-reconstructed slice intersecting approximately the center of the mass.
Figure 2.
Distributions of the longest diameter of the malignant and benign masses estimated on the central slice for the reconstructed DBT volumes in the data set.
Figure 3.
Distribution of breast density of the cases in the data set. Breast densities are described in terms of the four BI-RADS categories.
Figure 4.
Distribution of the number of reconstructed DBT slices for the breast volumes in the data set. The DBTs were reconstructed at 1-mm slice spacing.
CAD system for DBT volume
Our mass detection scheme for DBT mammograms has been described previously.11 Briefly, detection of potential mass lesions is performed in the reconstructed 3D breast volume by several processes: (1) preprocessing (2) prescreening of mass candidates by 3D gradient field analysis, (3) segmentation of mass candidates by 3D region growing, (4) feature extraction, and (5) estimation of 3D mass likelihood score. For a given input DBT mammogram, the breast region is segmented from the each slice using a breast boundary detection algorithm. To reduce noise in the gradient calculation, the image slices are smoothed by a 4×4-pixel box filter and subsampled to 400 μm×400 μm pixel size. Three-dimensional gradient field analysis is applied to the breast volume to enhance regions of high gradient relative to the local background as follows. First, for a given voxel c(i) in the volume, 5-voxel-wide concentric shells centered at c(i) are defined in a region of about 12 mm in radius. At a given shell of average radius k, R(k), and a given radial direction from c(i), the gradient vector at a voxel along the radial line is computed and the unit vector in the direction of the gradient vector is projected onto the radial direction. The projected gradient unit vector at R(k) in this radial direction is obtained by averaging over the voxels along this direction within the shell and taking the maximum of the corresponding values among three adjacent shells R(k−1), R(k), and R(k+1). The gradient field convergence of a given shell is then estimated as the average of the projected gradient unit vectors in the shell over all radial directions. Finally, the gradient field convergence at c(i) is determined as the maximum of the gradient field convergence values among all shells centered at c(i). The gradient field convergence calculation is performed over all voxels in the breast region, resulting in a 3D gradient field image. A maximum of 30 sites with the highest gradient field convergence values are identified as the potential mass candidates in the volume.
VOI of 256×256×25 voxels are then identified in the breast volume (voxel size: 0.1 mm×0.1 mm×1 mm) with the center of each VOI placed at each location of high gradient convergence. The object in each VOI is segmented by a 3D region growing method in which the location of high gradient convergence is used as the starting point and the object is allowed to grow across multiple slices. In this study, region growing is guided by the radial gradient magnitude. The growth of the object is terminated when the average radial gradient magnitude around the object surface reaches a maximum value. After region growing, all connected voxels constituting the object are labeled. Three-dimensional features that describe the object characteristics can then be extracted from the labeled region. The parameter values used in the 3D gradient field analysis and segmentation were chosen in previous studies using a small data set.11
Three types of features are extracted from the segmented object. The morphological features include the volume in terms of the number of voxels in the object, the volume change before and after 3D morphological opening by a spherical structuring element 5 voxels in radius, the surface area, the maximum perimeter of the segmented object among all slices intersecting the object, the diameter, and the compactness of the object, defined as the percentage overlap between the object and a sphere of the same volume centered at the centroid of the object. The gray level features include the maximum, minimum and the average gray levels in the object, the contrast of the object relative to the surrounding background, the skewness, kurtosis, energy, and the entropy derived from the object’s gray level histogram. Two types of texture features are extracted. The run-length statistics (RLS) texture features are estimated from the DBT slices as follows. Each slice is processed as a 2D image. A band of 60-pixel wide region surrounding the object margin on each slice is subjected to the rubber-band straightening transform (RBST).18 The RBST maps the region into a rectangular image in which the object margin will be straightened in the horizontal direction and potential spicules radiating from the object will be oriented approximately in the vertical direction. Sobel filtering is used to further enhance the texture in the RBST image. Five RLS texture features,19 short runs emphasis, long runs emphasis, gray level nonuniformity, run length nonuniformity, and run percentage, are extracted from the Sobel gradient image in both the horizontal and vertical directions. The corresponding RLS texture features from the different DBT slices of the segmented 3D object are averaged, resulting in one set of RLS features. The RLS features are effective in differentiating spiculated and nonspiculated objects. Since we are interested in detecting all types of masses using the mass detection scheme and many malignant masses are not spiculated, a second type of texture features are extracted from the spatial gray level dependence (SGLD) matrices.20, 21 Thirteen SGLD texture measures are extracted from the 256×256-pixel region of interest (ROI) containing the object on each slice at 1 pixel distance and two directions. The same texture features from the different DBT slices are again averaged to obtain one average feature. We have described the details of the RBST and the RLS and SGLD texture feature extraction for mammographic masses previously.18, 21 A total of 6 morphological features, 8 gray level features, 20 RLS texture features, and 26 SGLD features are extracted from each detected object in the DBT volume.
A leave-one-case-out resampling technique is used for training a classifier to estimate the likelihood of being a mass for each object. The classifier is based on linear discriminant analysis (LDA) with stepwise feature selection.22 In each leave-one-case-out cycle using a data set of n cases, all mass candidates from a test case are left out while the other (n−1) cases are used for selection of predictor variables from the feature pool and estimation of the LDA classifier weights. The trained LDA classifier is then applied to the mass candidates in the left-out case to obtain the mass likelihood score of each candidate. The test case is therefore independent of the classifier training including both feature selection and classifier weight estimation. This process is performed with each of the n cases left out in turn so that all objects will be assigned a mass likelihood score at the completion of the n cycles. In this study, there were over 1800 mass candidates from the 100 DBT volumes at the mass likelihood estimation stage. In each leave-one-case-out cycle, (n−1)∕n of these samples, or 99% on average, were available for classifier training.
The free response receiver operating characteristic (FROC) analysis is used to evaluate the performance of the CAD system. To generate an FROC curve, the decision threshold on the test mass likelihood scores of the detected objects is varied over a range. At each decision threshold, if an object has a mass likelihood score above the threshold, the object will be compared to the true mass location of that case marked by the radiologist. The object is considered to be a true positive if the centroid of the object falls within the volume of the true mass, or if the centroid of the true mass falls within the volume of the segmented object. All other objects are considered false positives. The detection sensitivity and the average number of FPs per breast are determined from the scores of the n left-out test cases. The FROC curve is plotted as the sensitivity as a function of the average FP rate as the decision threshold is varied.
CAD system for projection view images
Mass detection is performed independently on the PV image set. To estimate the mass likelihood scores for objects detected on an individual PV image, a processing scheme with five steps is used: (1) multiscale enhancement, (2) prescreening of mass candidates by 2D gradient field analysis, (3) object segmentation by region growing, (4) feature extraction, and (5) mass likelihood estimation from a single PV. The first four steps and the parameter values are chosen to be the same as those we previously developed for projection mammograms.23, 24, 25
For an input PV, the image is first processed by multiscale enhancement. An example of the enhanced image is shown in Fig. 1a. The enhanced image is then smoothed by a 4×4-pixel box filter and subsampled to 400 μm×400 μm pixel size. Two-dimensional gradient field analysis is then applied to the smoothed PV. The gradient field analysis in 2D is similar to that described above for 3D. For a given pixel c2(i) on the image, 5-pixel-wide concentric rings centered at c2(i) are defined in a circular region of about 15 mm in radius. For a given ring R2(k), the projected gradient unit vector relative to a radial direction from the center c2(i) is first calculated for each radial direction in the ring and estimated as the maximum of the corresponding values among three adjacent rings R2(k−1), R2(k), and R2(k+1). The gradient field convergence of a given ring is then estimated as the average of the projected gradient unit vectors in the ring over all radial directions. Finally, the gradient field convergence at c2(i) is determined as the maximum of the gradient field convergence values among all rings in the circular region. The gradient field convergence is calculated for the entire breast region. Mass candidates are identified as locations of high gradient convergence. At each high gradient convergence site, an ROI of 256×256 pixels is centered at the corresponding point on the original 2D PV image. K means clustering using gray level information is applied to the ROI to extract the object from the background. The object is further refined by an active contour method on the image. For each segmented object, a total of 11 2D morphological, 1 Hessian, and 572 texture features are extracted. The morphological features describe the contrast, size, and shape of the object on the PV. Multiresolution global and local texture features are derived from the SGLD matrices,21 including 364 global (13 SGLD texture measures×14 distances×2 directions from the entire ROI) and 208 local (13 SGLD texture measures×4 distances×2 directions=104 features from the object region and 104 from the peripheral background region in the ROI). The details of the morphological and texture feature extraction have been described in the literature.20, 23, 24, 25
For the detection of masses on 2D images, we recently added a Hessian feature to the feature pool. The ROI of 256×256 pixels centered at the high gradient convergence point is convolved with the second-order derivatives of multiscale Gaussian kernels with standard deviations approximately estimated from the mass size range of interest. Five Gaussian kernels with standard deviations ranging from 2 to 6 mm were used. A response function R is calculated at the center of the object using the eigenvalues of the Hessian matrix at each scale as shown in Eq. 1. The Hessian feature is taken as the maximum response value among the five Gaussian kernels. The Hessian feature attains a maximum value of 1 for a circularly symmetric object with positive contrast
| (1) |
λ1, λ2 are the eigenvalues of the Hessian matrix, |λ1|⩾|λ2|, and δs is the multiscale Gaussian kernel.
The leave-one-case-out resampling method is again used for training and testing of an LDA classifier with stepwise feature selection to differentiate true and false masses detected in the 2D PVs. A 2D mass likelihood score is assigned to each mass candidate of the test case by the trained classifier in each cycle. In the current study, there were over 21 800 mass candidates from the 100×11 PV images at this stage. In each of the leave-one-case-out training cycles, on average 99% or about 21 600 samples were available for feature selection and LDA classifier weight estimation.
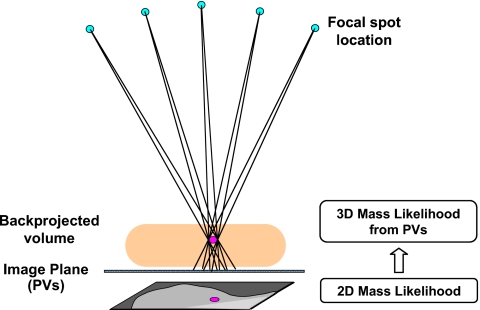
The 2D mass likelihood scores from the individual PVs for corresponding objects in the breast volume are combined with a backprojection method using the known geometry of the DBT system. The potential object location in the 3D breast volume can be predicted as a cone-shaped path connecting the focal spot location and the projected object image on the PV plane (Fig. 5). If the same object is detected in many PVs, the backprojected paths will intersect at a small region in the breast volume that can be considered the most likely location of the object. The actual implementation makes use of the backprojection tomosynthesis reconstruction algorithm in which the backprojection is performed over the entire breast region on each PV. Since the relevant information is the mass likelihood scores, a mass likelihood image is generated from a PV by assigning each mass candidate on the PV a gray level that is proportional to the mass likelihood score from the LDA classifier. The mass candidate is then multiplied by a Gaussian weighting function with a standard deviation equal to the object radius to represent the decrease in the mass likelihood from the center of the object to its periphery. The mass likelihood images derived from the PVs, instead of the original PV images, are backprojected to the breast volume to estimate the 3D spatial distribution of the mass likelihood scores. The 2D mass likelihood scores from different PVs of the same 3D object will therefore reinforce and contribute to higher likelihood scores at the 3D location of the object. Since the chance of detecting a true mass on a large number of PVs is higher than that for false objects, the intensity of the backprojected 3D mass likelihood distribution in the breast volume will carry useful information regarding the presence of masses.
Figure 5.
Backprojection of the mass likelihood score from the PVs to the breast volume using the geometry of the DBT system. The mass likelihood scores from the different PVs merge in 3D and will be more likely to obtain high scores where a true mass is located. Only one of the PVs is shown.
A thresholding method is applied to the distribution of the mass likelihood scores in the backprojected volume to identify local maxima. At each high likelihood location, a VOI of about 25 mm in sidelength is centered at the local maximum. Otsu’s thresholding method is used to segment the likelihood distribution of the mass candidate in the VOI. The segmented “object” is then determined as a TP or FP in a similar way as that described above for the 3D detection approach. By varying the decision threshold on the maximum mass likelihood score of the detected objects, a test FROC curve for the 2D detection scheme can be generated.
Combined CAD system
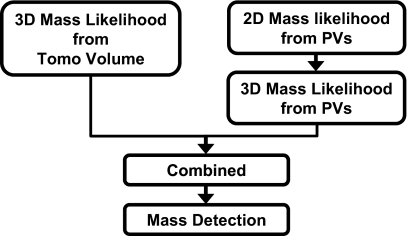
We evaluate an approach that combines the information obtained from both the 3D reconstructed DBT volume and the 2D PV images. In this study, the fusion scheme (Fig. 6) makes use of the output from the 2D and 3D mass detection schemes described above. Two sets of 3D mass likelihood scores are available: one from mass detection in the DBT volume, the other from mass detection on the PV images and backprojected to the breast volume. The two sets of scores are first scaled to between 0 and 1. The objects in the backprojected mass likelihood distribution in the breast volume are segmented as described in the last section. If the centroid of a segmented object falls within the volume of a segmented object in the 3D approach or vice versa, the two objects are labeled as corresponding objects from the two different approaches. The 3D mass likelihood scores estimated for the mass candidate by the two schemes are merged by averaging in this study. If an object detected in one of the approaches does not match with any corresponding object from the other approach, the mass likelihood score of the object will be averaged with 0. The FROC curve from the combined approach is generated by estimating the mass detection sensitivity as a function of FPs per breast as the decision threshold for the combined 3D mass likelihood score is varied. The FROC curve obtained by the combined approach is compared to that obtained by detection in the 3D or in the 2D approach alone.
Figure 6.
Fusion of the 3D mass likelihood information from the 3D CAD system and the 2D CAD system for DBT.
RESULTS
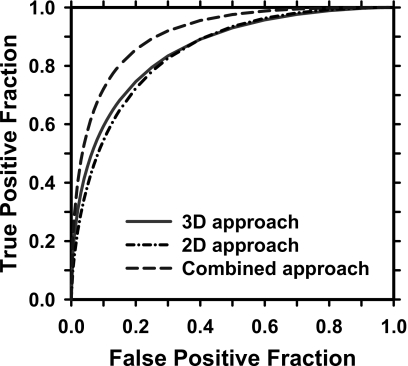
The test ROC curves of the LDA classifiers for classification of mass and FPs for the 2D alone, 3D alone, and combined 3D and 2D approach are shown in Fig. 7. The areas under the ROC curves, Az, are 0.85±0.02, 0.86±0.02, and 0.91±0.01, respectively. For the 2D mass detection approach, the most frequently selected features for the LDA classifier include two morphological features (contrast, perimeter), the Hessian feature, and six global (correlation, entropy at two distances, sum entropy, information measure of correlation 1, inverse difference moment), and five local (information measure of correlation 2 at two distances, difference entropy, inverse difference moment, sum variance) SGLD texture features. For the 3D mass detection approach, the most frequently selected features include two morphological features (compactness, volume change before and after 3D morphological opening), four gray level features (average gray level within object, minimum gray level within object, contrast-to-noise ratio, kurtosis of gray level histogram), two RLS texture features (gray level nonuniformity, run percentage), and one SGLD (difference entropy) texture feature.
Figure 7.
The leave-one-case-out test ROC curves for classification of breast masses from normal tissues on digital tomosynthesis mammography (DBT). The Az values are 0.85±0.02, 0.86±0.02, and 0.91±0.01 for the 2D, 3D, and combined approaches, respectively.
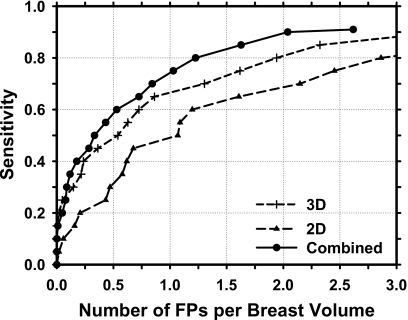
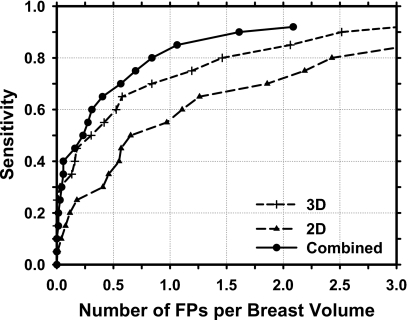
The test FROC curves for the three approaches are compared in Fig. 8 and the FP rates per breast at several sensitivities are summarized in Table 1. The CAD system for mass detection in the reconstructed 3D DBT volume alone achieved test sensitivities of 80% and 90%, respectively, at an average FP rate of 1.94 and 3.40 per breast. Detection of masses in the 2D PV images resulted in higher FP rates of 2.86 and 4.05 per breast, respectively, at the same sensitivities. The average FP rates were reduced to 1.23 and 2.04 per breast, respectively, at these sensitivities when the mass likelihood information from detection in the 3D and 2D schemes were combined. The FP rates for the 3D detection were therefore reduced by about 37% and 40%, respectively, at 80% and 90% sensitivities by inclusion of the 2D mass likelihood information. For a given FP rate, the sensitivity increased by about 5%–10% over the FP range of interest. The difference in the FROC curves between the 3D and 2D approaches (p=0.02) and between the 3D and the combined approaches (p=0.01) are statistically significant by alternative FROC (AFROC) analysis.26
Figure 8.
FROC curves for mass detection in the reconstructed DBT volume (3D), in the 2D PV images (2D), and by combining the 2D and 3D mass likelihood scores (combined) for the data set of 100 DBT volumes containing malignant or benign masses.
Table 1.
The FP rates (No. of FPs per breast volume) at sensitivities of 80%, 85%, and 90% for mass detection in the 2D PV images, 3D reconstructed DBT breast volume, and the combined 2D and 3D information for the data set containing both malignant and benign masses.
| Sensitivity (%) | FP rate | ||
|---|---|---|---|
| 2D PVs | 3D DBT | Combined | |
| 80 | 2.86 | 1.94 | 1.23 |
| 85 | 3.73 | 2.32 | 1.63 |
| 90 | 4.05 | 3.40 | 2.04 |
Since the detection of breast cancer is the ultimate goal, the performance of the CAD system in detection of malignant masses is evaluated. The FROC curves for the three approaches in the subset of 69 cancer cases in the data set are compared in Fig. 9. The FP rates were 2.43, 1.46, and 0.84, respectively, at 80% sensitivity and 3.65, 2.52, 1.61, respectively, at 90% sensitivity for the 2D, 3D, and combined approaches (Table 2). The difference in the FROC curves between the 3D and 2D approaches (p=0.03) and between the 3D and the combined approaches (p=0.003) are again statistically significant by AFROC analysis.
Figure 9.
FROC curves for mass detection in the reconstructed DBT volume (3D), in the 2D PV images (2D), and by combining the 2D and 3D mass likelihood scores (combined) for the data set of 69 DBT volumes containing malignant masses.
Table 2.
The FP rates (No. of FPs per breast volume) at sensitivities of 80%, 85%, and 90% for mass detection in the 2D PV images, 3D reconstructed DBT breast volume, and the combined 2D and 3D information for the data set containing malignant masses.
| Sensitivity (%) | FP rate | ||
|---|---|---|---|
| 2D PVs | 3D DBT | Combined | |
| 80 | 2.43 | 1.46 | 0.84 |
| 85 | 3.16 | 2.06 | 1.06 |
| 90 | 3.65 | 2.52 | 1.61 |
DISCUSSION
The data set used in this study contained 100 breasts with mass lesions, 69 of which are malignant. Although the data set is still small, to our knowledge, it is the largest data set with malignant masses available to date for noncommercial tomosynthesis CAD system development. As discussed above, the training of the CAD system with such a small data set may limit its generalizability. Although we used leave-one-case-out resampling to estimate the test performance, the test set is not truly independent of training because we have experimented with different parameters and techniques and used the test results as a guide. The estimated test performance will likely be optimistically biased. More rigorous testing will be needed when an independent DBT data set is available in the future. In addition, our data set only included abnormal cases with confirmed masses and a large fraction was malignant. This was not a consecutive random sample so that the observed detection performance might not reflect that in a screening population. However, the focus of our study was to compare the relative performances, in terms of the FROC curves, of the three approaches rather than the absolute performance of a given approach. While there may be differences in the sensitivity and false positive detection rates between our case samples and screening cases, the effect of the biases, if any, on the relative performances should be much smaller than those on the absolute performances. Despite the limitations due to the data set in this early stage study, we believe that the observed trends of the approaches should be relatively independent of the data set.
A CAD system includes many stages, each of which may be accomplished by different image processing techniques. Even after the techniques are chosen, each technique may contain many parameters. The choice of parameters in one stage may affect the performance of the current stage and the choice of parameters in the other stages. Ideally, optimization of the CAD system should be performed as a whole in the multidimensional parameter space. However, because of the large number of slices in a DBT volume and the large matrix size of each slice, it is computationally impractical to perform extensive parameter optimization, especially in the entire parameter space. Furthermore, because of the small sample size available, exhaustive search for best parameters that are tailored to the small data set would tend to result in overly optimistic estimates. Therefore, in our CAD system training, we attempted to limit our search to a small range that is selected on the basis of previous experiences with mass detection on mammograms and using a small number of cases for initial evaluation.10, 11, 13 The selected parameters therefore may not be optimal. Nevertheless, the results should demonstrate the relative trends of the different approaches.
There can be many different methods to merge the 3D and 2D information for the combined system. For example, the 3D and 2D mass likelihood scores may be averaged or may be merged by a linear or nonlinear classifier with trained weights. Alternatively, the feature space extracted from the DBT volume and that from the 2D PV images may be combined and a single classifier may be trained in the combined feature space to differentiate the true masses and FPs. In this study we chose to simply average the 3D and 2D mass likelihood scores. Although the information may not be combined optimally, the advantage is that it does not require training of additional weights and thus reduces the chance of overtraining due to the limited data set. It is expected that if more sophisticated fusion methods are explored when a larger data set becomes available, further improvement in the combined system may be possible.
Although the set of PV images and the reconstructed DBT volume should contain similar image information, detection in the reconstructed DBT volume was found to provide higher detection accuracy than that in the set of PVs in this study. One reason may be that the SART combines the image information in the PVs efficiently and accurately into 3D information, facilitating the extraction of 3D morphological and texture features. On the other hand, our current 2D approach combines the mass likelihood scores by backprojection, the potentially useful correlated information on image features among the set of 2D PV images has not been fully utilized. If better methods are developed to correlate the 2D information, including the spatial positions, the gray levels, and the individual features extracted from the mass candidates on the set of PVs, it is possible that the discrimination between the mass and false positives can be improved in the 2D approach. In addition, the PVs are much noisier than those of regular projection mammograms due to the low exposure and the large x-ray incident angles for many of the PVs. Our current mass detection system developed for regular mammograms and used in this study has not been optimized for processing the 2D PV images. These are topics of interest in future developments.
Although both 2D and 3D approaches start with the same image data, the image analysis methods in the two approaches, and thus the extracted information, can be different. As a result, the combination of the two approaches provides significant improvement in the detection performance compared to either approach alone. This is not unexpected, as the combination of different image analysis techniques, or even different classifiers, based on the same image set has been shown to increase the performance of CAD systems for other modalities.27, 28
In our previous study,12 we compared mass detection accuracy in DBT mammograms reconstructed by the SART method and those reconstructed by an iterative maximum-likelihood (ML-convex) method. Using a small data set of 26 cases, we found that SART with two iterations using a relaxation parameter of 0.5 and 0.1, respectively, could provide comparable image quality to that obtained from the ML-convex method with 11 iterations. The FROC curves for mass detection in the two reconstructed DBT sets were also comparable. The DBT reconstruction in the current study was therefore performed using SART with two iterations. The same study also demonstrated that mass detection in DBT reconstructed with either SART or ML-convex methods using fewer iterations could lead to poorer image quality and lower FROC curves than those obtained from the chosen parameters. These results, although preliminary, indicate that CAD system performance may depend strongly on factors that affect image quality such as the DBT reconstruction methods and parameters, and image acquisition methods such as the x-ray techniques, number of projection views, and tomographic angle. Further investigations will be needed to evaluate the effects of these factors on the performance of CAD systems using different approaches. The performance dependence on image acquisition methods will have to be investigated when DBT cases obtained with the different techniques and parameters become available in the future.
CONCLUSION
In this study, we compared the accuracy of mass detection in the reconstructed 3D DBT volume with that in the 2D PV images. A combined system that merges both the 2D and 3D mass likelihood information was also evaluated. The 3D approach was found to provide significantly higher (p=0.02) detection accuracy than the 2D approach. The combined information improved the estimate of mass likelihood and thus increased significantly (p<0.05) the accuracy of mass detection in the breast in comparison with the 2D or 3D approach alone. These results indicate that 2D and 3D information fusion is a promising approach to mass detection in DBT. Study is underway to further improve the 3D and 2D CAD systems and the information fusion scheme. A larger data set is also being collected to improve the training of the CAD systems.
ACKNOWLEDGMENTS
This work is supported by USPHS Grant Nos. CA120234 and CA95153, and U. S. Army Medical Research and Materiel Command Grant No. DAMD 17-02-1-0214.
References
- Bird R. E., Wallace T. W., and Yankaskas B. C., “Analysis of cancers missed at screening mammography,” Radiology 184, 613–617 (1992). [DOI] [PubMed] [Google Scholar]
- Rafferty E. A., Georgian-Smith D., Kopans D. B., Hall D. A., Moore R., and Wu T., “Comparison of full-field digital tomosynthesis with two view conventional film screen mammography in the prediction of lesion malignancy,” Radiology 225(P), 268 (2002). [Google Scholar]
- Lo J., Baker J., Orman J., Mertelmeier T., and Singh S., “Breast tomosynthesis: Initial clinical experience with 100 human subjects,” RSNA Program Book 2006, 335 (2006).
- Helvie M. A., Roubidoux M. A., Hadjiiski L. M., Zhang Y., Carson P. L., and Chan H.-P., “Tomosynthesis Mammography vs conventional mammography: Comparison of breast masses detection and characterization,” RSNA Program Book 2007, 381 (2007).
- Poplack S. P., Tosteson T. D., Kogel C. A., and Nagy H. M., “Digital breast tomosynthesis: Initial experience in 98 women with abnormal digital screening mammography,” AJR, Am. J. Roentgenol. 10.2214/AJR.07.2231 189, 616–623 (2007). [DOI] [PubMed] [Google Scholar]
- Chan H. P., Doi K., Vyborny C. J., Schmidt R. A., Metz C. E., Lam K. L., Ogura T., Wu Y., and MacMahon H., “Improvement in radiologists’ detection of clustered microcalcifications on mammograms. The potential of computer-aided diagnosis,” Invest. Radiol. 10.1097/00004424-199010000-00006 25, 1102–1110 (1990). [DOI] [PubMed] [Google Scholar]
- Freer T. W. and Ulissey M. J., “Screening mammography with computer-aided detection: Prospective study of 12,860 patients in a community breast center,” Radiology 10.1148/radiol.2203001282 220, 781–786 (2001). [DOI] [PubMed] [Google Scholar]
- Helvie M. A., Hadjiiski L. M., Makariou E., Chan H. P., Petrick N., Sahiner B., Lo S. C. B., Freedman M., Adler D., Bailey J., Blane C., Hoff D., Hunt K., Joynt L., Klein K., Paramagul C., Patterson S., and Roubidoux M. A., “Sensitivity of noncommercial computer-aided detection system for mammographic breast cancer detection—A pilot clinical trial,” Radiology 10.1148/radiol.2311030429 231, 208–214 (2004). [DOI] [PMC free article] [PubMed] [Google Scholar]
- Chan H. P., Wei J., Sahiner B., Rafferty E. A., Wu T., Roubidoux M. A., Moore R. H., Kopans D. B., Hadjiiski L. M., and Helvie M. A., “Computerized detection of masses on digital tomosynthesis mammograms—A preliminary study,” 7th International Workshop on Digital Mammography, Durham, NC, Proceedings of the 7th International Workshop on Digital Mammography, edited by Pisano E. (University of Carolina, Chapel Hill, NC: ), pp. 199–202.
- Chan H. P., Wei J., Sahiner B., Rafferty E. A., Wu T., Ge J., Roubidoux M. A., Moore R. H., Kopans D. B., Hadjiiski L. M., and Helvie M. A., “Computer-aided detection on digital breast tomosynthesis (DBT) mammograms—Comparison of two approaches,” RSNA Program Book 2004, 447 (2004).
- Chan H.-P., Wei J., Sahiner B., Rafferty E. A., Wu T., Roubidoux M. A., Moore R. H., Kopans D. B., Hadjiiski L. M., and Helvie M. A., “Computer-aided detection system for breast masses on digital tomosynthesis mammograms—Preliminary experience,” Radiology 10.1148/radiol.2373041657 237, 1075–1080 (2005). [DOI] [PMC free article] [PubMed] [Google Scholar]
- Chan H.-P., Wei J., Wu T., Sahiner B., Rafferty E. A., Hadjiiski L. M., Helvie M. A., Roubidoux M. A., Moore R. H., and Kopans D. B., “Computer-aided detection on digital breast tomosynthesis (DBT) mammograms: Dependence on image quality of reconstruction,” RSNA Program Book 2005, 269 (2005).
- Chan H. P., Wei J., Zhang Y., Helvie M. A., Moore R. H., Kopans D., Roubidoux M. A., Sahiner B., and Hadjiiski L. M., “Digital breast tomosynthesis (DBT) mammography: Computer-aided mass detection by fusion of tomosynthesis and 3D mass likelihood information,” RSNA Program Book 2006, 230 (2006).
- Chan H. P., Wei J., Zhang Y., Moore R. H., Kopans D. B., Hadjiiski L. M., Sahiner B., Roubidoux M. A., and Helvie M. A., “Computer-aided detection of masses in digital tomosynthesis mammography: Combination of 3D and 2D detection information,” Proc. SPIE 6514, 161–166 (2007). [Google Scholar]
- Reiser I., Nishikawa R. M., Giger M. L., Wu T., Rafferty E., Moore R. H., and Kopans D. B., “Computerized detection of mass lesions in digital breast tomosynthesis images using two- and three dimensional radial gradient index segmentation,” Technol. Cancer Res. Treat. 3, 437–441 (2004). [DOI] [PubMed] [Google Scholar]
- Reiser I., Nishikawa R. M., Giger M. L., Wu T., Rafferty E. A., Moore R. H., and Kopans D. B., “Computerized mass detection for digital breast tomosynthesis directly from the projection images,” Med. Phys. 10.1118/1.2163390 33, 482–491 (2006). [DOI] [PubMed] [Google Scholar]
- Zhang Y., Chan H.-P., Sahiner B., Wei J., Goodsitt M. M., Hadjiiski L. M., Ge J., and Zhou C., “A comparative study of limited-angle cone-beam reconstruction methods for breast tomosynthesis,” Med. Phys. 10.1118/1.2237543 33, 3781–3795 (2006). [DOI] [PMC free article] [PubMed] [Google Scholar]
- Sahiner B., Chan H. P., Petrick N., Helvie M. A., and Goodsitt M. M., “Computerized characterization of masses on mammograms: The rubber band straightening transform and texture analysis,” Med. Phys. 10.1118/1.598228 25, 516–526 (1998). [DOI] [PubMed] [Google Scholar]
- Galloway M. M., “Texture classification using gray level run lengths,” Comput. Graph. Image Process. 10.1016/S0146-664X(75)80008-6 4, 172–179 (1975). [DOI] [Google Scholar]
- Haralick R. M., Shanmugam K., and Dinstein I., “Texture features for image classification,” IEEE Trans. Syst. Man Cybern. 10.1109/TSMC.1973.4309314 SMC-3, 610–621 (1973). [DOI] [Google Scholar]
- Wei D., Chan H. P., Petrick N., Sahiner B., Helvie M. A., Adler D. D., and Goodsitt M. M., “False-positive reduction technique for detection of masses on digital mammograms: Global and local multiresolution texture analysis,” Med. Phys. 10.1118/1.598011 24, 903–914 (1997). [DOI] [PubMed] [Google Scholar]
- Sahiner B., Chan H. P., Petrick N., Wagner R. F., and Hadjiiski L. M., “Feature selection and classifier performance in computer-aided diagnosis: The effect of finite sample size,” Med. Phys. 10.1118/1.599017 27, 1509–1522 (2000). [DOI] [PMC free article] [PubMed] [Google Scholar]
- Wei J., Sahiner B., Hadjiiski L. M., Chan H. P., Petrick N., Helvie M. A., Roubidoux M. A., Ge J., and Zhou C., “Computer aided detection of breast masses on full field digital mammograms,” Med. Phys. 10.1118/1.1997327 32, 2827–2838 (2005). [DOI] [PMC free article] [PubMed] [Google Scholar]
- Wei J., Chan H.-P., Sahiner B., Hadjiiski L. M., Helvie M. A., Roubidoux M. A., Zhou C., and Ge J., “Dual system approach to computer-aided detection of breast masses on mammograms,” Med. Phys. 10.1118/1.2357838 33, 4157–4168 (2006). [DOI] [PMC free article] [PubMed] [Google Scholar]
- Wei J., Hadjiiski L. M., Sahiner B., Chan H. P., Ge J., Roubidoux M. A., Helvie M. A., Zhou C., Wu Y. T., Paramagul C., and Zhang Y., “Computer aided detection systems for breast masses: Comparison of performances on full-field digital mammograms and digitized screen-film mammograms,” Acad. Radiol. 6, 659–669 (2007). [DOI] [PMC free article] [PubMed] [Google Scholar]
- Chakraborty D. P. and Winter L. H. L., “Free-response methodology: Alternate analysis and a new observer-performance experiment,” Radiology 174, 873–881 (1990). [DOI] [PubMed] [Google Scholar]
- Gurcan M. N., Sahiner B., Petrick N., Chan H. P., Kazerooni E. A., Cascade P. N., and Hadjiiski L., “Lung nodule detection on thoracic computed tomography images: preliminary evaluation of a computer-aided diagnosis system,” Med. Phys. 10.1118/1.1515762 29, 2552–2558 (2002). [DOI] [PubMed] [Google Scholar]
- Hadjiiski L. M., Sahiner B., Chan H. P., Petrick N., and Helvie M. A., “Classification of malignant and benign masses based on hybrid ART2LDA approach,” IEEE Trans. Med. Imaging 10.1109/42.819327 18, 1178–1187 (1999). [DOI] [PubMed] [Google Scholar]


