Abstract
The authors develop a unique CT simulation tool based on the 4D extended cardiac-torso (XCAT) phantom, a whole-body computer model of the human anatomy and physiology based on NURBS surfaces. Unlike current phantoms in CT based on simple mathematical primitives, the 4D XCAT provides an accurate representation of the complex human anatomy and has the advantage, due to its design, that its organ shapes can be changed to realistically model anatomical variations and patient motion. A disadvantage to the NURBS basis of the XCAT, however, is that the mathematical complexity of the surfaces makes the calculation of line integrals through the phantom difficult. They have to be calculated using iterative procedures; therefore, the calculation of CT projections is much slower than for simpler mathematical phantoms. To overcome this limitation, the authors used efficient ray tracing techniques from computer graphics, to develop a fast analytic projection algorithm to accurately calculate CT projections directly from the surface definition of the XCAT phantom given parameters defining the CT scanner and geometry. Using this tool, realistic high-resolution 3D and 4D projection images can be simulated and reconstructed from the XCAT within a reasonable amount of time. In comparison with other simulators with geometrically defined organs, the XCAT-based algorithm was found to be only three times slower in generating a projection data set of the same anatomical structures using a single 3.2 GHz processor. To overcome this decrease in speed would, therefore, only require running the projection algorithm in parallel over three processors. With the ever decreasing cost of computers and the rise of faster processors and multi-processor systems and clusters, this slowdown is basically inconsequential, especially given the vast improvement the XCAT offers in terms of realism and the ability to generate 3D and 4D data from anatomically diverse patients. As such, the authors conclude that the efficient XCAT-based CT simulator developed in this work will have applications in a broad range of CT imaging research.
Keywords: medical imaging simulation, computer phantom, x-ray CT
INTRODUCTION
With the rapid growth and expansion of x-ray computed tomography (CT) into new three-dimensional (3D) and four-dimensional (4D) applications, a great deal of research is being performed to develop methods and techniques to further improve image quality and image interpretation while minimizing the radiation dose to the patient. As CT technologies become progressively more advanced, they also become exceedingly complex and any optimization becomes a daunting challenge. Due to radiation concerns, it is impractical to optimize the large number of existing imaging parameters available in modern CT systems in human patients in ways that are specific to clinical demands. There is too much heterogeneity in patient size and pathology and too many technical variables in modern CT systems to perform such studies. It is equally impractical to perform optimization studies in physical test objects that cannot realistically duplicate the conditions seen in vivo. It would be prohibitively expensive to fabricate physical phantoms to simulate a realistic range of patient sizes and clinical needs, especially when physiologic motion needs to be considered. The only practical approach to the optimization problem is, therefore, through realistic computer simulation.
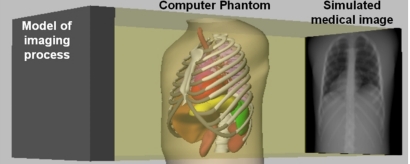
Computer simulation is, therefore, set to play a crucial role in characterizing, evaluating, and optimizing CT imaging systems and image processing and reconstruction methods. Computer simulation involves generating imaging data from a computer model or phantom of a subject’s anatomy and physiology using models for the physics of the imaging process (Fig. 1). The main advantage to using computer generated phantoms in simulation studies is that the exact anatomy and physiological functions of the phantom are known, thus providing a gold standard from which to quantitatively evaluate and improve medical imaging devices and image processing and reconstruction techniques. A vital aspect of simulation is to have a realistic phantom or model of the human anatomy. Without such, the results of the simulation may not be indicative of what would occur in actual patients and would, therefore, have limited practical value.
Figure 1.
Computer-based medical imaging simulation. Original NCAT phantom is shown simulating a chest x-ray.
Existing computerized phantoms used in medical imaging involve trade-offs between realism and flexibility. Current phantoms can be divided into two general classes: voxelized and mathematical phantoms. Voxelized phantoms1, 2, 3, 4, 5, 6, 7, 8 are based on patient data, typically obtained from magnetic resonance (MR) or x-ray CT scanners, and are thus very realistic. The patient images are segmented assigning a unique identifier or color to the voxels that compose each organ. Originally fixed to a particular image resolution and patient anatomy, transforms can be applied to the voxels that compose these phantoms to generate other resolutions and to simulate anatomical variations and patient motion, but this requires interpolation, which induces error. Another limitation to voxelized phantoms is that since they provide a digitized representation of objects at a particular resolution, exact ray tracing calculations (such as those used for transmission CT simulation) are not possible. They can only be approximated from the voxelized representations.
Mathematical phantoms,9, 10, 11, 12, 13 on the other hand, are based on simple geometric primitives. Since they are mathematically defined, they can be easily manipulated to model anatomical variations and patient motion, and they may be generated at any resolution without errors due to interpolation. Also, it is possible to more accurately calculate the intersection of projection rays with the objects in the phantom using the mathematical equations.10 The major limitation of mathematical phantoms is that the simplicity of the mathematical equations upon which they are based limits exact modeling of the organ shapes. Therefore, CT data generated from mathematical phantoms are not as realistic as those from voxelized phantoms.
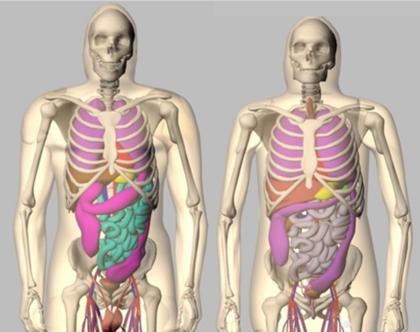
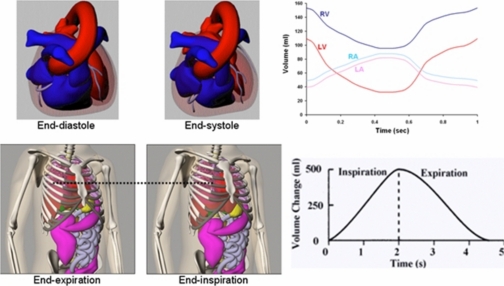
Recent work in phantom development has focused on creating more hybrid models, phantoms based on patient imaging data, but using more complex mathematical primitives to define the organs and structures.14 Among these is the 4D extended cardiac-torso (XCAT) phantom15, 16, 17, 18, 19 (Fig. 2) developed in our laboratory. It was developed to provide a computer model of the human anatomy and physiology that is both realistic and flexible, taking advantage of both types of computational phantoms. The XCAT is an enhanced version of the original 4D NURBS-based cardiac-torso (NCAT) phantom, a thoracic model designed for low-resolution imaging research, specifically SPECT or PET. The XCAT phantom consists of a whole-body model that contains a much higher level of anatomical detail, suitable for application to high-resolution modalities such as CT or MRI.19 Non-uniform rational b-splines, or NURBS20, 21 surfaces, were used to construct the organ shapes of the male and female versions of the phantom based on the 3D Visible Human Male and Female anatomical data sets from the National Library of Medicine (NLM),22 respectively. The NURBS mathematical basis allows the organ shapes to be altered easily to realistically model different anatomical variations and patient motions.16, 17, 20, 21 Male and female anatomical variations can be created by applying a set of transformations to the base anatomies of the phantom.23, 24 The XCAT was extended to four dimensions to model common patient motions such as the cardiac and respiratory motions using 4D cardiac-gated tagged MRI and multi-slice CT data and 4D respiratory-gated CT data, respectively (Fig. 3). With its basis upon human data and the inherent flexibility of the NURBS mathematical primitives, the 4D XCAT is capable of creating a realistic population of patients of varying anatomy and motion from which to perform research.
Figure 2.
Anterior views of the male (left) and female (right) anatomies of the 4D XCAT phantom.
Figure 3.
Cardiac and respiratory motions of the 4D XCAT. Plots of the volume change in the cardiac chambers and lungs are shown to the right.
A disadvantage to the NURBS basis of the 4D XCAT, however, is that the ray-surface intersections, which determine the line integrals in a CT projection image, are much more difficult due to the mathematical complexity of the surfaces.25 The intersections have to be calculated using iterative procedures; therefore, the calculation of projections is much slower than for simpler mathematical phantoms. Many techniques have been developed in computer graphics for more efficient ray tracing of spline surfaces.26, 27, 28, 29, 30, 31, 32, 33 Most of the algorithms focus on solving the ray-surface intersection problem for Bezier surfaces since other types of polynomial surfaces, including NURBS surfaces, can be simply converted into a Bezier representation.21, 34, 35 Bezier surfaces are well suited for use in the ray-surface intersection problem since subdivision of them is much easier and efficient than that of other surface representations.25, 36 One method widely used in computer graphics to solve the ray-surface intersection problem is Bezier clipping.37 Bezier clipping is an easy and efficient method for calculating the intersections of a ray with a Bezier surface.
Using the Bezier clipping method in combination with other efficient ray tracing techniques, we develop a fast analytic CT projection algorithm to accurately calculate projections directly from the surface definition of the XCAT phantom given parameters defining the CT scanner and geometry. The algorithm can produce realistic, patient-quality 3D and 4D CT images. We compare the efficiency of our projection algorithm with others using geometrically based phantoms. We then demonstrate the capability of the XCAT-based simulator to generate realistic 3D and 4D CT data.
METHODS
Development of the analytical x-ray CT projection algorithm
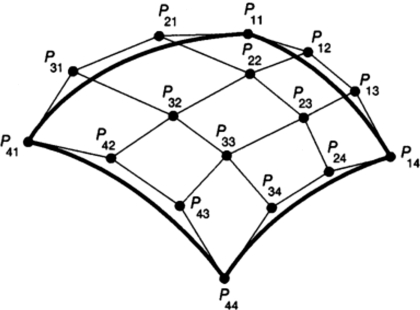
The XCAT-based projection algorithm was set up so as to generate a single projection given user defined parameters for the CT geometry and scanner. The program was set up in this manner so that the algorithm could be run in parallel, spreading the angles that compose the total projection data set over multiple processors or computers. For the given projection angle, the algorithm first determines the rays needed to form the projection image based on the parameters input for the projection field. The projection field is determined by six user-defined parameters: the projection geometry (parallel, fan, or cone-beam), distance from the center of the patient (COP) to the source, distance from the COP to the detector array, field of view (FOV), and array size (256×256, 512×512, etc.) After determining the projection field, the NURBS organ models of the phantom are converted into cubic Bezier patches. A Bezier patch consists of a cubic Bezier surface composed of 16 control points (Fig. 4). The 16 control points form a convex-hull approximating the shape of the surface. Since NURBS surfaces are generalizations of Bezier surfaces, a NURBS surface can be easily converted into Bezier form. A NURBS surface is decomposed into Bezier surfaces by inserting multiple knots using accepted methods21, 34, 35 until all knots have a multiplicity of four.36 A NURBS surface composed of an n×m set of control points will be converted into n×m Bezier surfaces or patches.
Figure 4.
Cubic Bezier surface. Cubic Bezier surfaces are defined by 16 control points which form a convex hull over the surface.
The algorithm then casts the projection rays through the phantom and uses the iterative Bezier clipping method to calculate the ray-surface intersections. For each projection ray, defined by an origin O (ox,oy,oz) and a direction D (dx,dy,dz), the bounding box for each organ is first tested to see if it intersects the ray. The bounding box for each organ is precomputed by selecting the minimum and maximum values of x, y, and z from the matrix of control points defining the NURBS surface for the organ. To test for intersection with a given bounding box, the equations for the six planes that compose the box are computed. Given three corner points that define a side of the box (as determined by the minimum and maximum x, y, and z values), the equation for the plane passing through them is computed as follows. A plane is defined by Eq. 1,
| (1) |
where A, B, C, and D are the coefficients of the plane. The vectors V1 and V2 are defined as
| (2) |
where P1=(x1,y1,z1), P2=(x2,y2,z2), and P3=(x3,y3,z3) are the three corner points used to define the plane. The coefficients A, B, and C of the plane equation are calculated as the cross product of the vectors V1 and V2 as shown in Eq. 3. The coefficient D is calculated by substituting the results found for A, B, and C along with the coordinates of P1 into the plane equation as shown in Eq. 4:
| (3) |
| (4) |
Given an equation defining a plane of the bounding box, the intersection of the plane with the projection ray can be calculated. The line L(t) representing the projection ray can be defined parametrically as
| (5) |
where the x, y, and z components of the line are x(t)=ox+tdx, y(t)=oy+tdy, and z(t)=oz+tdz, respectively. Substituting x, y, and z of the line into Eq. 1 and solving for t yields the following:
| (6) |
For each of the six planes defining the bounding box, the value t is calculated and is then used to find the intersection point of the projection ray with the plane. If the intersection point falls within the minimum and maximum x, y, and z values for the plane, the ray is determined to hit the bounding box. If the ray misses a plane, the remaining planes are tested. If the projection ray does not intersect the bounding box of the organ, the process moves on to next model. If the projection ray does intersect the organ’s bounding box, the Bezier surfaces defined for the organ are input into the Bezier Clipping algorithm to iteratively calculate the intersection points with the ray.
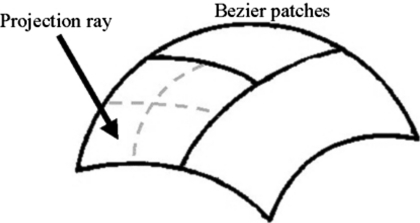
The Bezier clipping algorithm uses recursive subdivision to divide the Bezier surfaces into smaller and smaller subsurfaces to determine the intersections with the projection ray (Fig. 5). Subdivision of Bezier surfaces is much easier and efficient than that of other surface representations.25, 36 This makes it beneficial to first convert a surface into a Bezier representation before using it in an adaptive subdivision algorithm. The bounding box for each Bezier surface is tested, as described above, to see if it intersects the projection ray. As was the case for each NURBS surface, the bounding box for each Bezier surface is formed by selecting the minimum and maximum values of x, y, and z from the 16 control points defining the surface. Surfaces that do not intersect the projection ray are discarded. Surfaces found to intersect the ray are further tested for flatness. The flatness is determined by computing the equation for the plane passing through three of the four corner control points of the cubic Bezier patch and then calculating the distance from each of the other 13 control points to the plane. The equation of the plane is computed using Eqs. 3, 4. Once the coefficients of the plane have been computed, the distance of each of the 13 remaining control points to the plane is calculated. The distance is calculated by substituting the x, y, and z values of the control points into Eq. 1. Once the maximum distance is found to be within a specified tolerance value (1×10⁻¹⁰ in our implementation), the surface is determined to be flat. If the surface is not flat, it is subdivided into four subsurfaces using accepted methods for subdividing a Bezier surface,25, 36 and each of these subsurfaces is passed back into the Bezier clipping algorithm. If the surface is determined to be flat, it is approximated with a plane and the intersection of the projection ray with the plane is analytically calculated. The Bezier clipping algorithm continues until all intersection points have been found.
Figure 5.
Bezier clipping. The two Bezier surfaces that do not intersect the projection ray are discarded. The surface that intersects the ray is tested for flatness. Since it is not flat, the surface is subdivided into four subsurfaces. Each of these subsurfaces will then undergo the tests for intersection and flatness starting the process over.
The speed and efficiency of the Bezier clipping method can be enhanced using the efficient ray tracing techniques described by Martin et al.38 This involves defining each organ or structure in the 4D XCAT phantom with a bounding volume hierarchy (BVH). A bounding volume hierarchy is a tree of bounding volumes arranged so that the bounding volume at a given node encloses the bounding volume of its children. The bounding volume of a leaf in the tree encloses a primitive. Originally, a single all-encompassing bounding volume (a box in our case) represented each organ model in the projection algorithm and was used to initially determine organs that intersect a projection ray. If the ray was found to intersect this bounding box, the algorithm then proceeded to test the list of Bezier surfaces defined for the organ. A bounding volume hierarchy better represents the shape of a surface, making the Bezier clipping algorithm much more efficient. If a ray misses the bounding volume of a particular node in the tree, then the ray will miss all of its children, and the children can be skipped. Using this technique dramatically reduces the testing of surfaces that do not intersect the projection ray, but whose single all-encompassing bounding volume would. Therefore, defining a BVH for each organ greatly enhances the speed of the projection algorithm.
We further refined the Bezier clipping algorithm described above by implementing this technique. In the initialization of the projection algorithm, a BVH is defined for each organ in the 4D XCAT phantom. In our implementation, we use Bezier surfaces as the primitives and axis-aligned boxes39, 40 as the bounding volumes to construct the tree. The BVH is formed by taking the list of bounding boxes defined for each organ’s Bezier surfaces and sorting them according to the axis direction that has the greatest extent across the bounding boxes. The list is then split in half, and a bounding box is defined for each half. The process is repeated until each leaf of the tree contains a single Bezier surface.
In the projection algorithm, each projection ray is set to traverse the BVH for each organ, in depth first order, to determine the intersections of the ray. In traversing a BVH, a projection ray is tested against numerous bounding boxes to see if it intersects with them. The ray-box intersection routine can, therefore, be a computational bottleneck if an efficient method is not used. We previously defined each side of the bounding box with a plane and then calculated the intersection of the projection ray with each of the six sides. This is computationally intense, requiring up to 90 multiplication∕division and 108 addition∕subtraction operations. Many methods have been developed in computer graphics for fast calculation of the ray-box intersections. To further enhance our algorithm, we utilized the routine developed by Kay and Kajiya,41 a technique that is commonly used in ray tracing. This method treats the bounding box as a combination of slabs where a slab is defined as the space between two parallel planes. The distances to the nearest and farthest intersection points of the ray are computed for each slab. If the largest near value is greater than the smallest far value, the ray misses the bounding box; otherwise, they intersect. This routine was further optimized using the methods of Williams et al.42 to reduce the number of calculations by replacing division with faster multiplication operations and by precomputing values that remain constant for each projection ray as it travels from box to box. Overall, the improved ray-box intersection routine requires only six multiplication and six subtraction operations.
In traversing a BVH for a particular organ, if a projection ray intersects the object, it will ultimately reach a leaf in the tree. If the ray hits a leaf, the Bezier surface contained in the leaf is input into the Bezier clipping algorithm and the intersection points are calculated. The intersection points are then used to construct line segment paths through the various organs of the XCAT for each projection ray in the projection field. The paths through the phantom as well as the attenuation along each path are used to calculate the line-integral l(a,c) for each projection ray in the a×c projection image according to the following:
| (7) |
where K is the total number of objects encountered by the projection ray, and Δlk is the path length of the ray with object k. The algorithm assumes a uniform attenuation value μk for each object k. The attenuation coefficients of the tissues, at any energy from 1 to 1000 keV, are calculated from the elemental compositions of the tissues43 and the energy-dependent attenuation coefficients for the elements.44 The line integrals for all the rays in the projection field are used to compose the projection image. Each value in the projection image P(a,c) is calculated as follows:
| (8) |
where Nin is the number of photons that enter the object and Nout is the number of photons exiting the object along the path of the ray. In the case of a monochromatic source Nout is defined as Nout=Nin exp(−l(a,c)).
For polychromatic sources, the x-ray spectrum can be modeled as U pairs of energy levels Ei (i=1,2,…,U) and photon intensities Si. This is a similar method to that used for the Take CT Simulator by Müller-Merbach et al.45 The line integral for each projection ray at each energy is then calculated as shown in Eq. 9 where μk(Ei) is the attenuation coefficient of object k at the energy i. The number of photons that enter the object, Nin, and the number that exit, Nout, are then defined as given in Eq. 10:
| (9) |
| (10) |
In the case of a polychromatic spectrum, the path lengths Δlk for each projection ray are calculated once for the first energy in the spectrum and then stored in memory. For each subsequent energy i in the spectrum, the attenuation coefficients for the different organs are calculated and then multiplied by the path lengths to obtain the line integrals.
The projection algorithm includes a model for quantum noise in x-ray CT. Noise is modeled by adding statistical uncertainty to the line integrals (rather than to the reconstructed voxels). To model the noise, projections are scaled to reflect the appropriate mean intensity based on the user-defined dose and x-ray beam intensity and taking into account the detector properties and the size of the detector elements. Then, using the energy spectrum after transmission through the phantom (including the effects of beam hardening), Poisson noise is simulated in each of the spectral energy bins. Summing over energy in each projection bin provides projection data with realistic CT noise levels and statistics.
The projection algorithm can be used to generate CT data from the phantom at various angles in a circular or spiral trajectory. As mentioned above, the angles composing the total projection data set can be computed in parallel. The projections are stored as RAW images with no header and with each pixel defined as a 4 byte floating point number. The projections can be reconstructed using typical or experimental methods into realistic simulated CT images.
Comparison to analytical methods using simpler mathematical phantoms
To evaluate the efficiency of our XCAT-based CT projection algorithm, we compared it to two analytical algorithms, one based on the FORBILD phantom46 composed of simple geometric primitives, and one based on the phantom by Zhu et al. composed of superquadric surfaces.10 The anatomy of the FORBILD and superquadric phantoms included the body, lungs, sternum, backbone, and ribcage. Using a single 3.2 GHz processor, each projection algorithm was then used to generate a 256×256, 256 angle cone-beam projection scan about a circular orbit approximately covering the same field of view. The analysis of the FORBILD and superquadric phantoms was performed by Dr. Zhu in her laboratory. The XCAT was tested using a similar PC in our laboratory. The computational time of the XCAT-based projection algorithm (with and without the ray tracing refinements discussed above) was compared to those of the two analytical phantoms.
RESULTS
Comparison to analytical methods
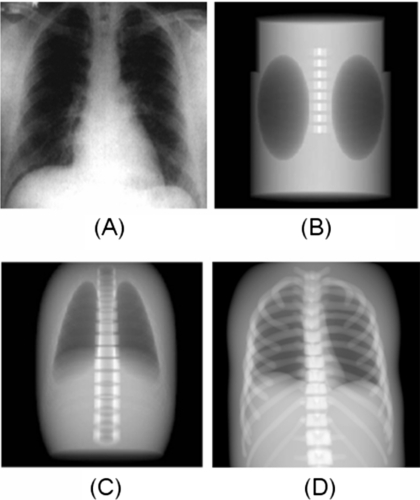
In their evaluation, Zhu et al. found that it took their superquadrics-based CT simulator 1456 s to generate the 256×256×256 projection scan as compared to 1395 s for the FORBILD CT simulator. The XCAT-based CT projection algorithm, consisting of just Bezier clipping without using any ray tracing enhancements (bounding volume hierarchy or the fast ray-box intersection routine), was found to produce a similar scan in 15,360 s. When implementing the enhanced ray tracing techniques, the XCAT projection algorithm was found to run significantly faster, generating the projections in only 4096 s. However, the optimized XCAT projection algorithm is still about three times slower than the two analytical algorithms for the specified anatomy. But, the projections generated using the XCAT can be seen to offer a higher level of anatomical realism (Fig. 6). The XCAT simulator therefore offers a trade-off in terms of realism and computational speed. The disadvantage in terms of speed can be overcome, though, by running the simulator in parallel, spreading the projection angles over multiple processors. For this particular simulation, one would only need to run the XCAT simulator simultaneously on three processors to match the speed.
Figure 6.
Anterior projections of the FORBILD (b), superquadric (c), and XCAT (d) phantoms as compared to an actual chest x-ray (a). Each phantom is modeling the same amount of structures for comparison. Images of the FORBILD and superquadric phantom are from Ref. 10.
Simulation of realistic 3D and 4D CT data from the XCAT
To further demonstrate the capabilities of the XCAT-based projector, we utilized it to generate 3D and 4D CT data sets from different patient anatomies. For each simulation, the XCAT was set up to include the entire available anatomy including over 900 different structures. Iodine contrast was modeled in the blood of the heart to better show the four chambers. The x-ray projections were generated using a standard chest x-ray polychromatic energy spectrum with a tube voltage of 120 keV obtained from the Catalogue of Spectral Data for Diagnostic X-rays.47 Sampling the spectrum in steps of 0.5 keV, 256 noise-free 256×256 x-ray projections (FOV=400 mm) were generated in a circular arc around the phantom. The projections were reconstructed using the standard filtered backprojection reconstruction method. Each of the 256×256×256 polychromatic projection scans took ∼3 h to generate using a single 3.2 GHz processor.
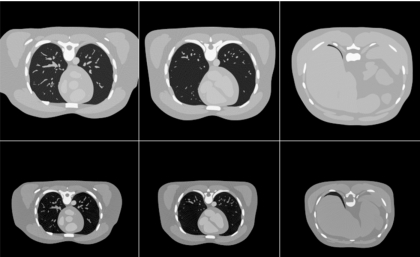
Figure 7 shows chest x-ray projections generated from the XCAT modeling the anatomy of the original Visible Male adult as well as that of a 12 year old boy. Figure 8 shows reconstructed CT images of the same cases. The anatomy of the boy subject was created using a graphical application that includes tools to transform the template anatomy of the phantom to match it to sets of patient data.48 As described above, the same imaging parameters were used to simulate the CT data from each phantom. The figures show the high degree of realism offered by the XCAT phantom. They also illustrate the effect anatomy can have on image quality. An increase in contrast in the images can be seen as the body size decreases from that of the adult subject to that of the child. Realistic simulation, such as that provided by the tools developed in this work, can provide a vital tool to investigate the effect of anatomy on CT images. Various scanning parameters can be altered and their effects can be witnessed on anatomically variable subjects. Through such studies, one can devise patient specific imaging protocols so as to reduce radiation dose while maintaining a diagnostic image quality.
Figure 7.
Anterior chest x-ray projections simulated from the XCAT phantom modeling the anatomy of an adult male (original Visible Human Male) and a 12 year old boy.
Figure 8.
Reconstructed CT transaxial slices simulated from the XCAT phantom modeling the anatomy of an adult male and a 12 year old boy.
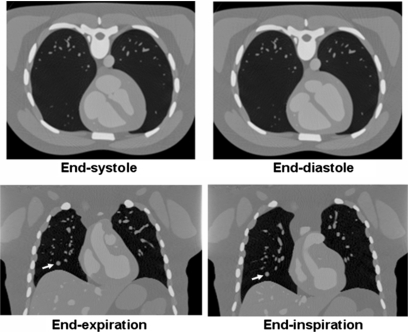
Figure 9 shows 4D cardiac-gated and respiratory-gated CT simulated images. The XCAT provides a realistic and flexible model of these involuntary motions based on an analysis of several sets of patient data. Both models are capable of simulating different normal and abnormal motions. The heart motion can be altered through modification of various parameters (ejection fraction, longitudinal and radial contraction, cardiac twist, heart rate, etc.). Global or regional cardiac motion abnormalities can be simulated using a graphical application.49 The respiratory model is similarly parameterized and includes the ability to model lung nodules.50, 51 Nodules of any given size, shape, contrast, and location can be modeled as 4D NURBS surfaces within the phantom. The nodules will move inside the lungs with the respiratory motion. With these abilities, the XCAT can be used to generate populations of subjects with variable cardiac and respiratory motions to investigate 4D CT imaging techniques.
Figure 9.
Cardiac-gated (top) and respiratory-gated (bottom) CT images generated using the 4D XCAT. A spherical lesion (arrow) was simulated in the respiratory-gated images.
DISCUSSION AND CONCLUSIONS
As demonstrated above, the 4D XCAT can realistically model the complex shapes of real human organs and has the flexibility to model anatomical variations and normal physiologic motion. A prior limitation to the phantom, in terms of its applicability to high-resolution x-ray CT research, was that the mathematical complexity of the surfaces that define the organs and structures makes the direct calculation of projection data more computationally intense. In this work, we overcame this limitation by using efficient ray tracing techniques from computer graphics to develop a fast analytic CT projection algorithm for the 4D XCAT phantom. In a direct comparison (same anatomical structures and geometry) with two analytical CT projectors using geometrically defined organs, the XCAT-based projector was found to produce more realistic results at the cost of being three times slower (as timed using a single 3.2 GHz processor). The XCAT projector, therefore, involves a slight trade-off between realism and computational time. In terms of the level of realism, the XCAT offers a vast improvement as can be seen in the example simulations presented in the paper. In terms of computational speed, the projector is not dramatically different from the two geometry-based projectors. Even using the entire anatomy of the phantom, which includes over 900 structures, the XCAT-based projector can still generate CT data within a matter of hours. This time can be decreased further by running the projector in parallel, spreading the projection angles over multiple processors. Simulations may be obtained in a matter of minutes depending on the number of processors used. The XCAT projector is, therefore, a viable tool for use in CT imaging research. Given the ever decreasing cost of computers and the rise of faster processors and multi-processor systems and clusters, the distinction between this method and those based on simple mathematical phantoms will continue to diminish.
When used in combination with the 4D XCAT phantom, with its realistic model of the human anatomy and its ability to model anatomical variations and patient motion, the CT simulator can be used to produce a wealth of simulated image data that are far more consistent with that of actual patients. Any number of different anatomies (male or female, adult or pediatric), cardiac or respiratory motions or patterns, and spatial resolutions can be simulated to perform research. As x-ray CT evolves toward 4D dynamic functional imaging, the XCAT-based CT simulator will have application in a broad range of imaging research in developing image acquisition strategies, image processing and reconstruction methods, and image visualization and interpretation techniques. Also, the simulation tools provide the necessary foundation to optimize clinical CT applications so as to obtain the highest possible image quality with the minimum possible radiation dose to the patient, an area of research that is becoming more significant with the proliferation of CT protocols. We conclude that the 4D XCAT and the CT projector developed in this work will provide vital research tools in high-resolution CT imaging research.
ACKNOWLEDGMENTS
The authors would like to thank Dr. Jiehua Zhu of Georgia Southern University for her help in comparing the computational speed of the XCAT projector to that of her superquadric-based phantom and the FORBILD phantom. This work was supported by Grants No. R01 EB001838 and R01 EB000168from the National Institutes of Health.
References
- Shi C. Y. and Xu X. G., “Development of a 30-week-pregnant female tomographic model from computed tomography (CT) images for Monte Carlo organ dose calculations,” Med. Phys. 10.1118/1.1778836 31, 2491–2497 (2004). [DOI] [PubMed] [Google Scholar]
- Xu X. G., Chao T. C., and Bozkurt A., “VIP-man: An image-based whole-body adult male model constructed from color photographs of the visible human project for multi-particle Monte Carlo calculations,” Health Phys. 10.1097/00004032-200005000-00003 78, 476–486 (2000). [DOI] [PubMed] [Google Scholar]
- Zubal I. G. et al. , “Computerized three-dimensional segmented human anatomy,” Med. Phys. 10.1118/1.597290 21, 299–302 (1994). [DOI] [PubMed] [Google Scholar]
- Kramer R. et al. , “MAX06 and FAX06: update of two adult human phantoms for radiation protection dosimetry,” Phys. Med. Biol. 10.1088/0031-9155/51/14/003 51, 3331–3346 (2006). [DOI] [PubMed] [Google Scholar]
- Lee C., Williams J., and Bolch W., “The UF series of tomographic anatomic models of pediatric patients,” Med. Phys. 10.1118/1.2107067 32, 3537–3548 (2005). [DOI] [PubMed] [Google Scholar]
- Kramer R. et al. , “All about FAX: a female adult voxel phantom for Monte Carlo calculation in radiation protection dosimetry,” Phys. Med. Biol. 10.1088/0031-9155/49/23/001 49, 5203–5216 (2004). [DOI] [PubMed] [Google Scholar]
- Kramer R. et al. , “All about MAX: a male adult voxel phantom for Monte Carlo calculations in radiation protection dosimetry,” Phys. Med. Biol. 10.1088/0031-9155/48/10/301 48, 1239–1262 (2003). [DOI] [PubMed] [Google Scholar]
- Petoussi-Henss N. et al. , “The GSF family of voxel phantoms,” Phys. Med. Biol. 10.1088/0031-9155/47/1/307 47, 89–106 (2002). [DOI] [PubMed] [Google Scholar]
- FORBILD Thorax Phantom (cited; available from: http://www.imp.uni-erlangen.de/forbild/english/forbild/index.html).
- Zhu J. et al. , “Computed tomography simulation with superquadrics,” Med. Phys. 10.1118/1.2040727 32, 3136–3143 (2005). [DOI] [PubMed] [Google Scholar]
- Han E. Y., Bolch W. E., and Eckerman K. F., “Revisions to the ORNL series of adult and pediatric computational phantoms for use with the mird schema,” Health Phys. 10.1097/01.HP.0000192318.13190.c4 90, 337–356 (2006). [DOI] [PubMed] [Google Scholar]
- Peter J., Gilland D. R., Jaszczak R. J., and Coleman R. E., “Four-dimensional superquadric-based cardiac phantom for Monte-Carlo simulation of a radiological imaging system,” IEEE Trans. Nucl. Sci. 10.1109/23.819306 46, 2211–2217 (1999). [DOI] [Google Scholar]
- Pretorius P. H. et al. , “A mathematical model of motion of the heart for use in generating source and attenuation maps for simulating emission imaging,” Med. Phys. 10.1118/1.598746 26, 2323–2332 (1999). [DOI] [PubMed] [Google Scholar]
- Lee C. et al. , “Hybrid computational phantoms of the male and female newborn patient: NURBS-based whole-body models,” Phys. Med. Biol. 10.1088/0031-9155/52/12/001 52, 3309–3333 (2007). [DOI] [PubMed] [Google Scholar]
- Segars W. P., Lalush D. S., and Tsui B. M. W., “A realistic spline-based dynamic heart phantom,” IEEE Trans. Nucl. Sci. 10.1109/23.775570 46, 503–506 (1999). [DOI] [Google Scholar]
- Segars W. P., Lalush D. S., and Tsui B. M. W., “Modeling respiratory mechanics in the MCAT and spline-based MCAT phantoms,” IEEE Trans. Nucl. Sci. 10.1109/23.910837 48, 89–97 (2001). [DOI] [Google Scholar]
- Segars W. P., Ph.D. thesis, “Development and application of the new dynamic NURBS-based cardiac-torso (NCAT) phantom,” Biomedical Engineering, University of North Carolina: Chapel Hill, NC, 2001. [Google Scholar]
- Garrity J. et al. , “Development of a dynamic model for the lung lobes and airway tree in the NCAT phantom,” IEEE Trans. Nucl. Sci. 10.1109/TNS.2003.812445 50, 378–383 (2003). [DOI] [Google Scholar]
- Segars W. P.et al. , “Extension of the 4D NCAT phantom to dynamic x-ray CT simulation,” in IEEE Nuclear Science Symposium and Medical Imaging Conference, Portland, OR, 2003.
- Piegl L., “On NURBS: a survey,” IEEE Comput. Graph. Appl. 11, 55–71 (1991). [Google Scholar]
- Piegl L. and Tiller W., The Nurbs Book (Springer-Verlag, New York, 1997). [Google Scholar]
- Visible Human Male and Female Datasets, http://www.nlm.nih.gov/research/visible/visible_human.html.
- He X., Links J. M., Gilland K. L., Tsui B. M. W., and Frey E. C., “Comparison of 180 degrees and 360 degrees acquisition for myocardial perfusion SPECT with compensation for attenuation, detector response, and scatter: Monte Carlo and mathematical observer results,” J. Nucl. Cardiol. 13, 345–353 (2006). [DOI] [PubMed] [Google Scholar]
- He X. et al. , “A mathematical observer study for the evaluation and optimization of compensation methods for myocardial SPECT using a phantom population that realistically models patient variability,” IEEE Trans. Nucl. Sci. 10.1109/TNS.2004.823331 51, 218–224 (2004). [DOI] [Google Scholar]
- Watt A. and Watt M., Advanced Animation and Rendering Techniques (Addison-Wesley, New York, 1998). [Google Scholar]
- Lane J. M. and Riesenfeld R. F., “A theoretical development for the computer generation and display of piecewise polynomial surfaces,” IEEE Trans. Pattern Anal. Mach. Intell. 2, 35–46 (1980). [DOI] [PubMed] [Google Scholar]
- Giesow A., Ph.D. thesis, “Surface interrogations,” School of Computing Studies and Accountancy, University of East Anglia, 1983. [Google Scholar]
- Lasser D., “Intersection of parametric surfaces in the Bernstein-Bezier representation,” Comput.-Aided Des. 18, 186–192 (1986). [Google Scholar]
- Rossignac J. R. and Requicha A. A. G., “Piecewise-circular curves for geometric modeling,” IBM J. Res. Dev. 31, 296–313 (1987). [Google Scholar]
- Farouki R. T., “The characterization of parametric surface sections,” Comput. Vis. Graph. Image Process. 33, 209–236 (1986). [Google Scholar]
- Bajaj C. L. et al. , “Tracing surface intersections,” Comput. Aided Geom. Des. 5, 285–307 (1988). [Google Scholar]
- Barnhill R. E. and Kersey S. N., “A marching method for parametric surface/surface intersection,” Comput. Aided Geom. Des. 7, 257–280 (1990). [Google Scholar]
- Kriezis G. A., Patrikalakis N. M., and Wolter F. E., “Topological and differential equation methods for surface intersections,” Comput.-Aided Des. 24, 41–55 (1992). [Google Scholar]
- Boehm W., “Inserting new knots into B-spline curves,” Comput.-Aided Des. 10.1016/0010-4485(80)90154-2 12, 199–201 (1980). [DOI] [Google Scholar]
- Cohen E., Lyche T., and Riesenfeld R., “Discrete B-splines and subdivision techniques in computer-aided geometric design and computer graphics,” Comput. Graph. Image Process. 10.1016/0146-664X(80)90040-4 14, 87–111 (1980). [DOI] [Google Scholar]
- Foley J.et al. , Computer Graphics, 2nd Edition in C (Addison-Wesley, New York, 1997). [Google Scholar]
- Nishita T. and Sederberg T. W., “Ray tracing trimmed rational surface patches,” Comput. Graph. (ACM) 24, 337–345 (1990). [Google Scholar]
- Martin W. et al. , “Practical ray tracing of trimmed NURBS surfaces,” J. Comput. Graphics Tools 5, 27–52 (2000). [Google Scholar]
- Sweeney M. and Bartels R., “Ray tracing free-form B-spline surfaces,” IEEE Comput. Graph. Appl. 2, 41–49 (1986). [Google Scholar]
- Yang C. -G., “On speeding up ray tracing of B-spline surfaces,” Comput.-Aided Des. 10.1016/0010-4485(87)90196-5 19, 122–130 (1987). [DOI] [Google Scholar]
- Kay T. and Kajiya J., “Ray-tracing complex scenes,” ACM SIGGRAPH Computer Graphics 20, 269–278 (1986). [Google Scholar]
- Williams A. et al. , “An efficient and robust ray-box intersection algorithm,” J. Comput. Graph. Tools 10, 49–54 (2005). [Google Scholar]
- White D. R., “Tissue substitutes in experimental radiation physics,” Med. Phys. 10.1118/1.594456 5, 467–479 (1978). [DOI] [PubMed] [Google Scholar]
- Hubbell J. H., “Photon mass attenuation and energy-absorption coefficients from 1 keV to 20 MeV,” Int. J. Appl. Radiat. Isot. 10.1016/0020-708X(82)90248-4 33, 1269–1290 (1982). [DOI] [Google Scholar]
- Müeller-Merbach J., Report LiTH-ISY-R-1866, Department of Electrical Engineering, Linköpings University, Linköping, Sweden, 1996.
- Forbild, http://www.imp.uni-erlangen.de/forbild, 2003.
- Cranley K., Gilmore B. J., Fogarty G. W. A., and Desponds L., Institute of Physics and Engineering in Medicine Report 78: Catalogue of diagnostic x-ray spectra and other data (CD ROM edition prepared by D. Sutton, http://www.ipem.org.uk) (1997).
- Segars W. P., Lalush D. S., and Tsui B. M. W., “Development of an interactive software application to model patient populations in the spline-based MCAT phantom,” IEEE Trans. Nucl. Sci. (in press). [Google Scholar]
- Segars W. P., Lee T. S., and Tsui B. M. W., “Simulation of motion defects in the 4D NCAT cardiac model,” J. Nucl. Med. 44, 142P–142P (2003). [Google Scholar]
- Smyczynski M.et al. , “Impact of respiratory motion on the detection of solitary pulmonary nodules with SPECT imaging of NeoTect. in IEEE Medical Imaging Conference and Nuclear Science Symposium, Norfolk, VA, 2002. [DOI] [PMC free article] [PubMed]
- Smyczynski M.et al. , “Modeling the Respiratory Motion of Solitary Pulmonary Nodules for Investigating SPECT Tumor Imaging,” in IEEE Medical Imaging Conference and Nuclear Science Symposium, San Diego, CA, 2001.


