Abstract
Monte Carlo simulations were used to evaluate the radiation dose to infinitely long cylinders of water, polyethylene, and poly(methylmethacrylate) (PMMA) from 10 to 500 mm in diameter. Radiation doses were computed by simulating a 10 mm divergent primary beam striking the cylinder at z=0, and the scattered radiation in the −z and +z directions was integrated out to infinity. Doses were assessed using the total energy deposited divided by the mass of the 10-mm-thick volume of material in the primary beam. This approach is consistent with the notion of the computed tomography dose index (CTDI) integrated over infinite z, which is equivalent to the dose near the center of an infinitely long CT scan. Monoenergetic x-ray beams were studied from 5 to 140 keV, allowing polyenergetic x-ray spectra to be evaluated using a weighted average. The radiation dose for a 10-mm-thick CT slice was assessed at the center, edge, and over the entire diameter of the phantom. The geometry of a commercial CT scanner was simulated, and the computed results were in good agreement with measured doses. The absorbed dose in water for 120 kVp x-ray spectrum with no bow tie filter for a 50 mm cylinder diameter was about 1.2 mGy per mGy air kerma at isocenter for both the peripheral and center regions, and dropped to 0.84 mGy∕mGy for a 500-mm-diam water phantom at the periphery, where the corresponding value for the center location was 0.19 mGy∕mGy. The influence of phantom composition was studied. For a diameter of 100 mm, the dose coefficients were 1.23 for water, 1.02 for PMMA, and 0.94 for polyethylene (at 120 kVp). For larger diameter phantoms, the order changed—for a 400 mm phantom, the dose coefficient of polyethylene (0.25) was greater than water (0.21) and PMMA (0.16). The influence of the head and body bow tie filters was also studied. For the peripheral location, the dose coefficients when no bow tie filter was used were high (e.g., for a water phantom at 120 kVp at a diameter of 300 mm, the dose coefficient was 0.97). The body bow tie filter reduces this value to 0.62, and the head bow tie filter (which is not actually designed to be used for a 300 mm object) reduces the dose coefficient to 0.42. The dose in CT is delivered both by the absorption of primary and scattered x-ray photons, and at the center of a water cylinder the ratio of scatter to primary (SPR) doses increased steadily with cylinder diameter. For water, a 120 kVp spectrum and a cylinder diameter of 200 mm, the SPR was 4, and this value grew to 9 for a diameter of 350 mm and to over 16 for a 500-mm-diam cylinder. A freely available spreadsheet was developed to allow the computation of radiation dose as a function of object diameter (10–500 mm), composition (water, polyethylene, PMMA), and beam energy (10–140 keV, 40–140 kVp).
Keywords: Monte Carlo, computed tomography, dosimetry
INTRODUCTION
Radiation dose to patients undergoing computed tomography (CT) examinations has come under increased scrutiny due to the increasing utilization of CT in the clinical environment. Despite the advancements in scanner technology and the excellent image quality that these systems produce, radiation dose assessment in computed tomography remains a source of controversy.1, 2, 3, 4, 5 There are a number of reports on CT dose assessment for human imaging,6, 7, 8, 9, 10, 11, 12, 13 small animal,14 and breast applications,15, 16 each of these focusing on a specific object size range and x-ray energy realm. The range of diameters for small animal imaging17, 18 spans approximately 10–50 mm. For breast imaging15, 19, 20, 21 this range is approximately 80–180 mm, and other human imaging applications span diameters from about 100–500 mm. Indeed in clinical imaging applications alone, high resolution clinical CT scanners are being used to scan the finger22 and the wrist.23, 24 The average adult head is approximately 170 mm in diameter25 and in the body, larger patients can extend to 500 mm in diameter.
Given the use of CT technology for research animals and humans ranging from 10 mm in diameter up to 500 mm in diameter, there is utility in the assessment of CT over a comprehensive range of object diameters. In addition, the assessment of CT dose over a comprehensive range of object diameters provides insight into the overall physical trends in dose behavior as a function of object size. Thus, the scientific focus of this research was to use Monte Carlo dosimetry techniques to compute CT dose coefficients over a wide range of object diameters. The comprehensiveness of this effort serves to unify CT dosimetry across a range of applications. An additional purpose of this investigation was to study the influence of parameters (other than diameter) on CT dosimetry including x-ray beam energy, bow tie filter characteristics, object composition, and position within the cylindrical object being scanned.
The extensive Monte Carlo results produced in this research were tabulated in spreadsheet format, and an additional purpose of this research was to provide this data, in a relatively ubiquitous format, to interested parties. To further facilitate the utility of these data, an interactive tool was developed which allows users to compute CT dose coefficients over a range of x-ray spectral properties, for three different phantom compositions.
METHODS AND MATERIALS
The previously validated SIERRA Monte Carlo code26, 27 was used as the computational engine for this investigation. The SIERRA code tracks the propagation of x-ray photons and their ultimate energy deposition and includes the photoelectric, Rayleigh scattering, and Compton scattering interactions. The code tracks each photon until it is absorbed by photoelectric absorption, or escapes the volume of the phantom. Because the fluorescent yield for elements Z<10 is negligible, the propagation of characteristic radiation was not necessary for the low z phantoms used in this study. Therefore, the energy deposition from photoelectric interactions was tallied entirely at the site of interaction. The SIERRA code models the cylinder analytically, and it is not a voxelized Monte Carlo code system. The attenuation coefficients used in the simulations were reported previously.28
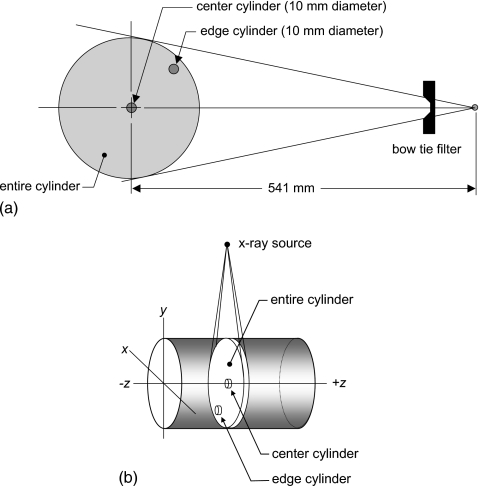
For this investigation, the x-ray source rotated 2π around the cylinder being scanned [Fig. 1a] with no translation along the z axis. A source-to-isocenter (SIC) distance of 541 mm was used for this work, corresponding to that of a clinical CT scanner (Lightspeed models, General Electric Medical Systems, Waukesha, WI). A previous investigation14 demonstrated that when the output levels of the scanner are normalized to the air kerma at isocenter of a CT scanner, that there is little dependence on the source-to-isocenter distance.
Figure 1.
(a) The geometry of the computer simulations is shown. PMMA, polyethylene, and water were used as phantom compositions. The simulations included the head and body bow tie filters, as well is no bow tie filter. Dose was computed at the center of the cylinder, at the edge, and over the entire 10-mm-thick slab of the cylinder as well. (b) The x, y, z coordinate system typically used in CT is illustrated. The doses computed in this research involved the smooth rotation of the x-ray source 2π around the cylinder, with no advancement along the z axis. The locations of the center, edge, and entire CT volumes for dose computation are shown, and in each case these cylindrical volumes were 10 mm long in the z dimension.
The Monte Carlo studies were conducted on water (H2O, ρ=1.0), high density polyethylene ([C2H4]n, ρ=0.97), and poly(methylmethacrylate)(PMMA, [C5O2H8]n, ρ=1.19) mathematical phantoms. PMMA is a commonly used x-ray phantom, and water is approximately tissue equivalent. The high density polyethylene that was simulated is a good substitute for adipose tissue, with an average 2% difference in the mass attenuation coefficients from 20 to 150 keV.
For the majority of studies, the cylinder of a given diameter was assumed to extend infinitely in both the −z and +z directions. Exceptions to this assumption were made for comparing and validating the Monte Carlo results against the measured computed tomography dose index (CTDI100) data published by the IMPACT group in the United Kingdom,29 where a 140-mm-long phantom was used. For the comparisons with IMPACT, the length of the phantom in the Monte Carlo simulations was also adjusted to 140 mm. Photons exiting the ends of the phantom were lost and thus did not contribute further to dose in the phantom. To make the comparisons with the IMPACT data which were measured in air, the Monte Carlo derived doses measured in the PMMA medium were then multiplied by , computed over the appropriate x-ray spectrum.
The collimated slice thickness of the CT beam (measured at the isocenter) was 10 mm along the z axis in all cases, using a point source of radiation that rotated uniformly and at constant velocity around the cylinder. The point source presents no x-ray beam penumbra, however divergence of the x-ray beam in both dimensions (fan and cone angles) was modeled. Thus, the irradiated slab of the object material included divergence in the z dimension as well as in the fan beam direction. The source geometry assumptions (point source and no penumbra) have negligible influence on the accuracy of the results. While the ideal source geometry assumptions inaccurately describe the exact shape at the edges of the dose profiles along the z dimension compared to an actual CT scanner, because the primary and scattered energy deposition are integrated over infinite z (from z=−∞ toz=+∞), these effects become negligible.
Although the incident radiation beam measured 10 mm wide at the isocenter, all primary and scattered radiation deposited along the entire z-axis (from z=−∞ to z=+∞) at an (x,y) position in each cylinder was tallied, and thus the equilibrium dose is presented here.4 Radiation dose to the phantom was tallied as a function of position in the phantom, using 1.0 mm (in x) ×1.0 mm (in y) ×∞ (in z) voxels. The energy E deposited along the length of a cylinder of diameter d was integrated along z, and the dose to a 10-mm-thick (T) cylinder in the primary x-ray beam was computed using
| (1) |
where T=10 mm for this study. The multiple scan average dose (MSAD) and CTDI∞ represent the equilibrium value of the accumulated dose at the center of the scan length (z=0), resulting from a series of multiple contiguous axial scans spaced at equal intervals T (or a helical scan with a pitch =1), and covering a sufficient length of phantom to allow the center dose to reach its asymptotic upper limit. Using this approach, the absorbed closes to a 10-mm-diam cylinder placed at the concentric center of the cylindrical phantom, and to a 10-mm-diam cylinder located at the periphery of the cylindrical phantom (with the hole center placed 10 mm from the edge) were assessed. The location of the center and peripheral cylinders used for dose measurement converged for a phantom diameter of 20 mm. These two cylinders approximate the measurements typically made by medical physicists at the center and edge of PMMA dosimetry phantoms. The radiation dose using the CTDI∞ metric was also averaged over the entire volume of the 10-mm-thick CT slice [Fig. 1b]. The absorbed dose was computed to the medium for the specific composition of the phantom used in the Monte Carlo procedure—PMMA, water, or polyethylene.
Clinical CT scanners make routine use of a beam-shaping filter (“bow-tie” filter), and so any dosimetric study involving clinical CT scanners also needs to include the contribution of these filters. In this investigation, the proprietary filter characteristics of a commercial CT manufacturer (General Electric Medical Systems, Waukesha, WI) were used under a proprietary agreement from the vendor. For each Monte Carlo computational run, photons could be tracked using no bow tie filter, the head bow tie filter, and the body bow tie filter simultaneously, using a photon-weighting scheme that factored in the angular and energy dependencies of the bow tie filter. Secondary radiation such as scatter or x-ray fluorescence from the bow tie filter was not modeled. While the bow tie filter results in this investigation are specific to the GE bow tie filters, bow tie filters are sufficiently similar that the dose data reported here should be reasonable approximations to other vendors’ scanners as well.
For each Monte Carlo run, 107 photons were tallied for each diameter, composition, and monoenergetic x-ray energy. Simulations were performed from 5 to 140 keV, in 1 keV steps. The raw monoenergetic data were weighted to compute doses for polyenergetic spectra. The dose data were computed and normalized for various computer generated x-ray spectra30 and monoenergetic beams for an air kerma of 1.0 mGy at the isocenter of the scanner. To match the spectral model to the extent possible to the spectra emitted by the CT scanner, the half value layer (HVL) at each kVp (80, 100, 120, and 140 kVp) was physically measured (in the central beam) on the GE Lightspeed scanner.25 Aluminum filtration was then added to the modeled x-ray spectra at each kVp to produce the same HVL as in the measured x-ray beam.
The doses are reported as dose coefficients (mGy absorbed dose in the medium per mGy air kerma at isocenter). Each monoenergetic Monte Carlo data set was normalized as mGy per 106 photon∕mm2. The x-ray spectra used in this investigation were normalized to 1 mGy air kerma at isocenter, and after normalization the number of monoenergetic x rays in each energy bin were known and these values were then used to weight the dose coefficient. While the dose coefficients demonstrate perhaps up to 2% uncertainty for individual monoenergetic beams (which use the data from just one Monte Carlo run), dose coefficients for polyenergetic x-ray spectra make use of the weighted average from many Monte Carlo runs (depending on kVp) and have fluctuations on the order of 0.5%.
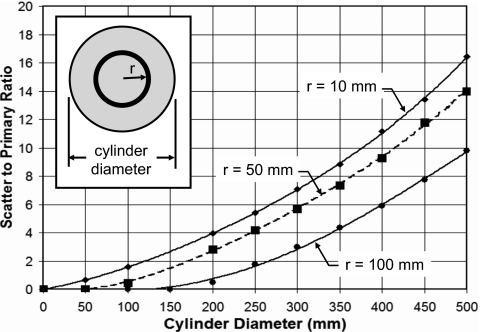
The SIERRA code was used to evaluate the scatter to primary ratio (SPR) from the center to the edge of water cylinders ranging from 50 to 500 mm in diameter. The energy deposited from primary photons was tallied as Ep, and that from scattered photons was tallied as Es. The energy deposition events included photoelectric absorption as well as the energy deposited at the site of a Compton scattering event. The SPR was computed for each annulus of width Δr=10 mm, from the center (where the region is a cylinder) to the periphery of the phantom:
| (2) |
In order to perform the spectral weighting using the monoenergetic Monte Carlo data, and to provide a degree of flexibility in CT dose calculations, a spreadsheet based tool was developed (Excel, Microsoft Corporation, Redmond, WA). Using visual basic programming, the interactive spreadsheet allows the user to mathematically generate a polyenergetic x-ray spectrum ϕ(E) by selecting the kVp and amount of added Al or Cu filtration. This is achieved by incorporating the spectral modeling procedure reported elsewhere30 in the spreadsheet. After the polyenergetic spectrum is computed, the monoenergetic dose coefficient data for the center (L=c), edge (L=e), or over the entire slice volume of the cylinder (L=v) is used to produce polyenergetic dose coefficients using a weighted averaging procedure:
| (3) |
where the spectrum was normalized to 1 mGy air kerma at isocenter. The locations (L) of the center, edge, and entire cylinder volume used for dose computation are illustrated in Fig. 1b.
The spreadsheet has tabulated dose coefficient data for energies from 5 to 140 keV, for three phantom compositions (PMMA, water, and polyethylene), and for phantom diameters of 10, 20, 30, 40, 50, 60, 70, 80, 90, 100, 120, 140, 160, 180, 200, 250, 300, 320, 350, 400, 450, and 500 mm. In order to interpolate to other phantom diameters between 1 and 500 mm, the curve fitting functions inherent to Excel can be selected and used. The default interpolation function is a sixth order polynomial, and this was selected because it proved to be more robust compared to the other interpolating functions in our testing of the dose calculation tool.
RESULTS
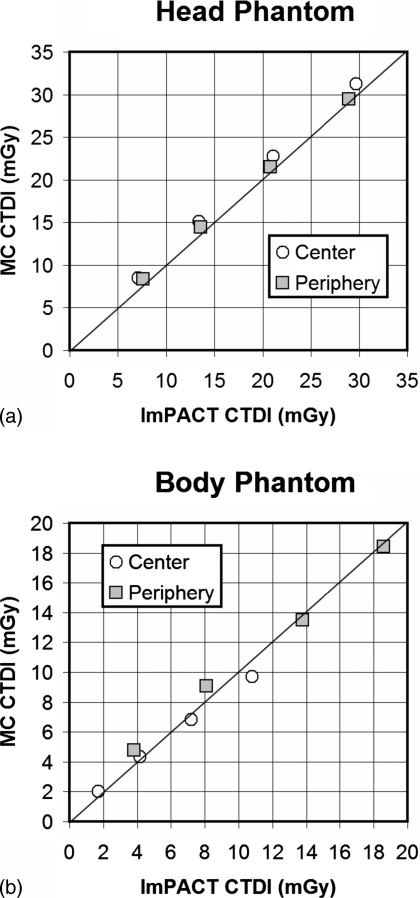
In order to validate the Monte Carlo simulations used in this research, over and above previously reported efforts,26, 27 simulations were performed to model physical CTDI100 measurements performed by the ImPACT group in the United Kingdom.31
Comparisons between the Monte Carlo results and ImPACT data are illustrated in Fig. 2. Figure 2a illustrates a comparison between CTDI metrics in the head phantom (160-mm-diam PMMA), while Fig. 2b illustrates the results of these comparisons in the larger body phantom (320-mm-diam PMMA). In general, good agreement is seen between the Monte Carlo determined metrics and the physically measured values from the ImPACT group.
Figure 2.
(a) Comparisons are shown between the ImPACT CTDI100 values for the head phantom (16-cm-diam PMMA) and head bow tie filter for the GE Lightspeed 16 slice scanner, and those determined in this work by Monte Carlo evaluation. Good agreement is seen, although there is a slight upward bias by the Monte Carlo data, averaging 8.2%. The four values for each location correspond to 80, 100, 120, and 140 kVp—increasing kVp towards the right in the graph. (b) The CTDI100 values from ImPACT are compared for the body phantom (32-cm-diam PMMA) and body bow tie filter against the Monte Carlo determined values, and again good correspondence between the measured and simulated values is observed. The differences between the CTDI100 values for the body average 4.9%.
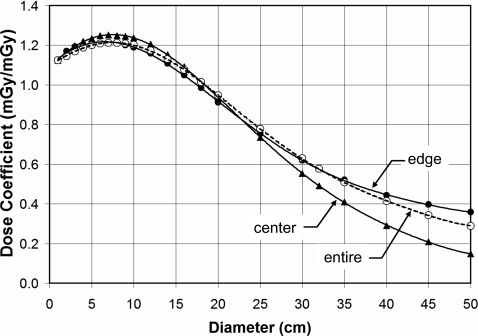
Figure 3 illustrates the diameter dependence of dose for the center and peripheral regions of a water cylinder. The dose averaged over the entire 10-mm-thick slice is also shown. These data are for 120 kVp (HVL=8.3 mm Al), and the body bow tie filter. There is an initial increase in the dose coefficient, and then a subsequent decrease, as the cylinder increases in diameter.
Figure 3.
The dose (CTDI∞) in infinitely long water cylinders as a function of diameter for a 120 kVp (HVL=8.3 mm AI) x-ray spectrum, with the body bow tie filter, is shown. The dose coefficients at the edge, center, and averaged over the entirety of the CT slice are illustrated.
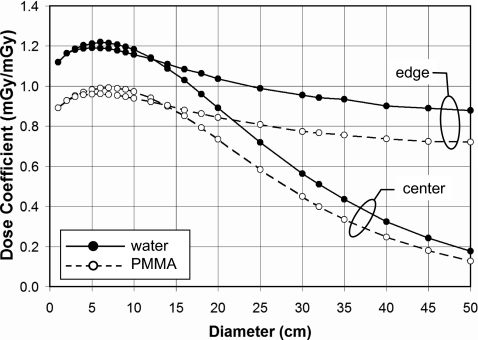
Figure 4 illustrates the diameter dependence of dose in water and PMMA, for both the peripheral and center locations. These data, for 120 kVp and no bow tie filter, demonstrate the differences between water and PMMA dosimetry, where the doses to PMMA follow the same general trends as for water but are lower in magnitude due in part to differences in the ratio of the mass energy attenuation coefficient to that of air , which is about 25% higher for water than for PMMA (largely due to the increased photoelectric absorption produced in water due to its oxygen content compared to the other lower Z hydrocarbons). For the larger phantom diameters, differences in attenuation produced by differences in density and mass attenuation coefficients will also play a role. While the dose to the center location decreases with diameters greater than about 100 mm due to the increasing attenuation path, the peripheral dose does not plummet dramatically with increasing diameter. This is because the x-ray source contributes disproportionately to the peripheral region in the phantom when the entrant beam strikes the peripheral region directly (Fig. 1). In this case, the attenuation path to the peripheral cylinder through the phantom is only about 5 mm and the relative source intensity is greatest due to the inverse square law.
Figure 4.
The dose (CTDI∞) as a function of diameter is shown for the periphery and the center regions, for infinitely long water and PMMA cylinders. These data are for a 120 kVp spectrum (HVL=8.3 mm AI). No bow tie filter was used.
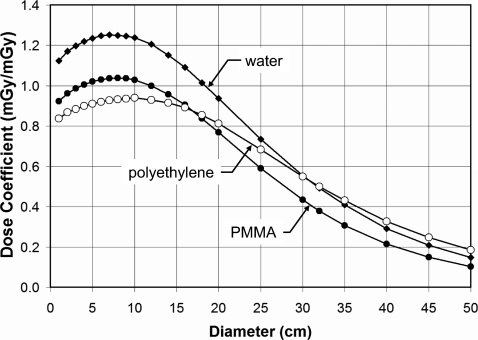
Figure 5 illustrates the doses for PMMA, water, and polyethylene at 120 kVp and with the body bow tie filter in place. As in Fig. 4, the water and PMMA phantoms have very similar trends with diameter, however the polyethylene phantom, which more closely resembles adipose tissue (about a 2% difference in mass attenuation coefficient, averaged from 20 to 150 keV), has a slightly different trend.
Figure 5.
This figure illustrates the effect of composition on dose (CTDI∞) in infinitely long cylindrical phantoms. At 120 kVp and with the body bow tie filter, these curves correspond to the center location in the phantom.
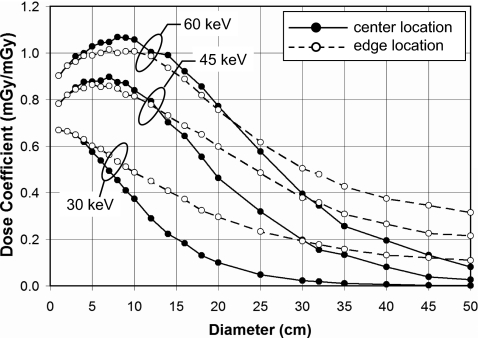
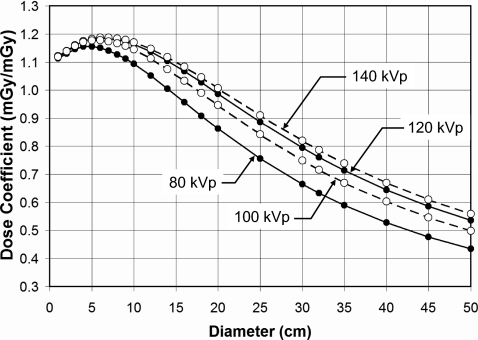
Figure 6 illustrates the doses at the center and periphery of cylindrical phantoms for monoenergetic x-ray beams at 30, 45, and 60 keV. These curves show the results for cylinders of PMMA composition and with a body bow tie filter. Whereas Fig. 6 illustrates the dependence of hypothetical monoenergetic x-ray beams, Fig. 7 illustrates the diameter dependence of x-ray spectra of 80, 100, 120, 140 kVp. These data are for no bow tie filter in water.
Figure 6.
Doses (CTDI∞) in infinitely long cylindrical phantoms for PMMA and with the body bow tie filter are shown for different monoenergetic x-ray beams. The ability of the lower energy photons to penetrate to the center to contribute to dose decreases with diameter, as expected, however even the 30 keV beam is capable of delivering reasonable radiation dose levels to the edge location on the phantom. The higher energy x-ray beams produce more scattered radiation, and hence a “bump” in the dose coefficient is seen for diameters from 10 to 70 mm.
Figure 7.
The phantom dose coefficients (CTDI∞) for water with no bow tie filter as a function of polyenergetic x-ray spectra at different tube voltages are shown. These doses are computed to the entire diameter of the cylinder, not the edge or center. The spectral filtration used for these data corresponded to the amount of Al necessary to deliver the HVLs reported previously see Ref. 25 for this scanner.
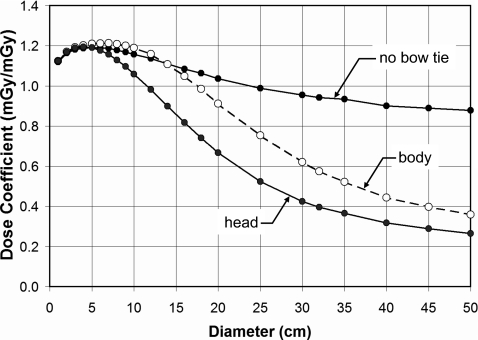
The bow tie filter has a profound influence in terms of the diameter dependence of dose, as seen in Fig. 8. Here, the curves correspond to no bow tie filter, a head bow tie filter, and a body bow tie filter. While the abscissa in Fig. 8 spans from 10–500-mm-diam cylinders, of course the head and the body bow tie filters are actually designed and used in clinical CT within a more narrow range of object diameters, with the average head being approximately 170 mm in diameter and the average body being in the range of 200–380 mm in diameter.
Figure 8.
The effect of the bow tie filter is illustrated in water at 120 kVp. Dose coefficients (CTDI∞) for infinitely long phantoms at the periphery of the cylinder are plotted. The head bow tie filter, being designed for typical 170-mm-diam heads, demonstrates more aggressive attenuation as a function of cylinder diameter, as expected.
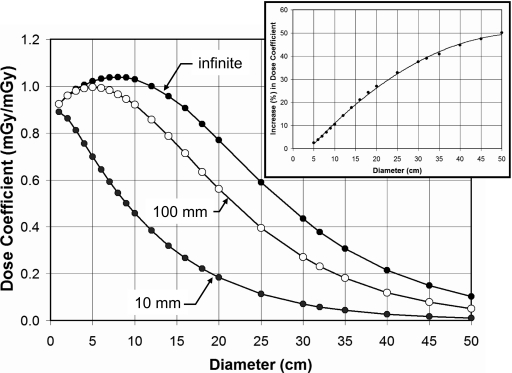
One of the contentious issues in regard to the use of the is whether or not the length of the chamber dramatically influences the dose measurement. The Monte Carlo code was modified to integrate the energy over a 10 mm length (in z), a 100 mm length (i.e., that of the standard pencil chamber), and over an infinite length [the default for the rest of the figures, except Figs. 2a, 2b]. Figure 9 illustrates the influence of this chamber length for the range of PMMA diameters with a body bow tie filter and for a 120 kVp x-ray spectrum at the center position. Clearly, there are large differences between CTDI100 and CTDI∞, as this graph illustrates, as has been discussed in the recent literature.2, 4, 5 Comparing CTDI∞ versus CTDI100, the increase in dose as a percentage is illustrated in the inset in Fig. 9. There is a monotonic increase in the dose coefficient, and the percent increase P is given by P=−7.8698+2.0772d−0.0187d2, where d is the diameter of the cylinder (r2=0.9988).
Figure 9.
This figure illustrates the effect of “chamber length” for a 120 kVp spectrum in PMMA with a body bow tie filter. The length of the phantom in all cases is infinite, while the length of integration was 10 mm, 100 mm, and infinite. Thus, this graph compares CTDI10mm, CTDI10mm, and CTDI∞ for the central measurement position. The inset shows the percent increase in dose coefficient as a function of cylinder diameter, from CTDI100 to CTDI∞.
A Monte Carlo run was performed as a function of cylinder diameter and energy for water, and both the scatter and primary doses deposited in various annuli in the phantom were tallied. This allowed the direct computation of the scatter to primary ratio (SPR) of dose at various radii in the phantom, as shown in Fig. 10. Scatter to primary dose contributions increase as expected with increasing cylinder diameter.
Figure 10.
The relative contribution to CTDI∞ from scatter and primary photon interactions is illustrated as the scatter to primary ratio (SPR), for three different radii (see inset). The relative dose from scatter is larger in the center of the cylinder compared to the edge, due to solid angle considerations.
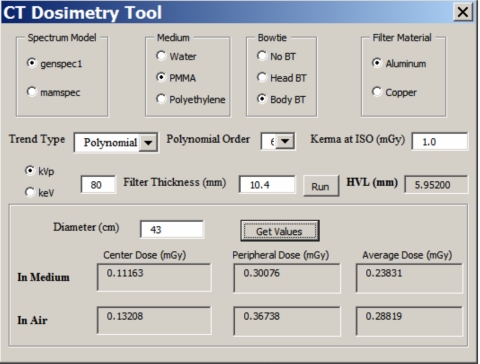
A picture of the interactive dose tool is shown in Fig. 11. This Excel macro program allows the user to select kVp and added filtration to generate a vast number of x-ray spectra. The tool reports back the computed HVL, which allows the user to better match the modeled spectrum to a measured one. The lower box in the tool allows the user to input a specific object diameter, and the macro then reports back the dose results (interpolated if necessary) for the center, edge, and entire cylinder volumes, for both the medium and air.
Figure 11.
A picture of the control box for the dose calculator macro is shown.
DISCUSSION
Composition differences illustrated in Fig. 5 include both elemental composition and density. At 10 mm diameter, the higher doses are for water at ρ=1.0, followed by PMMA with ρ=1.19, and the lowest doses are for polyethylene with ρ=0.97. In the limit of a zero diameter cylinder, the dose coefficients in Fig. 5 should in principle be equal to , the ratio of the mass energy absorption coefficient for the medium (water, PMMA, or polyethylene) to that of air. Indeed, extrapolating the first two points (at 10 and 20 mm) back to 0 mm cylinder diameter, the ratio of for water, PMMA, and polyethylene are within 1.8% of these ratios (computed for the 120 kVp spectrum) of 1.09, 0.87, and 0.78, respectively.
The influence of the bow tie filter (including “no” bow tie filter) on the CT dose coefficient is more pronounced at the periphery of the phantom, but is small at the center. Figure 8 shows the influence of bow tie filter selection on the dose coefficient. The shape of the curves for the head and body bow tie filters in part reflects the attenuation versus angle characteristics of the specific bow tie filter. The inverse square law also contributes to the shape of these curves. In CT, bow tie filters not only reduce the dynamic range of the signal which strikes the CT detector arrays through radiographic equalization, but they also reduce the dose at the periphery of the patient’s body. A properly constructed bow tie filter reduces dose with no loss of image quality, because of the manner in which noise propagates during image reconstruction.
The traditional 160 and 320 mm diameter PMMA phantoms used by most medical physicists for the evaluation of CTDI100 allow measurements to be performed at the center and at the periphery. The concept of the weighted CTDI (CTDIw) was developed31 to estimate the average dose to the entire slab from these two point measurements using
| (4) |
The Monte Carlo assessments performed in this investigation allow the direct measurement of the average dose to the slab of tissue in the primary beam, which is likely to be more accurate than estimates calculated using Eq. 4.
Limitations of this investigation include the assumption that the x-ray source is a point, and therefore the influence of the penumbra formed by an actual finite x-ray source interacting with the edges of the collimators was not simulated. While this assumption may have a small influence on the primary dose assessment used here, because the scattered energy was integrated over infinite z, the scatter dose would not be affected by the point source assumption. The fact that the majority of dose in CT is deposited by scattered radiation, which is shown in Fig. 10, further suggests that the point source assumption used in this study has little influence on the applicability of the data reported here to a CT scanner with finite focal spot dimensions.
The focus of this investigation was to demonstrate trends in CT dosimetry over a comprehensive range of object phantom diameters, x-ray energies, and phantom compositions. the data generated in these Monte Carlo studies may be useful for a range of dosimetry applications. To aid dose calculations for interested parties working in this area, the data presented are available in an interactive spreadsheet, described in Sec. 2, by request of the corresponding author (J.M.B.). This tool enables the computation of doses over a wide range of parameters, and the control box for this is shown in Fig. 11. The interactive macro allows the selection of the spectral model (low or high energy), phantom composition (water, PMMA, or polyethylene), bow tie filter (none, head, or body), the x-ray beam filter (Al or Cu), and the filter thickness. The dose computation tool shown in Fig. 11 was used to compute all of the data presented in Figs. 345678.
CONCLUSIONS
Monte Carlo techniques were used to evaluate the radiation dose to water, PMMA, and polyethylene, cylinders spanning a comprehensive range of diameters from 10 to 500 mm. The simulations were performed from 5 to 140 keV, which allow CT doses for polyenergetic spectra to be computed as well. The principal observations which resulted from this study are that for high energy x-ray beams typical of CT, CT dose coefficients experience a small increase and then a gradual decrease in value as the diameter of the cylinder increases (Fig. 3). The initial increase is the result of an increasing contribution of x-ray scatter to the total dose as the diameter of the cylinder increases (Fig. 10). When a bow tie filter is not used (which is uncommon in human imaging applications), the dose to the periphery of the patient cylinder is higher than when a bow tie filter is used, and this trend is more pronounced for larger diameter cylinders (Fig. 8). Last, the distance along the z dimension that is used to integrate scatter dose has a significant influence on the dose coefficient (Fig. 9), increasing to 50% for a 50-cm-diam cylinder.
ACKNOWLEDGMENTS
This research was supported by grants from the NCI (R21 CA111323, R24 CA110804, and P30 CA093373), NIBIB (R01 EB002138) and the California Breast Cancer Research Program (cBCRP 11IB-0114).
References
- McCollough C. H., “It is time to retire the computed tomography dose index (CTDI) for CT quality assurance and dose optimization. Against the proposition,” Med. Phys. 33, 1190–1191 (2006). [DOI] [PubMed] [Google Scholar]
- Boone J. M., “The trouble with CTD100,” Med. Phys. 10.1118/1.2713240 34, 1364–1371 (2007). [DOI] [PubMed] [Google Scholar]
- Brenner D. J., “It is time to retire the computed tomography dose index (CTDI) for CT quality assurance and dose optimization. For the proposition,” Med. Phys. 10.1118/1.2173933 33, 1189–1190 (2006). [DOI] [PubMed] [Google Scholar]
- Dixon R. L., “A new look at CT dose measurement: Beyond CTDI,” Med. Phys. 10.1118/1.1576952 30, 1272–1280 (2003). [DOI] [PubMed] [Google Scholar]
- Dixon R. L., “Restructuring CT dosimetry—a realistic strategy for the future Requiem for the pencil chamber,” Med. Phys. 10.1118/1.2336504 33, 3973–3976 (2006). [DOI] [PubMed] [Google Scholar]
- Shrimpton P. C. and Edyvean S., “CT scanner dosimetry,” Br. J. Radiol. 71, 1–3 (1998). [DOI] [PubMed] [Google Scholar]
- Jarry G., DeMarco J. J., Beifuss U., Cagnon C. H., and Nitt-Gray M. F., “A Monte Carlo-based method to estimate radiation dose from spiral CT: From phantom testing to patient-specific models,” Phys. Med. Biol. 10.1088/0031-9155/48/16/306 48, 2645–2663 (2003). [DOI] [PubMed] [Google Scholar]
- Huda W., Atherton J. V., Ware D. E., and Cumming W. A., “An approach for the estimation of effective radiation dose at CT in pediatric patients,” Radiology 203, 417–422 (1997). [DOI] [PubMed] [Google Scholar]
- Kalender W. A., Schmidt B., Zankl M., and Schmidt M., “A PC program for estimating organ dose and effective dose values in computed tomography,” Eur. Radiol. 9, 555–562 (1999). [DOI] [PubMed] [Google Scholar]
- Morin R. L., Gerber T. C., and McCollough C. H., “Radiation dose in computed tomography of the heart,” Circulation 10.1161/01.CIR.0000048965.56529.C2 107, 917–922 (2003). [DOI] [PubMed] [Google Scholar]
- McCollough C. H., “Patient dose in cardiac computed tomography,” Herz 28, 1–6 (2003). [DOI] [PubMed] [Google Scholar]
- Nakonechny K. D., Fallone B. G., and Rathee S., “Novel methods of measuring single scan dose profiles and cumulative dose in CT,” Med. Phys. 10.1118/1.1835571 32, 98–109 (2005). [DOI] [PubMed] [Google Scholar]
- Boone J. M., Geraghty E. M., Seibert J. A., and Wootton-Gorges S. L., “Dose reduction in pediatric CT: A rational approach,” Radiology 10.1148/radiol.2282020471, 228, 352–360 (2003). [DOI] [PubMed] [Google Scholar]
- Boone J. M., Velazquez O., and Cherry S. R., “Small-animal x-ray dose from micro-CT,” Mol. Imaging 10.1162/1535350042380326 3, 149–158 (2004). [DOI] [PubMed] [Google Scholar]
- Boone J. M., Nelson T. R., Lindfors K. K., and Seibert J. A., “Dedicated breast CT: Radiation dose and image quality evaluation,” Radiology 10.1148/radiol.2213010334 221, 657–667 (2001). [DOI] [PubMed] [Google Scholar]
- Boone J. M., Shah N., and Nelson T. R., “A comprehensive analysis of DgN(CT) coefficients for pendant-geometry cone-beam breast computed tomography,” Med. Phys. 10.1118/1.1636571 31, 226–235 (2004). [DOI] [PubMed] [Google Scholar]
- Paulus M. J., Gleason S. S., Kennel S. J., Hunsicker P. R., and Johnson D. K., “High resolutions x-ray computed tomography: An emerging tool for small animal cancer research,” Neoplasia 10.1038/sj.neo.7900069 2, 62–70 (2000). [DOI] [PMC free article] [PubMed] [Google Scholar]
- Goertzen A. L., Nagarkar V., Street R. A., Paulus M. J., Boone J. M., and Cherry S. R., “A comparison of x-ray detectors for mouse CT imaging,” Phys. Med. Biol. 10.1088/0031-9155/49/23/004 49, 5251–5265 (2004). [DOI] [PubMed] [Google Scholar]
- Boone, J. M., “Breast CT: Its prospect for breast cancer screening and diagnosis,” in 2004 Syllabus: Advances in Breast Imaqing Physics, Technology, and Clinical Applications, edited by Karellas A. and Giger M. L. (Radiological Society of North America, Oak Park, IL, 165–177. [Google Scholar]
- Chen B. and Ning R., “Cone-beam volume CT breast imaging: Feasibility study,” Med. Phys. 10.1118/1.1461843 29, 755–770 (2002). [DOI] [PubMed] [Google Scholar]
- Glick S., Vedantham S., and Karellas A., “lnvestigation of optimal kVp settings for CT mammography using a flat panel detector,” Proc. SPIE 10.1117/12.465581 4682, 392–402 (2003). [DOI] [Google Scholar]
- Berthold L. D., Peter A., Ishaque N., Mauermann F., Bohringer G., and Klose K. J., “Measurement of torsion angles of long finger bones using computed tomography,” Skeletal Radiol. 30, 579–583 (2001). [DOI] [PubMed] [Google Scholar]
- Bille B., Harley B., and Cohen H., “A comparison of CT arthrography of the wrist to findings during wrist arthroscopy,” J. Hand Surg. [Am] 32, 834–841 (2007). [DOI] [PubMed] [Google Scholar]
- Marai G. E., Crisco J. J., and Laidlaw D. H., “A kinematics-based method for generating cartilage maps and deformations in the multi-articulating wrist joint from CT images,” IEEE Eng. Med. Biol. Soc. 1, 2079–2082 (2006). [DOI] [PMC free article] [PubMed] [Google Scholar]
- Boone J. M., V. N.Cooper, III, Nemzek W. R., McGahan J. P., and Seibert J. A., “Monte Carlo assessment of computed tomography dose to tissue adjacent to the scanned volume,” Med. Phys. 10.1118/1.1312809 27, 2393–2407 (2000). [DOI] [PubMed] [Google Scholar]
- Boone J. M. and V. N.Cooper, III, “Scatter∕primary in mammography: Monte Carlo validation,” Med. Phys. 10.1118/1.1287052 27, 1818–1831 (2000). [DOI] [PubMed] [Google Scholar]
- Boone J. M., Buonocore M. H., and V. N.Cooper, III, “Monte Carlo validation in diagnostic radiological imaging,” Med. Phys. 10.1118/1.599007 27, 1294–1304 (2000). [DOI] [PubMed] [Google Scholar]
- Boone J. M. and Chavez A. E., “Comparison of x-ray cross sections for diagnostic and therapeutic medical physics,” Med. Phys. 10.1118/1.597899 23, 1997–2005 (1996). [DOI] [PubMed] [Google Scholar]
- ImPACT.impactscan.org. (2007).
- Boone J. M. and Seibert J. A., “An accurate method for computer-generating tungsten anode x-ray spectra from 30 to 140 kV,” Med. Phys. 10.1118/1.597953 24, 1661–1670 (1997). [DOI] [PubMed] [Google Scholar]
- Nitt-Gray M. F., “AAPM∕RSNA physics tutorial for residents: Topics in CT. Radiation dose in CT,” Radiographics 22, 1541–1553 (2002). [DOI] [PubMed] [Google Scholar]


