Abstract
Introduction
Clinical factors in addition to PSA have been evaluated to improve risk assessment for prostate cancer. The Prostate Cancer Prevention Trial (PCPT) risk calculator provides an assessment of prostate cancer risk based on age, PSA, race, prior biopsy, and family history. This study evaluated the risk calculator in a screening cohort of young, racially diverse, high-risk men with a low baseline PSA enrolled in the Prostate Cancer Risk Assessment Program.
Patients and Methods
Eligibility for PRAP include men ages 35-69 who are African-American, have a family history of prostate cancer, or have a known BRCA1/2 mutation. PCPT risk scores were determined for PRAP participants, and were compared to observed prostate cancer rates.
Results
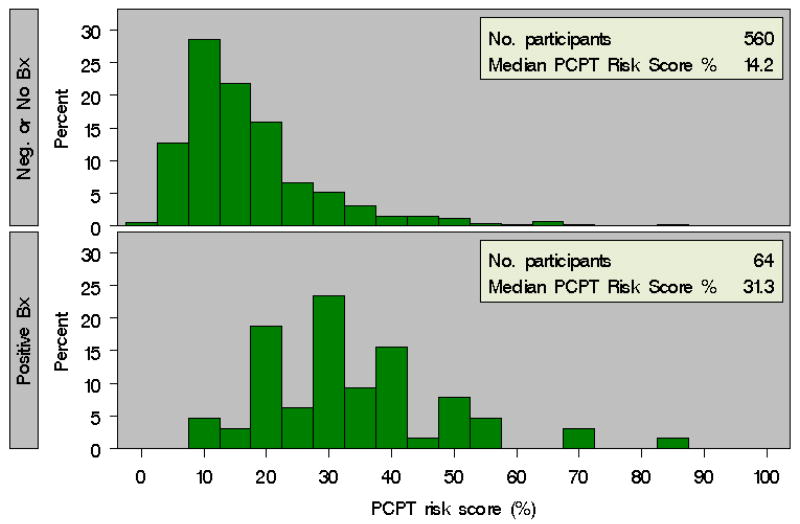
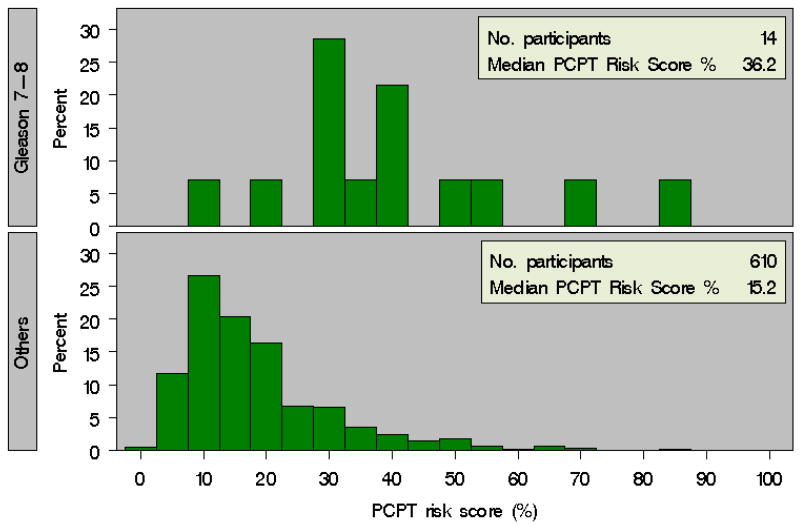
624 participants were evaluated, including 382 (61.2%) African-American men and 375 (60%) men with a family history of prostate cancer. Median age was 49.0 years (range 34.0-69.0), and median PSA was 0.9 (range 0.1-27.2). PCPT risk score correlated with prostate cancer diagnosis, as the median baseline risk score in patients diagnosed with prostate cancer was 31.3%, versus 14.2% in patients not diagnosed with prostate cancer (p<0.0001). The PCPT calculator similarly stratified the risk of diagnosis of Gleason score ≥7 disease, as the median risk score was 36.2% in patients diagnosed with Gleason ≥7 prostate cancer versus 15.2% in all other participants (p<0.0001).
Conclusion
PCPT risk calculator score was found to stratify prostate cancer risk in a cohort of young, primarily African-American men with a low baseline PSA. These results support further evaluation of this predictive tool for prostate cancer risk assessment in high-risk men.
Keywords: Prostate Cancer, prostate biopsy, prostate cancer prevention
Introduction
Prostate cancer is the most common non-cutaneous malignancy in men in the United States. The American Cancer Society estimates that 186,000 men were diagnosed with prostate cancer in 2008, and 28,600 patients died from this disease.1 Prostate cancer screening currently relies on digital rectal examination (DRE) and measurement of serum prostate specific antigen (PSA). While risk factors for prostate cancer have been identified, such as age, family history, and African American race, the most appropriate method for tailoring screening based on risk factors remains uncertain.2-4
The Prostate Cancer Prevention Trial (PCPT) was a randomized trial that accrued 18,882 men to receive either finasteride or placebo for seven years.2 In order to participate, patients had to be 55 years or older, have a normal DRE, and a baseline PSA ≤3.0 ng/ml. Patients were recommended to undergo prostate biopsy for either a PSA >4.0ng/ml or abnormal DRE during annual evaluation.2, 3 In addition, all patients were recommended to undergo prostate biopsy at the end of the study, regardless of PSA and DRE. The placebo cohort of 5,519 men have been subsequently analyzed to develop a risk calculator to predict prostate cancer diagnosis.4 In particular, the variables of PSA, family history of prostate cancer, DRE, a prior negative prostate biopsy, race, and age were included in the model.4
However, the population of men used to develop the PCPT risk calculator was fairly homogeneous with 93% of patients Caucasian, and only 17% having a family history of prostate cancer. Therefore, establishing the ability of this predictive model to assess prostate cancer risk in younger patients of diverse ethnicity remains important. Here, we evaluated the ability of the PCPT risk calculator to predict prostate cancer in a screening cohort of young, primarily African American men with a low baseline PSA.
Patients and Methods
PRAP high-risk cohort
The objectives and design of the PRAP program have been previously decribed.5 The Prostate Risk Assessment Program (PRAP) at Fox Chase Cancer Center was established in 1996 with the primary objective of developing a registry of patients and families who are at high risk for prostate cancer to facilitate screening and early detection. Eligibility criteria for entry into PRAP include men between the ages of 35-69 years with 1) one or more first-degree relatives diagnosed with prostate cancer, 2) 2 second-degree relatives on the same side of the family diagnosed with prostate cancer, 3) African American race, or 4) a known BRCA1/2 mutation. All PRAP participants provide informed consent upon enrollment. The PRAP study has been approved by our Institutional Review Board.
At initial evaluation, patients are screened with a DRE and total serum PSA. Free PSA is then measured in patients with total PSA values of 1.5-2.0 ng/ml. All PSA values are determined using the Hybritech® Access ® PSA assay. If no abnormalities are noted during initial screening, patients are scheduled for annual follow-up. Current PRAP criteria for prostate biopsy are 1) PSA greater than 2.0ng/ml, 2) PSA 1.5-2.0 ng/ml with a free PSA ≤25%, 3) abnormality on DRE, or 4) PSA velocity of 0.75 ng/ml per year. Men with negative prostate biopsies and those who refused to undergo a recommended biopsy are scheduled to return to clinic in 6 months for a repeat PSA, free PSA, and DRE.
The PCPT risk calculator4 was applied to determine the risk score for each participant of the PRAP cohort of being diagnosed with prostate cancer, as well as being diagnosed with Gleason ≥7 prostate cancer. This calculator is available on the internet (http://deb.uthscsa.edu/URORiskCalc/Pages/calcs.jsp).
Statistical Methods
Comparison of risk score distribution by race and by diagnosis of prostate cancer was performed using the Wilcoxon rank sum test. Baseline characteristics in African American (AA) versus Caucasian men were compared with t-tests for continuous variables or Fisher's exact test for categorical variables.
To further determine if baseline risk score was associated with prostate cancer diagnosis in men followed longitudinally for prostate cancer screening, we performed a separate analysis of men with at least one follow-up visit to assess risk score at baseline, and time to prostate cancer diagnosis. We used the Kaplan Meier product-limit method to estimate freedom from prostate cancer over time by risk score, and compared results using the log rank test. We used Cox proportional hazards analyses to estimate the hazard ratio for PCPT risk, first with PCPT risk score as a continuous variable, and then with PCPT risk score stratified as 0-20%, 21-30%, and >30% adjusting for race, since the eligibility criteria for PRAP differ by race. In a separate Cox model adjusting for race, we looked at individual variables that comprise the PCPT risk calculator to determine if these predictors were independently associated with time to prostate cancer diagnosis.
Results
As of November 2008, 749 patients were enrolled into PRAP. Of these, 624 were included in this analysis. Patients were excluded from the analysis for the following reasons: missing family history information (n=60), refusal of DRE (n=34), or both (n=13). Of 624 men, 242 (38.7%) were Caucasian and 382 (61.2%) were AA. Median age of both AA and white men at the time of enrollment was 49.0 years (range 35.0-69.0). Demographics of the cohort are shown in Table 1.
Table 1. Demographics of 624 Participants at Entry into PRAP.
| Overall Cohort n=624 |
Caucasian n=242 |
African American n=382 |
|
|---|---|---|---|
| Median Age in Years, (range) | 49.0 (34.0-69.0) | 49.0 (35.0-69.0) | 49.0 (34.0-69.0) |
| Baseline PSA (ng/ml), (range) | 0.9 (0.1-27.2) | 1.0 (0.1-22.5) | 0.9 (0.1-27.2) |
| Family History Prostate Cancer | 375 (60%) | 233 (96%) | 142 (37%) |
| Abnormal DRE | 25 (4%) | 11 (5%) | 14 (4%) |
| Prior Negative Biopsy | 43 (7%) | 17 (7%) | 26 (7%) |
Over the period of the study, 64 patients (10.3%) were diagnosed with prostate cancer, including 14 men (2.2%) who were diagnosed with Gleason ≥7 disease. PCPT risk score4 was calculated for each patient using clinical information reported at enrollment. The distribution of baseline PCPT risk scores both for men with a subsequent biopsy demonstrating prostate cancer as well as for men without a prostate cancer diagnosis are depicted in Figure 1. We found that the median baseline PCPT risk score was higher in those men who had biopsy-confirmed prostate cancer than in men not diagnosed with prostate cancer (31.3% vs. 14.2%, p<0.0001). Importantly, we also noted a significant difference in median PCPT risk score for men diagnosed with Gleason ≥7 prostate cancers versus in men without a diagnosis of Gleason ≥7 prostate cancer (36.2% vs. 15.2%, p<0.0001) (Figure 2).
Figure 1. Baseline PCPT Risk Calculator Score for Patients with and without a Diagnosis of Prostate Cancer in PRAP.
Figure 2. Baseline PCPT Risk Calculator Score for Patients with and without a Diagnosis of Gleason ≥7 Prostate Cancer in PRAP.
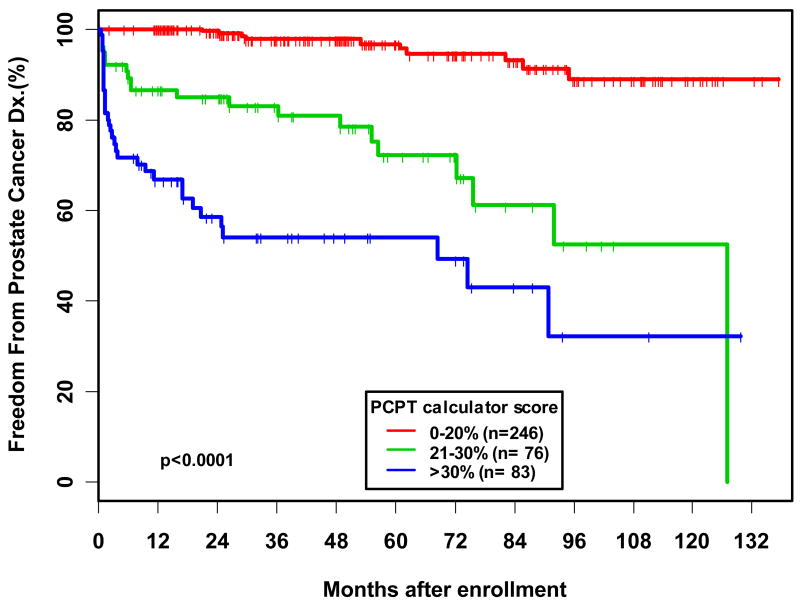
In an additional analysis, 405 men out of the 624 patients with at least one follow-up visit were evaluated for time to prostate cancer diagnosis by PCPT risk score. When PCPT risk score was analyzed as a categorical variable, we found that men with a score of 20-30% and >30% were 8.25 and 18.58 times, respectively, more likely to be diagnosed with prostate cancer compared to patients with a score of 0-20% (p<0.0001). Overall, we found that the hazard ratio for prostate cancer diagnosis associated with a 20% difference in PCPT risk score was 2.92, such that a patient with a PCPT risk score of 25% was almost three times as likely to be diagnosed with prostate cancer compared to a patient with a risk score of 5%. On Kaplan-Meier analysis the 5-year estimated freedom from prostate cancer diagnosis was 54.6% in men with a risk score of >30%, versus 96% in men with a risk score of 0-20% (p<0.0001) (Figure 3).
Figure 3. Kaplan-Meier analysis of time to Prostate Cancer Diagnosis stratified by PCPT calculator risk score for 405 men in PRAP with at least one follow-up visit.
In a multivariable analysis evaluating the association of the individual risk calculator components with time to prostate cancer diagnosis, we noted that the logPSA at baseline was the only significant predictor of prostate cancer diagnosis, such that patients with an increased PSA were at a nearly six-fold increased risk of subsequently being diagnosed with prostate cancer (Table 2). Interestingly, patients with a prior negative biopsy were noted to be significantly less likely to be diagnosed with prostate cancer (HR 0.14, 95% CI 0.052-0.367, p<0.0001).
Table 2. Multivariate Analysis of the Association of the Individual Components of the PCPT Risk Calculator with Prostate Cancer Diagnosis.
| Variable | Hazard Ratio | 95% CI | p-value |
|---|---|---|---|
| African American Race | 1.1 | (0.58-2.08) | 0.764 |
| Prior Negative Biopsy | 0.14 | (0.05-0.37) | <0.0001 |
| Positive DRE | 0.45 | (0.16-1.24) | 0.122 |
| Positive Family History | 1.16 | (0.60-2.25) | 0.668 |
| logPSA | 5.42 | (3.90-7.52) | <0.0001 |
Discussion
We demonstrated here that the PCPT risk calculator effectively stratified the risk of being diagnosed with prostate cancer diagnosis in a high-risk screening population, including a large number of young, primarily AA men with a low baseline PSA. Specifically, men with a 20% increased PCPT risk score had a nearly three-fold increased risk of being diagnosed with prostate cancer. Furthermore, men who had a significantly higher baseline PCPT risk score had a significantly increased risk of being diagnosed with Gleason ≥ 7 cancers as well.
In the initial description of the PCPT calculator by Thompson et al.4, PSA, family history, and abnormal DRE were significant predictors of prostate cancer on biopsy, while patients with a history of prior negative prostate biopsy were found to be at a reduced risk of diagnosis of prostate cancer.4 Significant predictors for Gleason ≥7 cancers in this study included PSA, abnormal DRE, age, and AA race. However, the cohort originally used to generate the PCPT risk calculator was composed primarily of older (mean age 62 at enrollment, 70 at biopsy) men, the majority of whom were educated and were white (95.6%).4 In addition, patients with a baseline PSA>3.0ng/ml were excluded from the study.4 This study supports further evaluation of the PCPT risk calculator in an ethnically-diverse group of patients at high-risk for prostate cancer.
Although a previous validation of the PCPT risk calculator has been performed, 6 the population from that follow-up study was composed of 13% African American, 37% Hispanic, and 49% non-Hispanic white patients. The present evaluation of the Fox Chase Cancer Center PRAP population therefore represents an evaluation of the PCPT risk calculator in a unique group of patients. In PRAP, the majority (61.2%) of men are African American, while Caucasians have either a family history of prostate cancer or BRCA 1/2 mutation. Therefore, the present study demonstrates the ability of the PCPT calculator to stratify prostate cancer risk in this cohort, further expanding the applicability of this predictive model.
The interpretation of serum PSA for prostate cancer risk has continued to evolve. While a threshold PSA of 4.0ng/ml was initially used to determine which patients should undergo prostate biopsy, additional studies have recommended biopsy at PSA levels of 2.5 or even 1.5 ng/ml.11,14,15 Prostate cancer risk has been found to exist as a continuum with increasing PSA.4 As such, PSA has been increasingly viewed as a variable which should be interpreted in the context of a patient's other risk factors for prostate cancer. Variables such as advancing age, family history, DRE, previous prostate biopsy, and race can individually provide information to predict the likelihood of developing prostate cancer. The use of predictive tools such as the PCPT risk calculator, which incorporate the impact of these various factors together to determine a patient's risk for prostate cancer diagnosis, can therefore provide valuable information for patient counseling and risk-stratification. After further characterization, such a risk stratification tool may be used to target those high-risk patients who may benefit most from preventative measures or clinical trials. As additional means for predicting prostate cancer such as genetic markers, biomarkers, and imaging studies are developed and refined, they can be incorporated into such existing predictive tools as well.11-13
There are some limitations to this study. The average follow-up in PRAP is approximately 60%, which may hinder the interpretation of our findings since not all prostate cancers may have been detected. In addition, not all participants underwent prostate biopsy, which may have underestimated the true incidence of prostate cancer. Although our sample size was relatively small, we still found that the PCPT risk calculator was able to stratify high-risk men who developed any prostate cancer as well as high-grade disease. Further study in high-risk men is needed in order to improve the accuracy of risk prediction and assessment of prostate cancer.
Conclusions
The PCPT risk calculator has utility in predicting the diagnosis of prostate cancer in a high-risk screening cohort with a majority of AA participants. Such risk prediction tools, in addition to the incorporation of new biomarkers, require further study in high-risk men to more precisely predict risk for prostate cancer, and to make progress toward personalized risk assessment for this disease.
Acknowledgments
Supporting grants: NIH CCSG (CA06927)
References
- 1.Jemal A, Siegel R, Ward E, et al. Cancer statistics, 2008. CA Cancer J Clin. 2008;58:71. doi: 10.3322/CA.2007.0010. [DOI] [PubMed] [Google Scholar]
- 2.Thompson IM, Goodman PJ, Tangen CM, et al. The influence of finasteride on the development of prostate cancer. N Engl J Med. 2003;349:215. doi: 10.1056/NEJMoa030660. [DOI] [PubMed] [Google Scholar]
- 3.Thompson IM, Ankerst DP, Chi C, et al. Prediction of prostate cancer for patients receiving finasteride: results from the Prostrate Cancer Prevention Trial. J Clin Oncol. 2007;25:3076. doi: 10.1200/JCO.2006.07.6836. [DOI] [PubMed] [Google Scholar]
- 4.Thompson IM, Ankerst DP, Chi C, et al. Assessing prostate cancer risk: results from the Prostate Cancer Prevention Trial. J Natl Cancer Inst. 2006;98:529. doi: 10.1093/jnci/djj131. [DOI] [PubMed] [Google Scholar]
- 5.Giri VN, Beebe-Dimmer J, Buyyounouski M, et al. Prostate Cancer Risk Assessment Program: a 10-year update of cancer detection. J Urol. 2007;178:192. doi: 10.1016/j.juro.2007.07.010. [DOI] [PubMed] [Google Scholar]
- 6.Parekh DJ, Ankerst DP, Higgins BA, et al. External validation of the Prostate Cancer Prevention Trial risk calculator in a screened population. Urology. 2006;68:1152. doi: 10.1016/j.urology.2006.10.022. [DOI] [PubMed] [Google Scholar]
- 7.Lam JS, Sheung YK, Benson MC, Goluboff ET. Comparison of the predictive accuracy of serum prostate specific antigen levels and prostate specific antigen density in the detection of prostate cancer in Hispanic-American and White men. J Urol. 2003;170:451. doi: 10.1097/01.ju.0000074707.49775.46. [DOI] [PubMed] [Google Scholar]
- 8.Moul JW, Sesterhenn IA, Connelly RR, et al. Prostate-specific antigen values at the time of prostate cancer diagnosis in African-American men. JAMA. 1995;274:1277. [PubMed] [Google Scholar]
- 9.Elliott CS, Shinghal R, Presti JC. Racial variations in the performance of prostate specific antigen and prostate specific antigen density in the era of extended prostate biopsy schemes. J Urol. 2008;180:1318. doi: 10.1016/j.juro.2008.06.031. [DOI] [PubMed] [Google Scholar]
- 10.Reed A, Ankerst DP, Pollock BH, Thompson IM, Parekh DJ. Current age and race adjusted prostate specific antigen threshold values delayed diagnosis of high grade prostate cancer. J Urol. 2007;178:1929. doi: 10.1016/j.juro.2007.07.045. [DOI] [PubMed] [Google Scholar]
- 11.Eastham JA, May R, Robertson JL, Sartor O, Kattan MW. Development of a nomogram that predicts the probability of a positive prostate biopsy in men with an abnormal digital rectal examination and a prostate-specific antigen between 0 and 4 ng/mL. Urology. 1999;54:709. doi: 10.1016/s0090-4295(99)00213-7. [DOI] [PubMed] [Google Scholar]
- 12.Ankerst DP, Groskopf J, Day JR, et al. Predicting prostate cancer risk through incorporation of prostate cancer gene 3. J Urol. 2008;180:1303. doi: 10.1016/j.juro.2008.06.038. [DOI] [PubMed] [Google Scholar]
- 13.Yanke BV, Carver BS, Bianco FJ, et al. African-American race is a predictor of prostate cancer detection: incorporation into a pre-biopsy nomogram. BJU Int. 2006;98:783. doi: 10.1111/j.1464-410X.2006.06388.x. [DOI] [PubMed] [Google Scholar]
- 14.Presti JC, Hovey R, Bhargava V, Carroll PR, Shinohara K. Prospective evaluation of prostate specific antigen and prostate specific antigen density in the detection of carcinoma of the prostate: ethnic variations. J Urol. 1997;157:907. [PubMed] [Google Scholar]
- 15.Schroder FH, Roobol MJ, Andriole GL, Fleshner N. Defining increased future risk for prostate cancer: evidence from a population based screening cohort. J Urol. 2009;181:69. doi: 10.1016/j.juro.2008.09.012. [DOI] [PubMed] [Google Scholar]


