

Abstract
Inactivation of U19/EAF2 has been shown previously to lead to tumorigenesis in multiple organs; however the mechanism of U19/EAF2 tumor suppression remains unclear. In this paper we report that the expression of an anti-angiogenic protein, thrombospondin-1 (TSP-1) is down-regulated in the prostate and liver of U19/EAF2 knockout mouse. The U19/EAF2 knockout liver displayed increased CD31-positive blood vessels, suggesting that the TSP-1 down-regulation can contribute to increased angiogenesis. TSP-1 is reported to be a p53-target gene and p53 is a known binding partner of ELL, which binds to U19/EAF2. Here we show that U19/EAF2 can co-localize and co-immunoprecipitate with p53 in transfected cells. In a TSP-1 promoter-driven luciferase reporter assay, p53 transfection suppressed the TSP-1 promoter activity and U19/EAF2 co-transfection blocked the p53 suppression of TSP-1 promoter. However, U19/EAF2 transfection alone had little or no effect on the TSP-1 promoter. The above observations together suggest that U19/EAF2 regulates the expression of TSP-1 via blocking p53 repression of the TSP-1 promoter.
Keywords: U19/EAF2, prostate cancer, tumor suppressor, TSP-1, p53
Introduction
ELL-associated factor 2 (U19/EAF2) is a potential tumor suppressor initially identified based on its androgen-responsiveness in the prostate (Wang et al., 1997) and independently found to be a binding partner of ELL (Simone et al., 2003). Advanced human prostate cancer specimens displayed U19/EAF2 down-regulation, allelic loss, promoter hypermethylation, and possibly homozygous deletion (Xiao et al., 2003). Transfection of U19/EAF2 in prostate cancer cell lines induced apoptosis and inhibited the growth of xenograft prostate tumor models (Xiao et al., 2003). U19/EAF2 knockout mice developed lung adenocarcinoma, hepatocellular carcinoma, B-cell lymphoma, and high-grade prostatic intraepithelial neoplasia (PIN), confirming its tumor suppressive activity under physiological conditions (Xiao et al., 2008). However, the mechanism by which U19/EAF2 suppresses tumorigenesis remains unclear.
One potential mechanism of U19/EAF2 action may involve its downstream genes. U19/EAF2, along with its homologue EAF1, has been reported to positively regulate transcription elongation of RNA polymerase II via interaction with the ELL family proteins (Mitani et al., 2000; Wiederschain et al., 2003). Also, U19/EAF2 contains a transactivation domain in its C-terminal region (Xiao et al., 2008). Despite this implicated importance of U19/EAF2 in gene regulation, U19/EAF2 target genes have not been reported. Identification and characterization of genes regulated by U19/EAF2 will facilitate mechanistic analysis of U19/EAF2 action.
The p53 tumor suppressor functions as a transcription factor and regulates the expression of genes involved in cell cycle, apoptosis, and genomic stability. Cells are very sensitive to small changes in the level or activity of p53. Multiple mechanisms exist to control p53, including post-translational modifications and the availability of binding partners that can regulate the stability and sub-cellular localization and activity of p53. ELL was identified as a p53 binding partner (Shinobu et al., 1999), and this binding involves the transcription elongation activation domain of ELL and the C-terminal region of p53. ELL and p53 can modulate the functions of each other, with ELL inhibiting both sequence specific transactivation and sequence-independent transrepression by p53 and p53 inhibiting the transcription elongation activity of ELL. Another p53 binding partner is von Hippel-Lindau protein (pVHL) (Roe et al., 2006). pVHL has been reported to directly associate and positively regulate p53 by inhibiting MDM2-mediated ubiquitination. We have recently reported that U19/EAF2 binds to and stabilizes pVHL (Zhou et al., 2009). Since U19/EAF2 can bind to ELL and pVHL, this raises a possibility for U19/EAF2 to interact with p53, presumably via ELL and/or pVHL. Demonstrating functional interactions between p53 and U19/EAF2 would link the newly discovered tumor suppressor U19/EAF2 to the well-established p53 pathway, providing new insights into the mechanisms of p53 and U19/EAF2 action.
Thrombospondin-1 (TSP-1) is a potent antiangiogenic regulator that is up-regulated by p53 and plays a potential role in tumorigenesis. The regulation of TSP-1 by p53 appears to vary in different cell and tissue types. For example, TSP-1 expression is correlated with p53 status in prostate cancer (Kwak et al., 2002), epithelial ovarian carcinoma (Alvarez et al., 2001) and glioma (Harada et al., 2003), but inversely correlated in colon cancer (Tokunaga et al., 1998). These observations suggest that p53 regulation of TSP-1 expression is cellular context-dependent and that the expression of different p53-binding partners may modulate p53 regulation of TSP-1 expression.
Here, we report that U19/Eaf2 knockout caused TSP-1 down-regulation in a mouse model. In cultured cell lines, U19/EAF2 co-immunoprecipitated with p53 and modulated p53 repression of TSP-1 promoter activity. These results suggest that U19/EAF2 may play a role in tumor angiogenesis by blocking p53 repression of the TSP-1 promoter.
Materials and methods
Cell culture and transient transfection
HEK293, PC-3 and LNCaP were obtained from ATCC (Manassas, VA). H1299 was a generous gift from Dr. Shivendra Singh. Cells were cultured at in either DMEM or RPMI-1640, 10% FBS (GIBCO, Grand Island, NY.). Transient transfection was performed using Lipofectamine™ 2000 transfection reagents (Invitrogen, Carlsbad, CA) according to manufacturer’s protocol.
Construction of plasmids
Plasmids used were pCMV-HA, pCMV-Myc, pDsRed-Express-C1, pEGFP-C1 (Clontech, Mountain View, CA), pGEX-2T (Chalfont St. Giles, United Kingdom), and pGL2/pGL3 (Promega, Madison, WI). Full-length cDNA of human U19/EAF2, p53, and ELL were subcloned into pCMV-Myc, pCMV-HA, pDsRed-Express-C1, or pEGFP-C1 vector (Clontech) to generate pCMV-Myc-EAF2, pCMV-HA-EAF2, pGFP-EAF2, pCMV-Myc-p53, pCMV-HA-p53, pRFP-p53, pGFP-p53, pCMV-Myc-ELL. Full-length cDNAs were verified by sequencing.
Fluorescence microscopy
293 cells were transfected with different combinations of mammalian expression vectors harboring RFP-p53, GFP-EAF1/2, or empty vectors and grown on coverslides. After 24 hr of transfection, cells were fixed with 4% (w/v) paraformaldehyde at room temperature or −20°C methanol or acetone and blocked with 2% (w/v) bovine serum albumin in phosphate-buffered saline. The cells were then stained with Hoechst 33342 (Invitrogen) for 10 min. Images were acquired using a Nikon T-2000 Eclipse inverted microscope (Nikon Instruments, Melville, NY) using GFP, RFP and Hoechst filter. Co-localization of U19/EAF2 and p53 speckles was detected using paraformaldehyde, methanol, and acetone fixing.
Animals
We previously generated U19/EAF2 heterozygous mice (U19/EAF2+/−) (Nelius et al., 2007) using HM1 embryonic stem cells (Selfridge et al., 1992). Briefly, heterozygous mice were thereafter backcrossed to the C57BL/6J strain (The Jackson Laboratory, Bar Harbor, ME) for more than 12 generations to generate U19/EAF2 knockout (ko) mice with a pure C57BL/6J background under approval by the Institutional Animal Care and Use Committee of the University of Pittsburgh. Genotyping was determined by PCR analysis of mouse tail genomic DNA as described previously (Xiao et al., 2008).
Quantitative real-time RT-PCR analysis
Total RNA was extracted from individual frozen whole tissue samples of the ventral prostates and livers of wild-type or U19/EAF2 ko male mice (n= 3) at 3 months of age with Trizol® Reagent (Invitrogen, USA). Animal tissues were homogenized with a Kontes pellet pestle for 30 sec twice (Fisher Scientific, Fair View, NJ). qPCR verified expression scored by cDNA arrays of ventral prostate tissue and expression levels in liver tissue (Platinum SYBR®Green qPCR SuperMix-UDG, Invitrogen, USA). DNA amplification was carried out using Applied Biosystems StepOne™Plus™ Real-Time PCR Systems (Applied Biosystems CA, USA). The following primers were used: TSP-1 forward 5′-GGGGAGATAACGGTGTGTTTG and TSP-1 reverse 5′-CGGGGATCAGGTTGGCATT, VEGFa forward 5′-GCACATAGAGAGAATGAGCTTCC and VEGFa reverse 5′-CTCCGCTCTGAACAAGGCT, CD31 forward 5′-ACGCTGGTGCTCTATGCAAG and CD31 reverse 5′-TCAGTTGCTGCCCATTCATCA, GAPDH forward 5′-AGGTCGGTGTGAACGGATTTG and GAPDH reverse 5′-GTAGACCATGTAGTTGAGGTCA. Each experimental sample was assayed in technical triplicate.
Immunoprecipitation and Western blot of cell lines
Cells were lysed in RIPA lysis buffer (50 mM Tris-HCl, pH 8.0, 150 mM NaCl, 1 mM EDTA, 1% (v/v) NP-40, 0.1% SDS, 0.25% sodium deoxycholate, 1mM sodium orthovanadate, 1 mM PMSF, 1:100 dilution of protease inhibitor cocktail (P8340, Sigma-Aldrich, St. Louis, MO). Protein concentration was determined by BCA Protein Assay (Thermo Scientific, Rockford, IL). For immunoprecipitation, 200 mg cell lysate was incubated with rabbit anti-c-Myc agarose conjugate (1:500, A7470, Sigma-Aldrich) or mouse monoclonal HA-probe (F-7) agarose conjugate (1:500, sc-7392AC, Santa Cruz Biotechnology) overnight. Immunoprecipitates (IP) and whole cell lysate (WCL) (45 mg/lane) were boiled with SDS sample buffer, separated on a NEXT GEL™ 10% (Amresco) under reducing conditions and transferred onto a nitrocellulose membrane. Blotted proteins were probed with antibodies as follows: purified mouse HA.11 monoclonal antibody (1:500, MMS-101P, Covance), mouse anti-c-myc monoclonal antibody, (1:500, Roche Applied Science, 11667149001), and followed with HRP (Horseradish peroxidase) labeled secondary antibodies (Santa Cruz Biotechnology). Signals were visualized using chemiluminescence (ECL™ Western Blotting Detection Reagents®, GE Healthcare) and were exposed to X-ray film (Fuji film).
Tissue dissection and immunohistochemical analyses
Tissue specimens from 3 month-old male mice were frozen in OCT (Tissue Tek, Sakura Finetechnical USA, Torrance, CA) immediately after sacrifice and dissection and stored at −80°C. Serial 5 μm sections were fixed in cold acetone and processed for immunohistochemistry. Sections were incubated with goat polyclonal anti-TSP-1 (1:500, sc12312, Santa Cruz Biotechnology) or rat monoclonal anti-CD31 (1:500, 550274, BD Pharmingen) at 4°C overnight. Antigen was localized using HRP-conjugated anti-goat IgG or anti-rat IgG (Santa Cruz Biotechnology) as the secondary antibody and diaminobenzidine tetrahydrochloride as the chromagen. Negative control experiments were done using goat or rat IgG as primary antibody. The sections were lightly counterstained with hematoxylin.
Extent of immunostaining was determined according to the presence or absence of specific staining when compared to a negative control. CD31-positive vessel density was determined by analysis of sections from five independent mice livers (1 cm2 for each genotype). The angiogenic index of the lesion was determined based on microvessel count (MVC) as described (Maeda et al., 1995). Ten fields showing highest visualization with no overlap were identified subjectively by evaluating histological sections at low power fields (HPF;10 × objectives, area 0.071 mm2 per field), and vessels were counted at 10X magnification to determine the average vessel numbers perfield for each section.
Dual luciferase assay
Cells were seeded at 1.2 × 10⁴/well two days before transfection in 96-well plates. Cells were exposed to transfection mixtures containing 60 ng of pGL Firefly luciferase reporter plasmids and 10 ng of vector phRL-TK as internal control (Renilla luciferase, RL, Promega, USA) of different transfection efficiencies of luciferase constructs. For overexpression assay, 60 ng/50 ng/60 ng of potential regulator expression constructs pCMV-Myc-EAF2, pCMV-Myc-p53 were co-transfected with reporter plasmids for 48 hr. Luciferase activity was measured using Dual-Luciferase® Reporter Assay (Promega, USA) and luminescence was assessed with LMax II/LMax II 384 Luminometer (Molecular Devices). Background was subtracted and fold induction calculated. As an effector control, the same amount of blank vector without U19/EAF2 cDNA or p53 cDNA insert was used. Experiments were repeated in triplicate and represent the average relative luciferase activity. Luciferase activities were normalized to the auto-luciferase activities of PC-3 cells without a transient transfection.
For TSP-1 promoter activity regulation studies, we used -2033/0 promoter fragment (Donoviel et al., 1988; Framson & Bornstein, 1993) driving a FL reporter. For dual luciferase assays, 60% confluent PC-3 cells, LNCaP cells, H1299 cells, and 293 cells were transfected with indicated plasmids using LIPOFECTAMIN® 2000 Reagent (Invitrogen), according to the manufacturer’s protocol. After 48 hr the cells were harvested and Luciferase activities were measured.
Colony formation assay
Two μg of empty vector, pEGFP-C1, or expression vector(s), pGFP-EAF2 or (and) pGFP-p53, were transfected into LNCaP cells as described above. On day 2, cells were plated onto 10 cm tissue culture dishes with 500 μg/ml G418 (Invitrogen) containing medium and incubated for 3 weeks to allow colonies to develop. Media was replaced every 10 days. Cell morphology was determined after stable selection using a fluorescence microscope. Colonies were stained with crystal violet (0.5% in methanol, Sigma) for 10 min, and washed with de-ionized water to remove excess stain (Azam et al., 2001). Stained colonies of diameter ≥1 mm were counted. Each colony formation assay was carried out in triplicate and repeated at least three times.
Statistical analysis
All values represent the mean ± SEM. Statistical significance between paired data was assessed with Student’s t test. Any P value of <0.05 is considered statistically significant.
Results
U19/EAF2 knockout caused a reduction in TSP-1 expression in the mouse prostate
Quantitative real-time RT-PCR (qPCR) verified TSP-1 down-regulation in U19/EAF2 knockout prostate at 3 mos (Figure 1a) initially identified by cDNA microarray (data not shown). TSP-1 mRNA levels in U19/EAF2 knockout prostate were significantly less than in wild-type (p < 0.005). U19/EAF2 knockout did not appear to influence the expression of another important angiogenesis regulator, VEGF, in the prostate. No changes in VEGF expression were detected by cDNA microarray analysis or qPCR. Immunostaining showed reduced TSP-1 protein expression in all lobes of the U19/EAF2 knockout mouse prostate compared to the staining in wild-type control. TSP-1 staining in the wild-type prostate was mainly present in the epithelial compartment, where U19/EAF2 expression is localized (Figure 1b).
Figure 1.
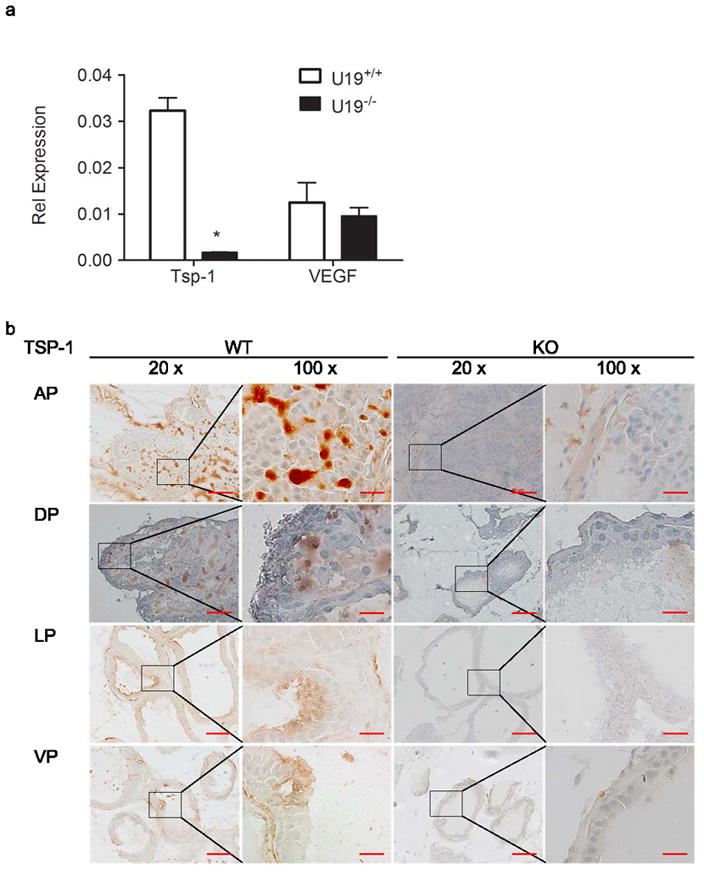
U19 increases angioinhibitory SP-1 in the mouse prostate. (a) qPCR analysis of U19 knockout verified decreased expression of TSP-1 discovered by cDNA microarray, but not VEGF in murine ventral prostate. Data are normalized to GAPDH, (* p < 0.005). (b) U19 knockout (KO) decreased TSP-1 protein expression in all lobes of the prostate, anterior (AP), dorsal (DP), lateral (LP) and ventral (VP) in comparison to wild-type (WT). Original magnification 20X, inset magnified to the right 100X. Scale bar indicates 100 μm in 20X and 20 μm in 100X.
Since TSP-1 is known to inhibit angiogenesis, we examined the expression of CD31/PECAM-1 (platelet endothelial cell adhesion molecule 1) in the ventral prostate as well. No statistically significant difference was found between the number of CD31-positive vessels detected in U19/EAF2 knockout compared to wild-type mice. This is likely due to the limited number of mice in this study combined with the low number of CD31-positive vessels detected. However, microarray data also did not show a significant difference in CD31 expression levels in the ventral prostate (data not shown).
U19/EAF2 knockout mice displayed down-regulation of TSP-1 and elevated CD31 level in the liver
We next examined if U19/EAF2 knockout caused down-regulation of TSP-1 in other organs, particularly the liver which expresses TSP-1 and develops tumors in U19/EAF2 knockout mice. Immunostaining showed TSP-1 down-regulation in U19/EAF2 knockout liver (Figure 2a), whereas wild-type liver displayed significant immunoreactivity of TSP-1 in surrounding blood vessels especially in the portal triad space. TSP-1 gene expression was also significantly down-regulated in U19/EAF2 knockout liver (Figure 2b). Taken together, these results showed that U19/EAF2 knockout caused down-regulation of TSP-1 at both mRNA and protein levels in the liver. As a control, qPCR analysis showed no change in VEGF expression in the liver, similar to what was observed in the prostate (Figure 2b).
Figure 2.
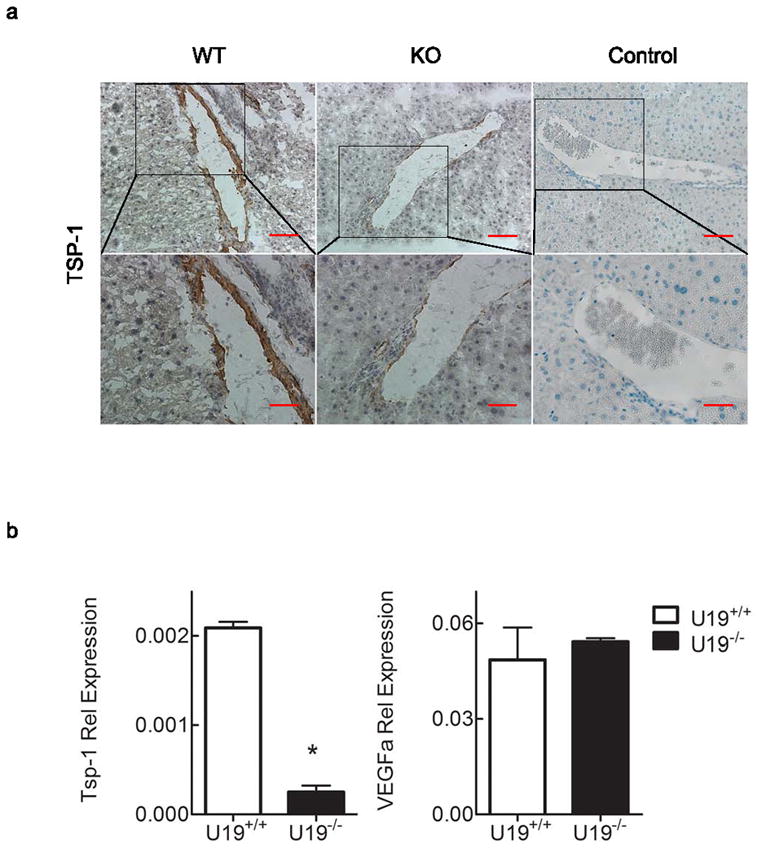
U19/EAF2 knockout increases angioinhibitory TSP-1 in the mouse liver. (a) TSP-1 immunostaining in transverse sections of liver from wild-type (WT) and knockout (KO) mice. TSP-1 expression is down-regulated in U19 null mice liver. Control of goat or rat IgG as primary antibody. Scale bar indicates 200 μm in 10X and 50 μm in 40X. (b) qPCR analysis verified decreased expression of TSP-1 but not VEGFa in murine liver. Data are normalized to GAPDH, (* p < 0.005).
U19/EAF2 knockout also caused a ~3-fold increase in the number of CD31-positive blood vessels in the liver, indicating increased vasculature. The density of CD-31 positive large vessels (red arrow) and hepatic sinusoidal endothelial cells was increased in the U19/EAF2 knockout liver in comparison to the wild-type control (Figure 3a). The mean number of large blood vessels per low-power field (Freitas et al., 2005; Maeda et al., 1995) in liver specimens stained with anti-CD31 for U19/EAF2 knockout and wild-type was 13 and 4, respectively. The Student’s t-test showed significant difference in the mean of CD31-positive large vessels between the two groups (Figure 3b). These findings indicate an important role for U19/EAF2 in liver blood vessel formation.
Figure 3.
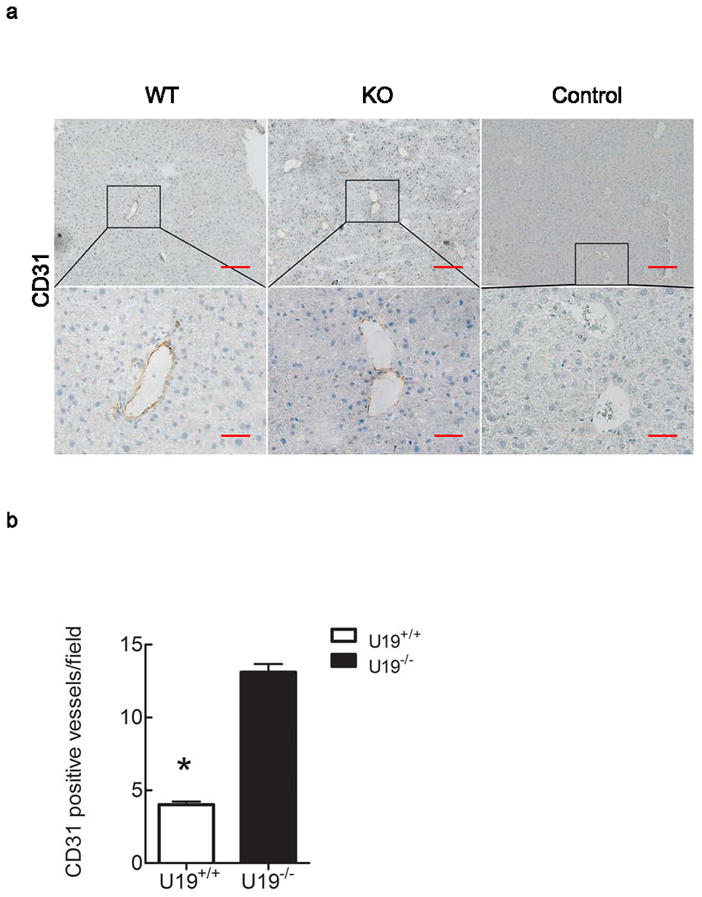
U19/EAF2 knockout increases CD31-positive blood vessels in the murine liver. (a) CD31 immunostaining in transverse sections of liver from wild-type and knockout animals. CD31 expression showed diffuse and continuous positivity of the sinusoids all along the portal triad to the centrolobular vein. Original magnifications 10X, inset magnified below 40X. Control of goat or rat IgG as primary antibody. Scale bar indicates 200 μm in 10X and 50 μm in 40X. (b) Quantification of CD31-positive blood vessels. Data represent average of 4 mice per group, (* p < 0.0001).
EAF2 co-immunoprecipitates and co-localizes with p53 in cultured cells
U19/EAF2 physically and functionally interacts with ELL (Shinobu et al., 1999; Simone et al., 2003) and pVHL (Zhou et al., 2009); and, ELL and pVHL can interact with p53 (Roe et al., 2006; Shinobu et al., 1999), suggesting a potential functional link between U19/EAF2 and p53, presumably via their mutual binding partners. To explore this possibility, we tested if HA-EAF2 and Myc-p53 could co-immunoprecipitate in transiently transfected 293 cells. Figure 4a showed that Myc-p53 was co-precipitated in the presence of HA-EAF2 expression vector, but not in vector transfected control. Similarly, HA-EAF2 co-precipitated with Myc-tagged p53 (Myc-p53), pointing to a specific association between U19/EAF2 and p53 in mammalian cells.
Figure 4.
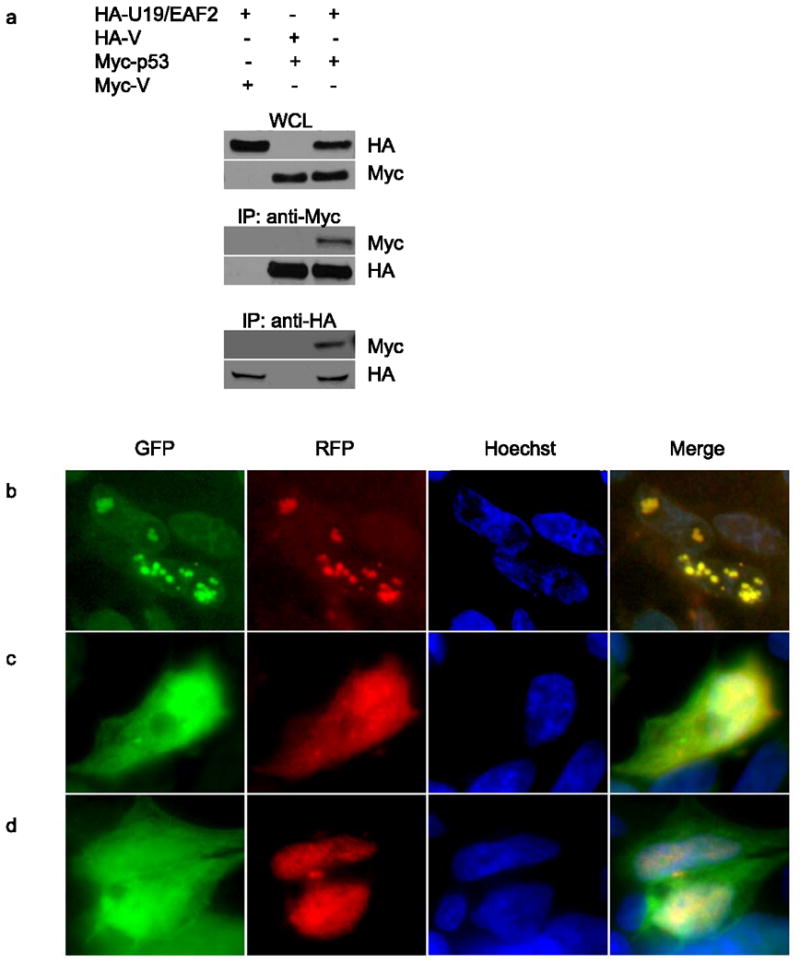
U19/EAF2 co-immunoprecipitates and co-localizes with p53 in culture. (a) Cells transfected with HA-U19/EAF2 and/or Myc-p53. Myc-p53 co-precipitates with HA-tagged U19/EAF2, similarly, HA-U19/EAF2 co-precipitates with Myc-tagged p53. Whole cell lysate (WCL) control. (b) Cells transfected with GFP-EAF2 and RFP-p53 show co-localization (yellow) of U19/EAF2 (green) and p53 (red) in the nuclear speckles of transfected human 293 cells with Hoechst nuclear staining. (c) Cells transfected with GFP-EAF2 and RFP-empty vector show localization of U19/EAF2 (green) in the nucleus. (d) Cells transfected with GFP-empty vector and RFP-953 show localization of p53 in the nucleus.
The interaction between U19/EAF2 and p53 was further supported by co-localization of U19/EAF2 and p53. We used fluorescent microscopy to monitor subcellular localization of GFP-EAF2 and RFP-p53 in transiently transfected 293 cells (Figure 4b). Consistent with previous observations (Simone et al., 2003; Xiao et al., 2006), GFP-U19/EAF2 localized in both nucleus and cytoplasm and RFP-p53 in the nucleoplasm. Interestingly, co-transfection of GFP-EAF2 and RFP-p53 showed co-localization of the GFP-U19/EAF2 and RFP-p53 proteins into well circumscribed nuclear granules. Co-staining with Hoechst 33342, further revealed that these nuclear granules were preferentially present in low DNA density areas corresponding to the euchromatin DNA, suggesting U19/EAF2 and p53 were likely involved in active transcription in the nucleus. We also co-transfected RFP and GFP-U19/EAF2 or GFP and RFP-p53 expression vectors into 293 cells as controls (Figure 4c and 4d). Subcellular localization of GFP-U19/EAF2 and RFP-p53 was unaffected by the expression of RFP and GFP, respectively, indicating that GFP or RFP tag was not involved in nuclear speckle formation. Similar nuclear U19/EAF2 and p53 colocalization speckles were observed in PC-3 cells (data not shown).
EAF2 alleviates p53 suppression of TSP-1 promoter in cultured cells
Our studies indicated U19/EAF2 is required for normal TSP-1 expression in the mouse model. In order to further explore the mechanism of U19/EAF2 regulation of TSP-1 expression, we determined the effect of U19/EAF2 on TSP-1 transcription in culture using a previously characterized TSP-1 promoter (-2033/0 bp) (Donoviel et al., 1988; Framson & Bornstein, 1993). The p53-negative PC-3 cell line was used as a model to determine if U19/Eaf2 overexpression could affect TSP-1 promoter activity. As shown in Figure 5a co-transfection of U19/Eaf2 had no dramatic effect on TSP-1 promoter-driven luciferase activity. The TSP-1 promoter activity was slightly increased when PC-3 cells were co-transfected with Myc-U19 expression vector at 60 ng/well. However, TSP-1 promoter activity was decreased when co-transfected with Myc-U19 at 80 ng/well. One possible reason for decreased TSP-1 promoter activity may be increased cytotoxicity associated with excessive amount of Myc-U19 expression. Co-transfection of Myc-p53 expression vector with TSP-1 promoter-driven luciferase reporter plasmid significantly repressed TSP-1 promoter activity in a dose-dependent manner in PC-3 cells (Figure 5a). An approximate 50% inhibition in luciferase activity was observed at 5 ng/well of p53 expression vector, and the inhibition was further increased with increasing amount of p53 expression vector (p < 0.0001), Interestingly, co-transfection of U19/Eaf2 and p53 expression vectors alleviated p53 repression of TSP-1 promoter activity, with 60 ng/well U19/Eaf2 expression vector exhibiting the most significant increase in luciferase activity.
Figure 5.

U19/EAF2 alleviates p53 suppression of TSP-1 promoter in vitro. (a) PC-3 cells transfected with U19/EAF2 alone show no repression of TSP-1, whereas p53 significantly reduces TSP-1 promoter activity. Co-transfection of U19/EAF2 with p53 shows alleviation of p53 repression of TSP-1 promoter activity. (b) U19/EAF2 co-transfection with p53 alleviates p53 repression of TSP-1 in PC-3, LNCaP, H1299 and 293 cell lines. Of note, co-transfection increases the TSP-1 promoter activity above empty vector control levels in LNCaP and H1299 cells.
To further investigate functional interactions between U19/Eaf2 and p53 in regulating TSP-1 promoter activity, we next determined the effect of U19/EAF2 overexpression on TSP-1 promoter activity in the presence and absence of exogenous p53 (Figure 5b). Transfection experiments were performed using p53-positive LNCaP, p53-negative H1299 and p53-positive HEK293 cell lines. Transfection of exogenous U19/EAF2 alone had no significant effect on TSP-1 promoter activity in any of the assayed cell lines, whereas p53 transfection repressed TSP-1 promoter activity. Co-transfection of U19/EAF2 and p53 showed that U19/EAF2 overexpression alleviated p53 repression of TSP-1 promoter in all assayed cell lines. Interestingly, in LNCaP and H1299 cells, co-transfection of U19/EAF2 with p53 not only alleviated p53 repression but also increased TSP-1 promoter activity. This suggests that U19/EAF2 could do more than simply alleviating p53 repression, because U19/EAF2 and p53 together could increase TSP-1 promoter activity. Furthermore, the 2,033-kilobase promoter region may contain important regulatory elements for U19/EAF2 and p53 to regulate TSP-1 expression.
EAF2 overexpression increases the growth-inhibitory effect of p53 in LNCaP cells
Colony formation assays were performed to determine if co-transfection of U19/EAF2 and p53 would lead to enhanced growth suppression. LNCaP cells were co-transfected with U19/EAF2 and p53. p53 transfection caused inhibition of colony formation, in agreement with the ability of p53 to induce apoptosis in LNCaP cells (Jiang et al., 2004) and many other cells types (Duan et al., 2008). U19/EAF2 transfection slightly inhibited colony formation, consistent with our previous data and its inability to induce cell death in LNCaP cells (Xiao et al., 2008). Compared to U19/EAF2 or p53 alone, significantly fewer colonies were formed when transfected with both genes (Figure 6). This provides evidence of an additive or synergistic action between U19/EAF2 and p53 in growth suppression of LNCaP cells.
Figure 6.

Effects of U19/EAF2 and p53 on colony formation. (a) Surviving LNCaP cells co-transfected with U19/EAF2 and/or p53 at 3 weeks stained with crystal violet. (b) Data depicted as mean ± SEM from one representative experiment performed in triplicate, (* p < 0.02).
Discussion
U19/EAF2 is a newly identified tumor suppressor that is frequently down-regulated in human prostate cancer and has been shown to induce tumorigenesis in multiple tissues in the mouse model. However, the mechanism of U19/EAF2 tumor suppression remains unclear. In the present study, we have generated evidence for a link between U19/EAF2 and the p53 pathway and shown that U19/EAF2 is required for normal expression of TSP-1, providing a molecular mechanism involved in U19/EAF2 action.
The effect of U19/EAF2 knockout on TSP-1 expression is unlikely to be secondary to the phenotype changes in the knockout prostate. The TSP-1 down-regulation was identified in 3 month old U19/EAF2 knock out mice, which did not develop obvious phenotype. The modulation of TSP-1 promoter activity by U19/EAF2, particularly in the presence of p53, in cultured cells suggested that U19/EAF2 regulation of TSP-1 expression in vivo also occurs at the promoter, not secondary to phenotype changes. The ability of U19/EAF2 to increase the activity of TSP-1 promoter, particularly in the presence of p53, in cultured cells is in agreement with the in vivo observation that U19/EAF2 knockout caused TSP-1 down-regulation.
Studies on p53 regulation of TSP-1 expression are conflicting. While some studies have shown that p53 expression levels corresponds with TSP-1 expression and that the loss of p53 and resulting reduction in TSP-1 expression contributes to angiogenesis, others have failed to demonstrate a correlation between p53, TSP-1 and tumor progression (reviewed in (Ren et al., 2006). The effect of tumor suppressors and oncogenes, including p53, on TSP-1 expression seems to vary and may be cell type- or tissue type-specific. Our studies showed that p53 inhibited the TSP-1 promoter activity in PC-3 cells. The inhibition was also observed in LNCaP, H1299 and 293 cell lines, and p53 suppression of TSP-1 expression has also been reported in HA1E cells (Zhou et al., 2009), suggesting that p53 repression of TSP-1 promoter activity is likely to occur in many different types of cells. However, several other studies have reported that p53 has no effect on TSP-1 promoter activity (Cinatl et al., 1999; Reiher et al., 2001; Zhou et al., 2009). We have searched for and were unable to identify potential p53 binding sites in the TSP-1 promoter using the basic local alignment search tool (BLAST) (Altschul et al., 1990), suggesting that p53 may not directly bind to the TSP-1 promoter. The repression of TSP-1 promoter by p53 may be mediated through other co-factors or co-repressors that bind to the TSP-1 promoter. Further studies will be needed to elucidate the mechanisms by which p53 regulates TSP-1 expression and the mechanisms by which U19/EAF2 modulates p53 regulation of the TSP-1 promoter.
Down-regulation of TSP-1 is likely to contribute to the elevated CD31-positive blood vessel density in the U19/EAF2 knock out liver. TSP-1 is a well established anti-angiogenesis factor. Significant TSP-1 down-regulation at both mRNA and protein levels is likely to have functional consequences, causing elevated blood vessel density. VEGF is another important factor that regulates angiogenesis. Since VEGF expression was not altered in U19/EAF2 knockout mice, U19/EAF2 affect on CD31-positive blood vessel density is unlikely mediated through VEGF. Taken together, our observations suggested that TSP-1 down-regulation represents a major mechanism mediating the influence of U19/EAF2 knockout CD31 positive blood vessel density.
Our studies argue that U19/EAF2 could suppress tumorigenesis via multiple pathways. U19/EAF2 could inhibit cell proliferation directly, indicating that this loss of growth inhibition would represent another mechanism of tumorigenesis in U19/EAF2 knockout mice. In this study, we found increased CD31-positive large vessel density in the U19/EAF2 knockout liver, suggesting a potential role of U19/EAF2 in the regulation of angiogenesis via TSP-1 down-regulation. Given the established importance of angiogenesis in carcinogenesis, down-regulated TSP-1 expression may also contribute to the increased tumor formation in U19/EAF2 knockout mice.
The functional interactions between U19/EAF2 and p53 may be indirect. Although U19/EAF2 could alleviate p53 repression of TSP-1 promoter activity, U19/EAF2 did not block p53 inhibition of colony formation in prostate cancer cells. This observation suggests that U19/EAF2 does not counteract the influence of p53 on cell growth and/or survival in culture. Both U19/EAF2 and p53 are growth suppressive and our results suggest that the inhibition of colony formation by U19/EAF2 and p53 together is greater than the inhibition by either of them individually. Thus, these two tumor suppressors could work together in inhibiting carcinogenesis under certain circumstances, while antagonizing the regulation of TSP-1 expression.
Previous studies showed that androgen receptor (AR) can regulate TSP-1 expression in the prostate via direct binding to androgen response elements (AREs) in the TSP-1 promoter. Since U19/Eaf2 expression is regulated by AR in the prostate, androgens could influence TSP-1 expression in the prostate both directly, via AR, and indirectly, via U19/Eaf2. These direct and indirect mechanisms may allow androgens to more dramatically modulate TSP-1 expression in the prostate.
The biochemical nature of U19/EAF2’s association with p53 remains to be elucidated. They may be brought together via their mutual binding partners, such as ELL and/or pVHL. Whether U19/Eaf2 can make contact with p53 directly remains to be investigated. We were also unable to show whether endogenous U19/EAF2 could co-immunoprecipitate with endogenous p53 at this point. Existing anti-U19/EAF2 antibodies are insufficient for protein analysis because they are non-specific. Additionally, because U19/EAF2 is growth suppressive and frequently down-regulated in prostate cancer cells, endogenous U19/EAF2 protein expression level is very low. The association between endogenous U19/EAF2 and p53 also may not be stable. The co-immunoprecipitation studies to address these issues may be feasible when high quality anti-U19/EAF2 antibodies are developed and available.
Our studies showed that TSP-1 down-regulation by U19/EAF2 knockout was tissue-specific in the mouse model. For example, we did not detect significant differences in TSP-1 expression between wild-type and U19/EAF2 knockout lung (data not shown). This indicates the tissue-specificity of U19/EAF2 regulation of TSP-1 expression and the influence of cellular context on the regulation TSP-1 by U19/EAF2. One potential explanation may be that EAF1, the U19/EAF2 homolog, may be able to compensate for the loss of U19/EAF2 in TSP-1 regulation in some tissues, such as the lung, but not in other tissues, such as the liver and prostate. Alternatively, U19/EAF2 may not interact with p53 or p53 may affect TSP-1 expression in an organ-specific manner.
In conclusion, our studies provide evidence for functional interactions between a well established tumor suppressor, p53, and a newly identified tumor suppressor, U19/EAF2. Mouse knockout studies revealed that U19/EAF2 is required for the normal expression of TSP-1 and blood vessel formation in a tissue-specific manner. We found that U19/EAF2 co-immunoprecipitated and co-localized with p53 in transient transfected cells suggesting functional interaction. Co-transfection studies suggested that U19/EAF2 regulation of TSP-1 expression may involve alleviation of p53 repression of the TSP-1 promoter activity. Taken together, our studies indicate that U19/EAF2 can modulate blood vessel formation in part via alleviating p53 repression of TSP-1 expression.
Acknowledgments
This work was supported by Grant Number R01 CA 120386, R37 DK51993 from NIH, and Prostate Cancer Specialized Program of Research Excellence (SPORE), CA90386.
This study was supported in part by National Institutes of Health Grant 5R37DK051193-13.
References
- Altschul SF, Gish W, Miller W, Myers EW, Lipman DJ. J Mol Biol. 1990;215:403–10. doi: 10.1016/S0022-2836(05)80360-2. [DOI] [PubMed] [Google Scholar]
- Alvarez AA, Axelrod JR, Whitaker RS, Isner PD, Bentley RC, Dodge RK, Rodriguez GC. Gynecol Oncol. 2001;82:273–8. doi: 10.1006/gyno.2001.6287. [DOI] [PubMed] [Google Scholar]
- Azam N, Vairapandi M, Zhang W, Hoffman B, Liebermann DA. J Biol Chem. 2001;276:2766–74. doi: 10.1074/jbc.M005626200. [DOI] [PubMed] [Google Scholar]
- Cinatl J, Jr, Kotchetkov R, Scholz M, Cinatl J, Vogel JU, Driever PH, Doerr HW. Am J Pathol. 1999;155:285–92. doi: 10.1016/S0002-9440(10)65122-X. [DOI] [PMC free article] [PubMed] [Google Scholar]
- Donoviel DB, Framson P, Eldridge CF, Cooke M, Kobayashi S, Bornstein P. J Biol Chem. 1988;263:18590–3. [PubMed] [Google Scholar]
- Duan X, Zhang H, Liu B, Li XD, Gao QX, Wu ZH. Int J Radiat Biol. 2008;84:211–7. doi: 10.1080/09553000801902117. [DOI] [PubMed] [Google Scholar]
- Framson P, Bornstein P. J Biol Chem. 1993;268:4989–96. [PubMed] [Google Scholar]
- Freitas TM, Miguel MC, Silveira EJ, Freitas RA, Galvao HC. Exp Mol Pathol. 2005;79:79–85. doi: 10.1016/j.yexmp.2005.02.006. [DOI] [PubMed] [Google Scholar]
- Harada H, Nakagawa K, Saito M, Kohno S, Nagato S, Furukawa K, Kumon Y, Hamada K, Ohnishi T. Cancer Lett. 2003;191:109–19. doi: 10.1016/s0304-3835(02)00592-x. [DOI] [PubMed] [Google Scholar]
- Jiang C, Hu H, Malewicz B, Wang Z, Lu J. Mol Cancer Ther. 2004;3:877–84. [PubMed] [Google Scholar]
- Kwak C, Jin RJ, Lee C, Park MS, Lee SE. BJU Int. 2002;89:303–9. doi: 10.1046/j.1464-4096.2001.01417.x. [DOI] [PubMed] [Google Scholar]
- Maeda K, Chung YS, Takatsuka S, Ogawa Y, Onoda N, Sawada T, Kato Y, Nitta A, Arimoto Y, Kondo Y, et al. Br J Cancer. 1995;72:319–23. doi: 10.1038/bjc.1995.331. [DOI] [PMC free article] [PubMed] [Google Scholar]
- Mitani K, Yamagata T, Iida C, Oda H, Maki K, Ichikawa M, Asai T, Honda H, Kurokawa M, Hirai H. Biochem Biophys Res Commun. 2000;279:563–7. doi: 10.1006/bbrc.2000.3970. [DOI] [PubMed] [Google Scholar]
- Nelius T, Filleur S, Yemelyanov A, Budunova I, Shroff E, Mirochnik Y, Aurora A, Veliceasa D, Xiao W, Wang Z, Volpert OV. Int J Cancer. 2007;121:999–1008. doi: 10.1002/ijc.22802. [DOI] [PMC free article] [PubMed] [Google Scholar]
- Reiher FK, Ivanovich M, Huang H, Smith ND, Bouck NP, Campbell SC. J Urol. 2001;165:2075–81. doi: 10.1097/00005392-200106000-00073. [DOI] [PubMed] [Google Scholar]
- Ren B, Yee KO, Lawler J, Khosravi-Far R. Biochim Biophys Acta. 2006;1765:178–88. doi: 10.1016/j.bbcan.2005.11.002. [DOI] [PubMed] [Google Scholar]
- Roe JS, Kim H, Lee SM, Kim ST, Cho EJ, Youn HD. Mol Cell. 2006;22:395–405. doi: 10.1016/j.molcel.2006.04.006. [DOI] [PubMed] [Google Scholar]
- Selfridge J, Pow AM, McWhir J, Magin TM, Melton DW. Somat Cell Mol Genet. 1992;18:325–36. doi: 10.1007/BF01235756. [DOI] [PubMed] [Google Scholar]
- Shinobu N, Maeda T, Aso T, Ito T, Kondo T, Koike K, Hatakeyama M. J Biol Chem. 1999;274:17003–10. doi: 10.1074/jbc.274.24.17003. [DOI] [PubMed] [Google Scholar]
- Simone F, Luo RT, Polak PE, Kaberlein JJ, Thirman MJ. Blood. 2003;101:2355–62. doi: 10.1182/blood-2002-06-1664. [DOI] [PubMed] [Google Scholar]
- Tokunaga T, Nakamura M, Oshika Y, Tsuchida T, Kazuno M, Fukushima Y, Kawai K, Abe Y, Kijima H, Yamazaki H, Tamaoki N, Ueyama Y. Virchows Arch. 1998;433:415–8. doi: 10.1007/s004280050268. [DOI] [PubMed] [Google Scholar]
- Wang Z, Tufts R, Haleem R, Cai X. Proc Natl Acad Sci U S A. 1997;94:12999–3004. doi: 10.1073/pnas.94.24.12999. [DOI] [PMC free article] [PubMed] [Google Scholar]
- Wiederschain D, Kawai H, Gu J, Shilatifard A, Yuan ZM. Mol Cell Biol. 2003;23:4230–46. doi: 10.1128/MCB.23.12.4230-4246.2003. [DOI] [PMC free article] [PubMed] [Google Scholar]
- Xiao W, Jiang F, Wang Z. Prostate. 2006;66:1–12. doi: 10.1002/pros.20309. [DOI] [PubMed] [Google Scholar]
- Xiao W, Zhang Q, Habermacher G, Yang X, Zhang AY, Cai X, Hahn J, Liu J, Pins M, Doglio L, Dhir R, Gingrich J, Wang Z. Oncogene. 2008;27:1536–44. doi: 10.1038/sj.onc.1210786. [DOI] [PMC free article] [PubMed] [Google Scholar]
- Xiao W, Zhang Q, Jiang F, Pins M, Kozlowski JM, Wang Z. Cancer Res. 2003;63:4698–704. [PubMed] [Google Scholar]
- Zhou J, Feng X, Ban B, Liu J, Wang Z, Xiao W. J Biol Chem. 2009 doi: 10.1074/jbc.M109.010439. [DOI] [PMC free article] [PubMed] [Google Scholar]