Abstract
The manganese superoxide dismutase (MnSOD) ala16val polymorphism has been associated with various diseases including breast cancer. In the present study, we investigated levels of MnSOD protein, enzymatic activity and mRNA with respect to MnSOD genotype in several human breast carcinoma cell lines and in mouse embryonic fibroblasts (MEF), developed from the MnSOD knockout mouse, stably expressing human MnSOD-ala and MnSOD-val. In human breast cell lines, the MnSOD-ala allele was associated with increased levels of MnSOD protein and MnSOD protein per unit mRNA. In the MEF transformants, MnSOD activity correlated fairly well with MnSOD protein levels. MnSOD mRNA expression was significantly lower in MnSOD-ala versus MnSOD-val lines. MnSOD protein and activity levels were not related to MnSOD genotype in the transformed MEF, although, as observed in the human breast cell lines, the MEF human MnSOD-ala lines produced significantly more human MnSOD protein per unit mRNA than the human MnSOD-val lines. This suggests that there is more efficient production of MnSOD-ala protein compared to MnSOD-val protein. Examination of several indicators of reactive oxygen species levels, including superoxide and hydrogen peroxide, in wild type MEF and in MEF expressing similar elevated amounts of MnSOD-ala or val activity did not show differences related to the levels of MnSOD protein expression. In conclusion, in both human breast carcinoma cell lines and MEF cell lines stably transfected with human MnSOD, the MnSOD-ala allele was associated with increased production of MnSOD protein per unit mRNA indicating a possible imbalance in MnSOD protein production from the MnSOD-val mRNA.
Keywords: MnSOD, breast cancer, oxidative stress, polymorphism
Introduction
Manganese superoxide dismutase (MnSOD) is responsible for converting superoxide to hydrogen peroxide in the mitochondrial matrix. MnSOD is translated in the cytoplasm and then imported into the mitochondria via a mitochondrial targeting signal (MTS). A polymorphism that causes a change from alanine to valine at the 16th amino acid (ala16val) in the MTS of human MnSOD has been linked to a number of diseases including breast cancer [1–10]. This polymorphism is predicted to result in a change in the secondary structure in the MTS domain of the protein from an α-helix (alanine) to a β-sheet conformation (valine) [11]. The classic structure for the MTS domain in proteins that are imported into the mitochondria is the α-helix. The valine substituted protein containing the β-sheet structured MTS would not be expected to import as efficiently as the alanine, α-helix structure.
Previously, a difference in mitochondrial processing efficiency due to the ala16val polymorphism was found using a mitochondrial import assay in which the human MnSOD MTS was fused to a reporter protein [12]. The study showed an 11% decrease in import efficiency with the valine MTS in comparison to the alanine MTS. Another study investigated human MnSOD protein import using an in vitro transcription/translation design and rat liver mitochondria. Import of the valine protein was partially arrested in the mitochondrial inner membrane resulting in 30–40% less active MnSOD protein in the mitochondrial matrix [13]. A third study showed that when the alanine form of human MnSOD protein was transiently transfected into a human hepatoma cell line, four-fold more MnSOD protein was found in the mitochondrial matrix compared to cells transfected with the valine form of the protein. Any MnSOD protein not imported into the mitochondria was degraded by the proteasome and the polymorphism was also found to decrease mRNA stability [14].
While these studies demonstrated effects ascribed to the polymorphism using isolated mitochondria or cells transiently transfected with MnSOD, there has been little investigation of the effect of the polymorphism on endogenous MnSOD. Two studies using intact mesothelioma cells or peripheral blood mononuclear cells (n=10) failed to find a difference in endogenous MnSOD protein levels related to the polymorphism [15, 16].
Based on the predicted targeting structure of MnSOD, we hypothesized that the valine allele would result in decreased amounts of MnSOD protein and activity. To this end, we have compared these end points along with mRNA levels in several human breast carcinoma cell lines 4 homozygous for the ala or val genotype. We also made similar comparisons in mouse embryonic fibroblasts (MEF) from the SOD2−/− mouse that we transformed to stably express either human MnSOD-ala or MnSOD-val.
Materials and Methods
Chemicals and Reagents
Real-time PCR primers/probes were purchased from Applied Biosystems (Foster City, CA, USA); the SOD activity kit was purchased from Cayman Chemical (Ann Arbor, MI, USA); and the MnSOD and porin antibodies were purchased from EMD Biosciences/Calbiochem (La Jolla, CA, USA). The Alexa 680 secondary antibodies were purchased from Molecular Probes (Eugene, OR, USA). 5-(and-6)-chloromethyl-2’,7’-dichlorodihydrofluorescein diacetate, acetyl ester (CM-H2DCFCA), dihydroethidium (DHE), 3,3’-dihexyloxacarbocyanine iodide (DiOC6), and Hoechst 33258 dye were all purchased from Invitrogen (Carlsbad, CA). Rotenone, Antimycin A (AA), propidium iodide (PI), S-nitrosoglutathione (GSNO), and sulforhodamine B (SRB) were purchased from Sigma (St. Louis, MO). All other reagents were from common vendors.
Human Cell lines
Six human breast cancer-derived epithelial cell lines were purchased from ATCC (Reston, VA, USA): HCC38, MCF7, MDA-MB-231, T47D, ZR-75-1, and ZR-75-30. All cell lines were cultured in the media recommended by ATCC.
MEF Cell Lines
MEF from MnSOD−/− and MnSOD+/+ mice were the generous gift of Dr. Simon Melov at Buck Institute for Age Research. The cell lines were grown in DMEM (17-205-CV, Mediatech) without phenol red, supplemented with 4mM L-glutamine (Sigma, St. Louis, MO) and 10% fetal bovine serum (FBS, Atlanta Biologicals, Lawrenceville, GA). The knockout SOD2tm1Cje mice were created in a CD1 mouse background via homologous recombination that disrupted exon 3, producing a shortened mRNA with no enzymatic activity. Most of the knockout mice died within 10 days of birth after suffering dilated cardiomyopathy, metabolic acidosis, and an accumulation of lipids in the liver and skeletal muscles [17].
Creation of MnSOD vector
The pcDNA3 vectors containing the ala or val MnSOD cDNAs were generously provided by Dr. Larry Oberley. The MnSOD cDNA was removed from the pcDNA3 vector by digestion with KpnI and EcoR1 (New England Biolabs, Ipswich, MA) at 37°C for 3 hours. The MnSOD fragment was purified following gel electrophoresis and then ligated into the pcDNA3.1/Zeo expression vector (Invitrogen) under the control of a CMV promoter. The new vector was sequenced (DNA sequence facility, Johns Hopkins University, Baltimore, MD) and transformed into E. coli using the TOPO cloning kit (Invitrogen) according to the manufacturer’s instructions. DNA was isolated with the QIAGEN Plasmid kit (QIAGEN, Valencia, CA) and sequenced.
Stable transfection of MEF cells
MEFs were grown to 70% confluency prior to transfection. Transfection was performed using Lipofectamine reagent (Invitrogen). Five ug of pcDNA3.1/Zeo/MnSOD DNA was diluted into serum-free media and 25ul lipofectamine for each transfection. This mixture was incubated at room temperature for 45 min. Cells in 60 mm dishes were washed three times with serum-free medium and then incubated for 45 min. The DNA/medium/lipofectamine was added to each dish and then incubated for three hours. Three ml of media with serum was then added to each plate without removing the transfection mixture and the plates were incubated overnight. The medium was completely replaced the following day. 72 hours post-transfection the cells were passaged into medium containing 250 µg/ml Zeocin at a dilution of 1:10. The medium was replaced every 3 days until colonies formed. Single colonies were isolated using sterile cloning disks (Bel-Art Products, Pequannock, NJ) soaked in trypsin. Cells lines were maintained as described above in 250 µg/ml Zeocin.
Preparation of samples
DNA
DNA was purified using the QIAGEN DNA mini kit (Valencia, CA, USA) according to the manufacturer’s instructions. DNA from the human cell lines was genotyped for the MnSOD ala16val polymorphism using an RFLP protocol as described by Ambrosone, et al [2].
Western blot analysis
Cell cultures were harvested by scraping into HEPES buffer (20mM HEPES, 1mM EGTA, 210mM mannitol, 70mM sucrose, pH 7.2). The cells were then lysed via Dounce homogenization on ice and centrifuged at 1,500 × g for 5 min at 4°C. Supernatant was collected and protein concentration was quantitated using the Bradford Assay [18]. Western blot was conducted according to standard laboratory procedures. MnSOD was detected using 1 µg/ml rabbit anti-human MnSOD antibody (Upstate, Waltham, MA, USA) diluted in Licor Blocking Buffer 1:1 in PBS. Alexa-680 goat anti-rabbit antibody (1:5000) was also diluted in Licor Blocking Buffer 1:1 in PBS. Porin protein was detected using a rabbit anti-porin antibody (2 µg/ml) (Calbiochem, La Jolla, CA, USA) and Alexa-680 antibody as above. Protein bands were detected and quantified using an Odyssey Imaging System (Li-Cor Biosciences).
SOD Activity Assay
For the human cell lines, MnSOD activity was measured using the SOD activity kit according to the manufacturer’s instructions (Caymen Chemical, Ann Arbor, MI, USA). The SOD kit uses a tetrazolium salt to detect superoxide generated by xanthine oxidase and hypoxanthine. All standard curves had an r2≥0.90. For the MEF transformants, SOD activity was assessed using the method of Flohe and Otting [19]. Briefly, freshly homogenized samples were separated on a 12% Tris-Glycine polyacrylamide gel (Invitrogen) under non-denaturing conditions. The gel was then stained with nitroblue tetrazolium (NBT) in the presence of TEMED and riboflavin. NBT forms a blue formazon dye in the presence of superoxide, leaving a clear band where SOD is active. 3mM KCN was added to all sample reactions to inhibit Cu/Zn SOD activity [20].
RNA isolation, Real-time PCR and DNA copy number
RNA was isolated using RNA-Bee (Tel-Test, Inc, Friendswood, TX, USA) with phenol-chloroform extraction followed by precipitation in isopropanol. RNA was quantitated by absorbance at 260 nm.
For reverse transcription, the GeneAmp RNA PCR core kit (Applied Biosystems, Foster City, CA) was used according to the manufacturer’s instructions. Two µg RNA was combined with a reverse transcription mixture that contained 5 mM MgCl2, 1X PCR Buffer II, 0.5 mM each of dGTP, dATP, dCTP, and dTTP, 0.4 U RNase inhibitor, 2.5 µM random hexamers, and 1.25 U MuLV Reverse Transcriptase. The reaction mixture was cycled one time as follows: 15 min at 42°C, 5 min at 99°C, and 5 min at 5°C. A negative control with no RNA was included in all experiments.
mRNA levels and MnSOD gene copy number in DNA were quantitated by real-time PCR using the ABI Prism 7000 sequence detection system according to the manufacturer’s instruction (Applied Biosystems). All samples initially had 100 ng of cDNA or DNA and had a final reaction volume of 25 µl. Universal PCR Master Mix (Applied Biosystems) was used for all reactions. Primers and probes that amplified the exon 4 to exon 5 boundary of MnSOD were commercially available (Applied Biosystems). GAPDH was also assessed using the GAPDH Control Reagents Kit (402869) from Applied Biosystems. The primer/probe mixtures were used at a final dilution of 1x. The reaction was quantitated using a linear curve that was produced by amplifying serial dilutions of cDNA or DNA. For determination of MnSOD DNA copy number, the isolated DNA was subjected to treatment with RNAse A prior to real-time PCR. All experiments were performed in triplicate and replicated at least three times.
Expression of mRNA was analyzed using reverse transcription PCR (RT-PCR) to confirm real-time PCR results. Primers for MnSOD were 5’GTTGGCCAAGGGAGATGTTA and 5’CTGATTTGGACAAGCAGCAA. GAPDH was used as a control with the following primers: 5’CCATCACTGCCACCCAGAAG and 5’ATCCACGACGGACACATTGG. Following reverse transcription, each tube was adjusted to contain 2 mM MgCl2, 1x PCR Buffer II, 0.1 µM of each primer, and 2.5U/100 µl AmpliTaq DNA polymerase. The reaction cycled twenty times at 94°C for 30 s, 60°C for 30 s, and 70°C for 1 minute. 1x DNA gel loading buffer (Quality Biologicals, Inc, Gaithersburg, MD) was added to each tube and PCR products were separated electrophoretically on a 1% agarose gel using 0.5x TBE running buffer. Images of the gels were captured using an UV transilluminator and the BioDoc-It™ System (UVP, Upland, CA).
ROS levels
ROS levels were determined by flow cytometry in the core lab at the Johns Hopkins Bloomberg School of Public Health using a Coulter Epics Elite flow cytometer and analyzed using Coulter Elite software. Control samples were prepared for each experiment as follows: unstained cells, heat killed cells (56°C, 60 minutes), and cells stained with either dye alone.
For superoxide and H2O2 assessment, 250,000 cells were plated in six well plates and allowed to attach overnight in the incubator. Once the incubation period for each dye was complete, wells were rinsed twice with cold PBS and trypsinized. Cells were then washed with media containing serum to inactivate trypsin and washed two more times with cold PBS. Cells were finally suspended in 0.5 mls of cold PBS for analysis. Cells were kept in the dark on ice for approximately 20 minutes until analysis.
Superoxide was detected using DHE, which fluoresces red upon oxidation. Cells were simultaneously stained with DiOC6, which selects for live cells with an intact mitochondrial membrane. Cells were dosed with rotenone at 10 µM for 20 minutes in the dark, which blocks complex I of the electron transport chain (ETC) thereby increasing ROS. DHE (5 µM) and DiOC6 (30 nM) were added to the cultures for 20 minutes at 37°C in the dark.
H2O2 was analyzed with CM-H2DCFCA, which emits green fluorescence upon oxidation. Propidium iodide staining assessed dead cells, which were excluded from analysis. Cells were treated with Antimycin A at 40 nM for 1 hour at 37°C, which blocks complex III of the ETC thereby increasing ROS levels. CM-H2DCFCA was added to cultures at 10 µM for 30 minutes at 37°C in the dark.
Nitric oxide was analyzed with the Nitrate/nitrite fluorometric assay kit according to the manufacturer’s instructions (#780051, Cayman Chemical, Ann Arbor, MI). Cells were plated at a density of 250,000 cells per well in a six well plate and allowed to attach for five hours. Cells were then treated with S-nitrosoglutathione at 0.5 mM overnight. Briefly, 20 µl of media from each cell culture was incubated with nitrate reductase to reduce all nitrate to nitrite. 2’,3’-diaminonaphthalene, which is converted to the fluorescent 1(H)-naphthotriazole in the presence of nitrite, was added to each sample and fluorescence was detected at excitation 365 nm, emission 430 nm. Samples were quantitated against a standard curve created using the nitrite standard included in the kit.
Data analysis
Data were analyzed using GraphPad Prism 3.02 (GraphPad Software, San Diego, CA). Results from the Westerns, activity assays, RT-PCR, and ROS measurements were all analyzed via ANOVA. Statistical significance was defined as p<0.05. All experiments were repeated at least three separate times and the data points in each experiment were performed in duplicate.
Results
Human Breast Cancer Cell Lines
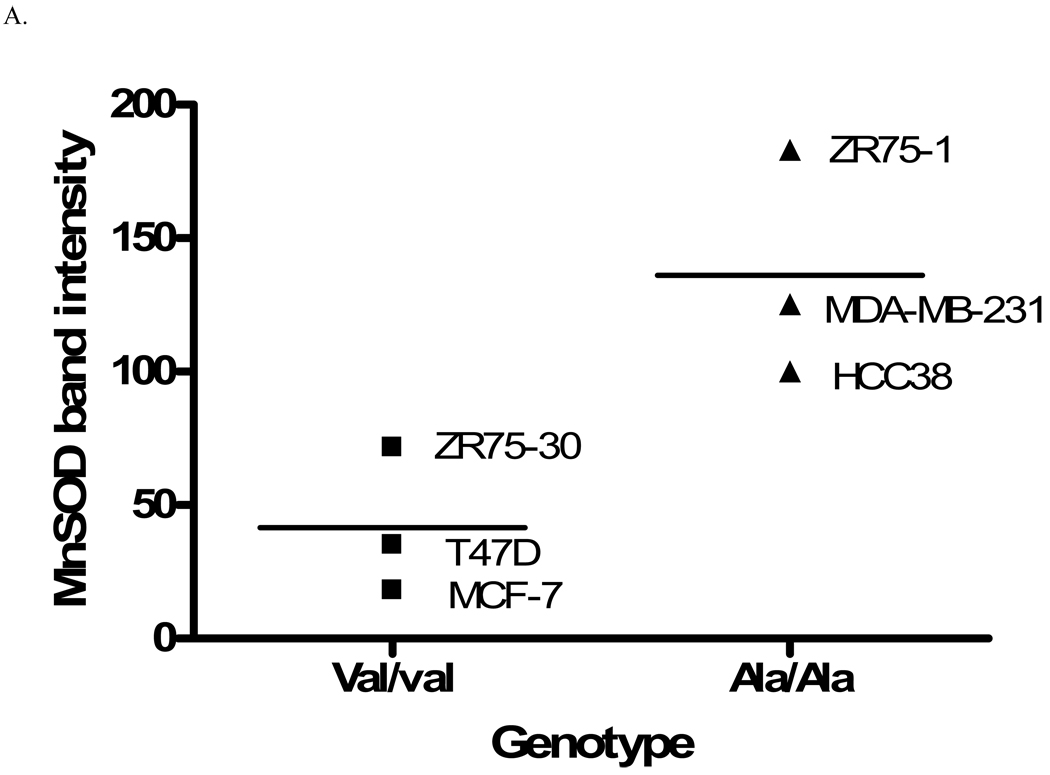
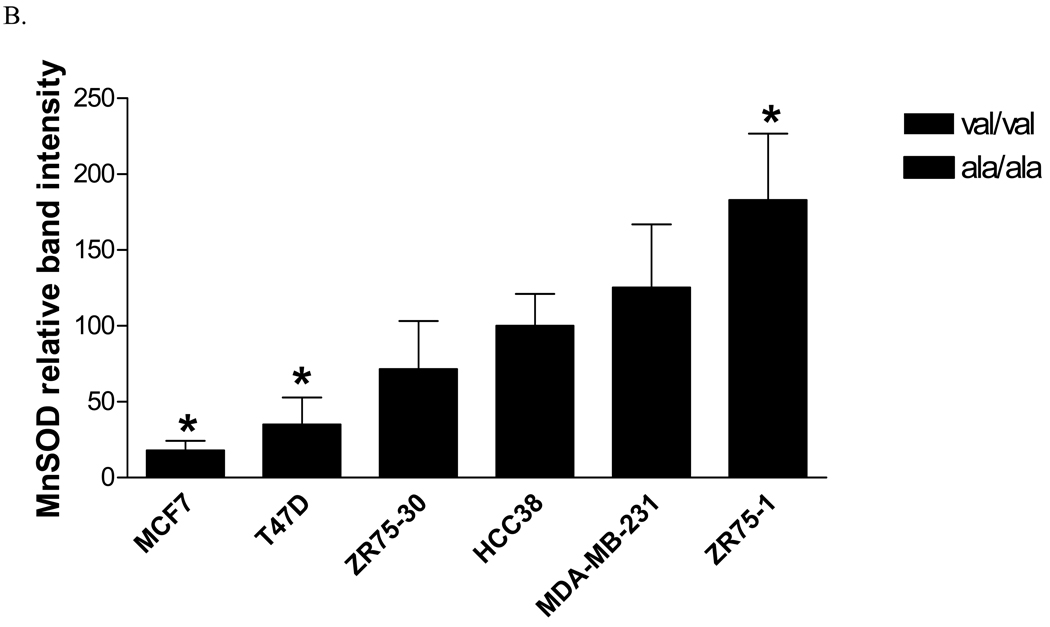
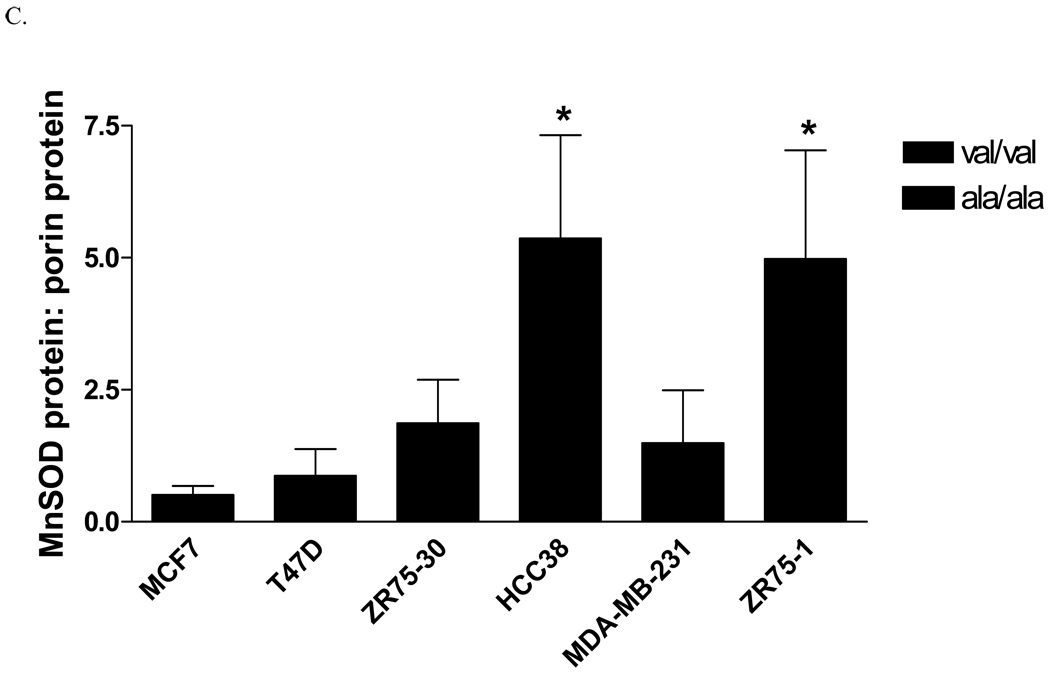
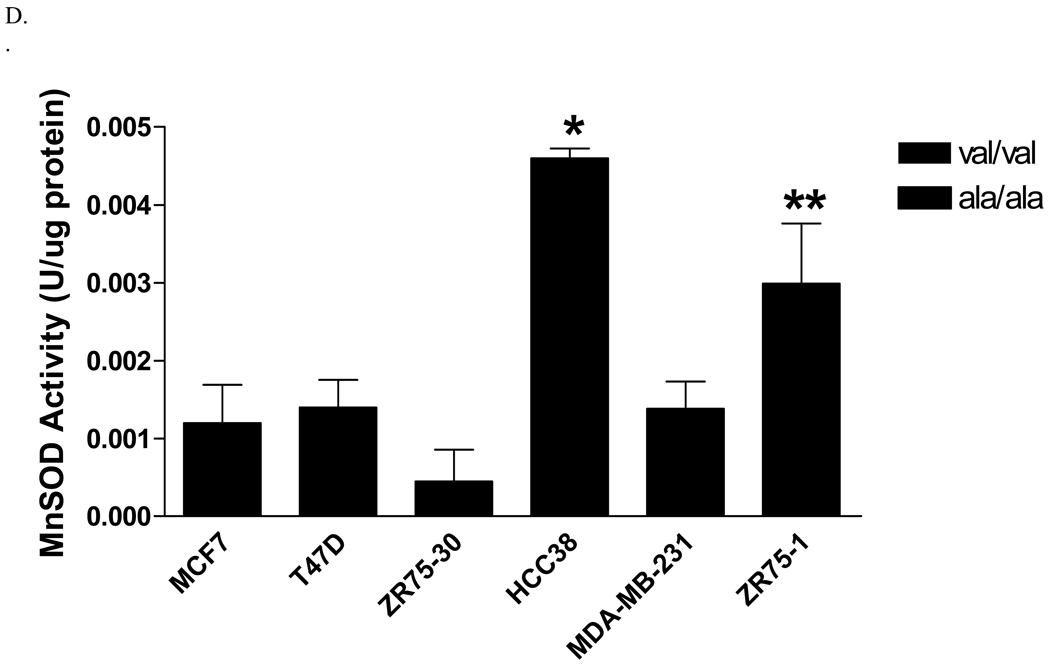
Six human breast cancer cell lines, three homozygous for the alanine allele (MDA-MB-231, HCC38, and ZR-75-1), and three homozygous for the valine allele (MCF-7, T47D, and ZR-75-30), were evaluated for MnSOD protein, activity and mRNA levels. The overall average MnSOD protein level for the ala/ala cells was significantly higher (p<0.05) than the average for the val/val cells (Figure 1A). Among the individual cell lines, the difference was statistically significant only in one ala/ala line (Figure 1B). Thus, as indicated, the only the ZR-75-1 ala/ala cell line had a greater amount of MnSOD protein than the two val/val lines, MCF-7 and T47D (p<0.01). Porin, a member of the voltage-dependent anion channel (VDAC) in the OMM, was evaluated in each cell line as an indicator of mitochondrial density (data not shown) [21]. When adjusted for porin levels, two of the three ala/ala lines, HCC38 and ZR-75-1, had greater MnSOD:porin ratios than the val/val cell lines, MCF-7 and T47D (p<0.05) (Figure 1C). MDA-MB-231 did not have a higher MnSOD: porin protein ratio than the val/val lines. Porin levels in this cell line were approximately 2-fold greater (p<0.05) than in the other cell lines, suggesting that this line had a higher density of mitochondria. Analysis of MnSOD enzymatic activity revealed that the same two (HCC38 and ZR-75-1) of the three ala/ala lines had increased activity (Figure 1D). The ala/ala cell line, HCC38, had significantly more MnSOD activity than each of the val/val lines, and the ala/ala line ZR-75-1, had significantly more MnSOD activity than the val/val line, ZR-75-30.
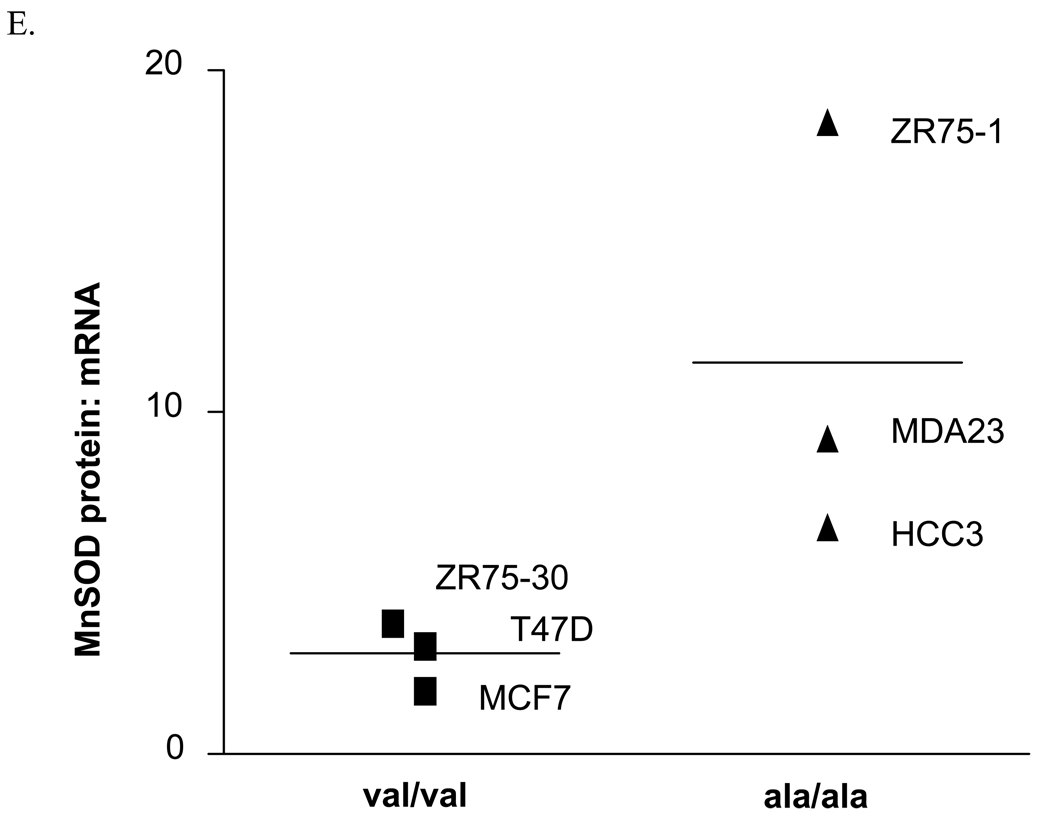
Fig. 1. Analysis of MnSOD protein, activity, and mRNA expression levels in human breast cancer cell lines.
A. Average MnSOD protein levels by genotype. Each point represents the average MnSOD expression for each cell line (n=3) and the bar is the average of all three cell lines. The ala/ala cell lines analyzed as a group had significantly more MnSOD protein expression that the val/val cell lines (p<0.05). B. MnSOD protein expression in individual cell lines (*MCF7 and T47D are significantly different from ZR75-1, p<0.01). C. MnSOD protein adjusted for mitochondrial density represented by porin protein levels (*p<0.05 versus MCF-7 and T47D). D. MnSOD enzymatic activity (*p<0.05 versus MCF-7, T47D, ZR-75-30, and MDA-MB-231, **p<0.05 versus ZR-75-30). E. MnSOD protein corrected for MnSOD mRNA expression (p=0.08). All experiments were completed in triplicate (n=3 ± SD)
Determination of MnSOD mRNA levels found no significant differences among the cell lines (data not shown). MnSOD protein levels were adjusted for MnSOD mRNA levels in order to determine if the polymorphism was associated with an imbalance in the relationship between levels of MnSOD protein and mRNA present in the cells. The average MnSOD protein levels per unit mRNA in the ala/ala cells was greater than in the val/val cells, but the difference was not quite statistically significant (p=0.08) (Figure 1E). However, the ala/ala cell line, ZR-75-1, had significantly more MnSOD protein per unit mRNA than the val/val cell lines, MCF-7 and T47D (p<0.05).
MEF Transformants
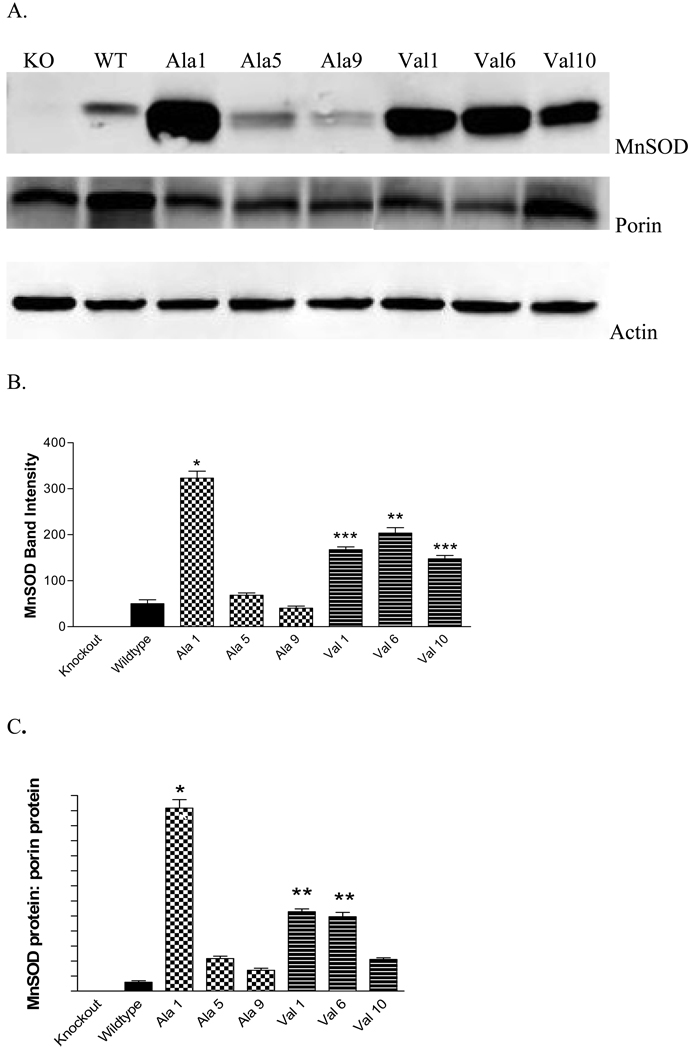
Human MnSOD was stably inserted into MEF cells derived from SOD2Δ mice. The vector for MnSOD had either the val or ala allele under CMV promoter control. A total of ten ala and ten val lines were identified by selection for growth in Zeocin. Of these twenty lines, three expressed MnSOD-ala and three MnSOD-val protein as determined by Western blot (Figure 2A). MnSOD was not detected in a vector-only transfected control line (not shown). As shown in Figure 2B and Table 1, the MnSOD-ala1 cell line expressed significantly more MnSOD protein than the other lines. MnSOD-ala5 and MnSOD-ala9 expressed MnSOD similar to wildtype levels. The three MnSOD-val lines expressed levels between the high MnSOD-ala1 line and the other MnSOD-ala lines (Figure 2B). These results show that the levels of human ala and val MnSOD protein varied among the clones and was not related to the MnSOD genotype.
Fig. 2. Quantification of MnSOD protein in MEF transformant cell lines.
MEF cells were stably transfected with human MnSOD ala or val and selected by continuous growth in Zeocin. (A.) Representative Western blots of MEF cells transfected with human MnSOD. Top gel is immunoblotted for MnSOD, middle gel for porin, bottom gel for actin (loading control). (B.) MnSOD protein expression in MEF cells from the SOD2−/− mouse. Human MnSOD expression as determined by Western blot. MnSOD-ala1 (*) and MnSOD-val6 (**) lines are significantly different from all other cell lines (p<0.05). (***) MnSOD-val1 and MnSOD-val10 have significantly more MnSOD than the wildtype line, MnSOD-ala5 and MnSOD-ala9 (p<0.05). Each bar represents the average of three experiments, ± SD. (C.) MnSOD protein adjusted for porin protein. Porin protein was used to quantify mitochondrial density. * Indicates significantly different from all other cell lines (p<0.01). ** Indicates significantly different than all other lines (p<0.05)
Table 1. Comparison of transformant cell lines.
DNA, mRNA, protein levels and enzyme activity of MnSOD in transformant cell lines. All figures represent fold change versus wildtype cells.
| Cell line | Relative MnSOD Protein levels |
Relative MnSOD Activity |
Relative MnSOD mRNA levels |
Relative MnSOD DNA |
|---|---|---|---|---|
| WT | 1.0 | 1.0 | 1.0 | 1.0 |
| KO | 0.0 | −0.04 | 0.3 | 0.7 |
| MnSOD-Ala1 | 6.5 | 2.7 | 2.9 | 166.5 |
| MnSOD-Ala5 | 1.4 | 0.3 | 0.8 | 4.0 |
| MnSOD-Ala9 | 0.8 | 0.1 | 0.6 | 75.8 |
| MnSOD-Val1 | 3.3 | 2.6 | 30.3 | 233.1 |
| MnSOD-Val6 | 4.1 | 3.4 | 13.0 | 372.2 |
| MnSOD-Val10 | 2.9 | 0.9 | 5.5 | 312.2 |
The MEF lines were also evaluated for expression of porin (Figure 2A). As these MnSOD transformant cells were derived from the same knockout (SOD2−/−) culture, no difference among the lines was expected with regard to porin expression. As shown in Figure 2A, the wild type and knockout MEF cells expressed similar levels of porin. However, porin expression was significantly less than WT in all three MnSOD ala transformants and in two of the three val transformants. Correction of MnSOD protein expression for porin expression in general did not change the pattern of differences of MnSOD protein level among the cell lines (compare Figures 2B and C). The exception was MnSOD-Val10 where the porin adjusted MnSOD protein level was similar to that observed in wild type and the ala 5 and 9 transformants.
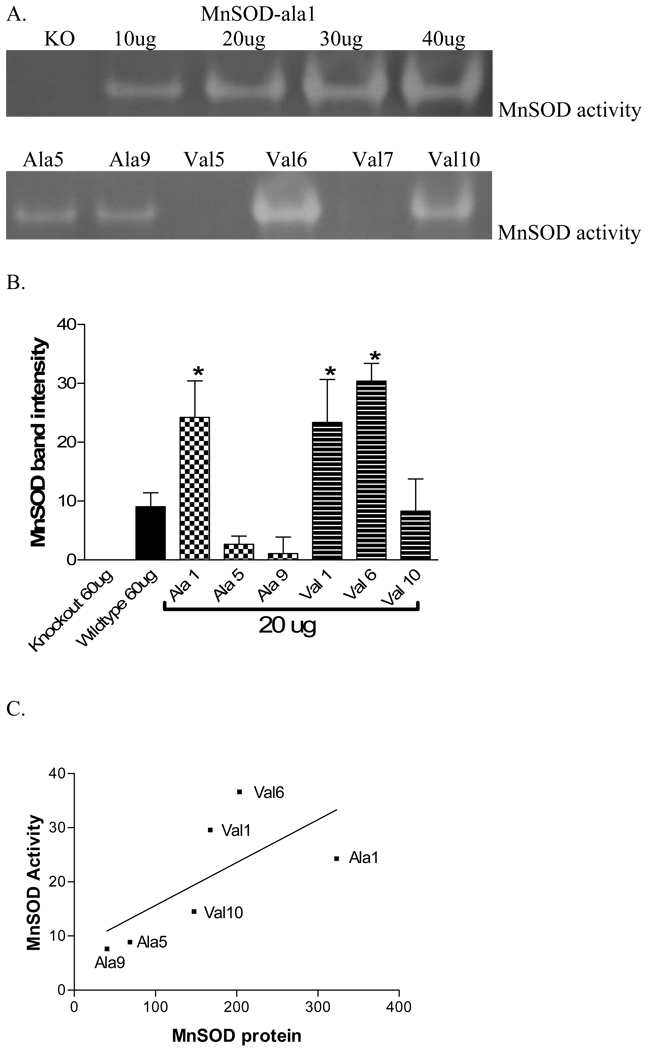
MnSOD enzymatic activity was assessed in the cell lines. The gel photos show that a clear band is present where there is MnSOD activity (Figure 3A, Table 1). While not strictly quantitative, the results from separate experiments were reproducible and, as shown by the upper gel in Figure 3, representative of the amount of MnSOD activity present. The lower gel is representative of the analysis of MnSOD activity in the cell lines. Figure 3B represents the quantitation of activity from three separate experiments and shows that among the transformants, MnSOD activity was significantly greater in ala1, val1 and val6 compared to the other lines. Except for val 10, this is similar to what was observed for MnSOD protein levels (Figure 2B). The graph of MnSOD activity and protein shown in Figure 3C indicates that there was a moderate correlation between the amount of MnSOD protein expressed and the amount of MnSOD activity (r2 = 0.46) in the MEF transformant cell lines.
Fig. 3. MnSOD activity in MEF transformant cell lines.
(a.) Representative SOD activity gels. The gel photos show that a clear band is present where there is MnSOD activity. Upper gel – Lane 1: Knockout MEF cells, Lane 2–5: MnSOD-ala1 at 10, 20, 30 and 40 µg total protein. Lower gel loaded with 20 µg total protein: Lane 1: MnSOD-ala5, Lane 2: MnSOD-ala9, Lane 3: MnSOD-val5 (no expression). Lane 4: MnSOD-val6, Lane 5: MnSOD-val7 (no expression), Lane 6: MnSOD-val10. (b.) Knockout and wildtype MEF lines were evaluated at 60 µg total cellular protein while all transformant lines used 20 µg total cellular protein. (*) Indicates significantly more MnSOD activity than MnSOD-ala5, MnSOD-ala9 and MnSOD-val10 (p<0.05). All lines except MnSOD-ala5 and MnSOD-ala9 had significantly more activity than the knockout line (p<0.05). Each bar represents the average of three experiments, ± SD. (c.) Correlation of MnSOD protein to MnSOD activity in MEF transformant cell lines. MnSOD activity determined using the in-gel assay (Fig. 3a) plotted as a function of MnSOD protein determined by Western blot (Fig. 1) for the 6 transformant cell lines (MnSOD-ala1, MnSODala5, MnSOD-ala9, MnSOD-val1, MnSOD-val6, MnSOD-val10) (r2=0.46)
MnSOD mRNA expression and copy number
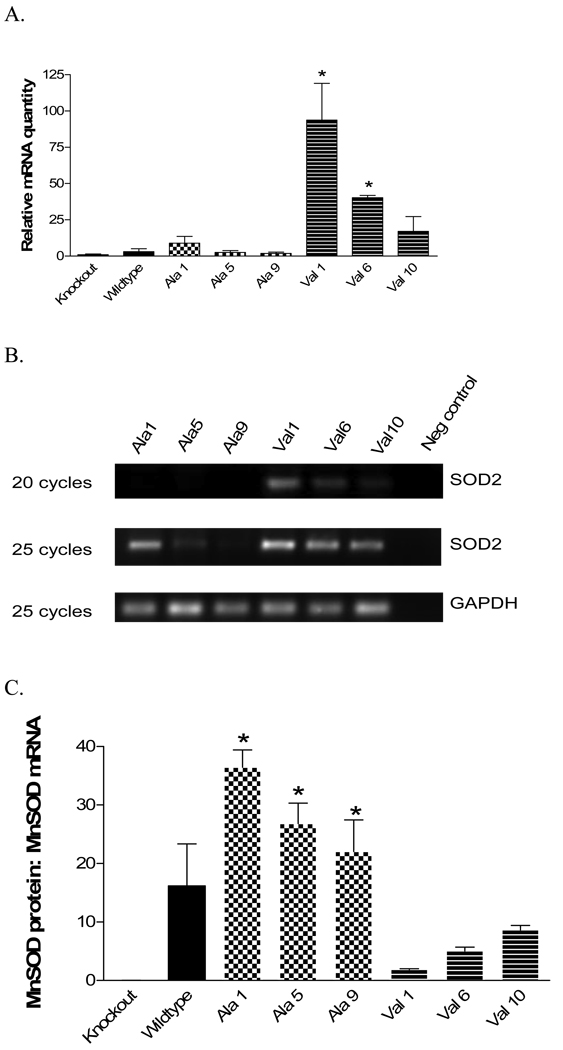
The MnSOD-val1 and MnSOD-val6 transformants expressed significantly (p<0.05) more MnSOD mRNA (almost 100 and 40 fold, respectively) than the other cell lines (Figure 4A, Table 1). The primers/probes purchased from Applied Biosystems amplify the boundary between exon 4 and exon 5. The disruption of MnSOD in the knockout animals is in exon 3. Thus, there was some PCR amplification of MnSOD in the knockout MEF cells, probably due to production of a shortened mRNA detectable by the primer/probe constructs used. Mouse GAPDH was also amplified as a control. No significant differences were seen among the MEF cell lines with regard to GAPDH expression (not shown).
Fig. 4. MnSOD mRNA expression.
MnSOD mRNA levels were quantified by TaqMan real-time PCR and reverse transcription PCR. (a.) Real-time PCR of MnSOD transformant cell lines. * Indicates significantly greater than other cell lines (p<0.05). Each bar represents the average of three independent determinations, ± SD. (b.) Amplification in exon 3 of MnSOD at either 20 or 25 cycles of PCR amplification. Bands are visible for all three MnSOD-val lines after 20 cycles and visible for all lines after 25 cycles. GAPDH was used as a loading control. (c.) MnSOD protein adjusted for MnSOD mRNA. The ratios of MnSOD protein determined by western blot (Fig 2b) to MnSOD mRNA levels determined by RT-PCR (Fig. 4a) is shown for the cell lines. * Indicates significantly different from the val lines, p<0.05
Reverse transcriptase PCR (RT-PCR) using primers within exon 3 (the knockout region) with mRNA isolated from each of the MEF cell lines was conducted to verify the real-time PCR results. The RT-PCR product was assessed in the linear range of amplification. After 20 cycles of PCR, bands were visible for the MnSOD-val lines but not in the MnSOD-ala lines (Figure 4B). After 25 cycles, amplification product was visible for all cell lines. GAPDH was also amplified as a loading control. These results provide confirmation of the real-time PCR finding that the MnSOD-val lines express greater MnSOD mRNA levels than the MnSOD-ala lines.
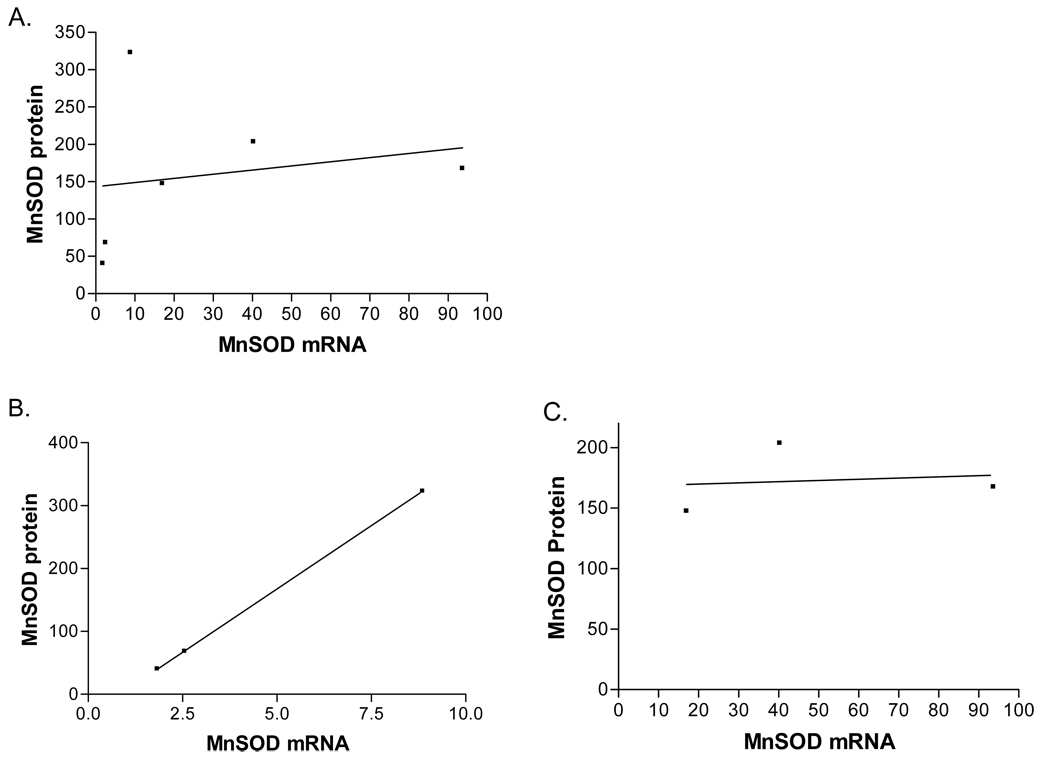
Next, the amount of MnSOD protein per unit mRNA was evaluated as an indication of the efficiency of protein production. Figure 4C shows the MnSOD protein to mRNA ratios for the various cell lines. The MnSOD-ala cell lines all express significantly more (p<0.05) MnSOD protein per unit mRNA than the MnSOD-val lines, suggesting an imbalance in protein production in the MnSOD-val lines. A strong correlation between MnSOD mRNA and protein levels in the MnSOD-ala cell lines was observed (r2=1.0, figure 5B). In contrast, the MnSOD-val lines did not show any correlation between mRNA and protein (r2=0.02, figure 5C). There was no overall correlation of MnSOD mRNA to MnSOD protein levels when all the transformant cell lines were included in the analysis (r2=0.04, figure 5A).
Fig. 5. Correlation of MnSOD mRNA to MnSOD protein in the transformant cell lines.
(a.)Overall correlation with all six transformant lines (r2=0.4). (b.) Correlation between MnSOD mRNA and MnSOD protein in the MnSOD-ala lines (r2=1.0). (c.) Correlation of MnSOD mRNA to MnSOD protein in the MnSOD-val lines (r2=0.02)
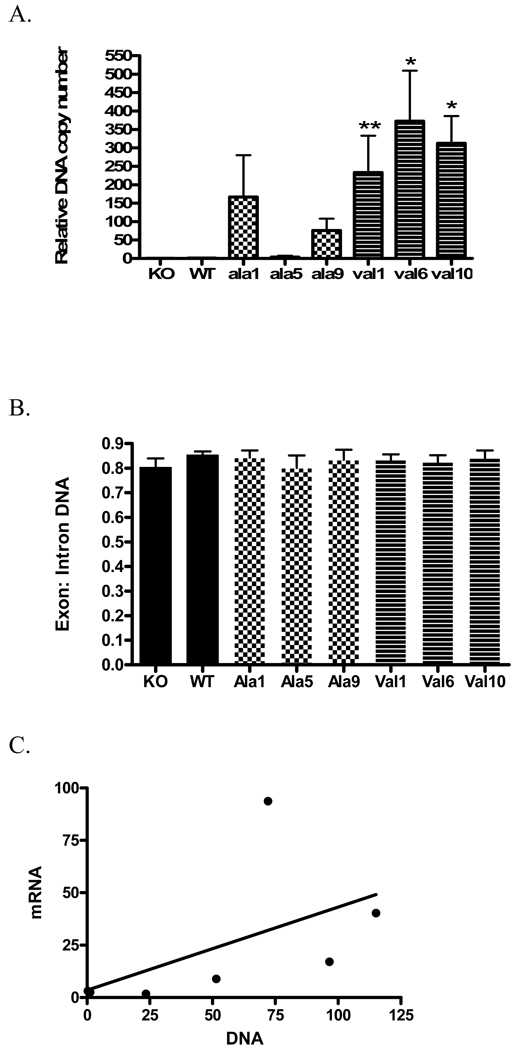
DNA copy number was determined using real-time PCR (Figure 6A, Table 1). With the exception of MnSOD-ala5, the MEF transformants had increased levels of MnSOD DNA compared to WT, with particularly high levels in the MnSOD-val lines. MnSOD-val10 and MnSOD-val6 had significantly more MnSOD DNA than the KO, WT, MnSOD-ala5 and MnSOD-ala9 lines (p<0.05). MnSOD-val1 had significantly more DNA copies than KO, WT, or MnSOD-ala5 (p<0.05) GAPDH was amplified by real-time PCR with primers both for an intron and exon region of the DNA. This control ensured that the RNA had been completely digested prior to amplification as well as provided a loading control. The amplification of GAPDH was very consistent among the cell lines (Figure 6B). DNA copy number did not correlate well to mRNA MnSOD expression levels (Figure 6C) with an r2=0.23, due to very high mRNA expression in the MnSOD-val1 cell line (see Figure 4A). However, when MnSOD-val1 is excluded from the analysis, the correlation between mRNA and DNA increases to r2=0.82.
Fig. 6. DNA copy number.
(A.) DNA copy number was normalized to WT levels. * Indicates significantly different than KO, WT, MnSOD-ala5, and MnSOD-ala9 (p<0.05). ** Indicates significantly different than KO, WT, and MnSOD-ala5 (p<0.05). (B.) DNA was amplified for GAPDH in an intron and exon region. No significant difference was found in GAPDH amplification between the cell lines. (C.) Correlation of mRNA expression to DNA copy number. Expression of MnSOD mRNA correlated to MnSOD DNA copy number (r2=0.29).
ROS Analysis
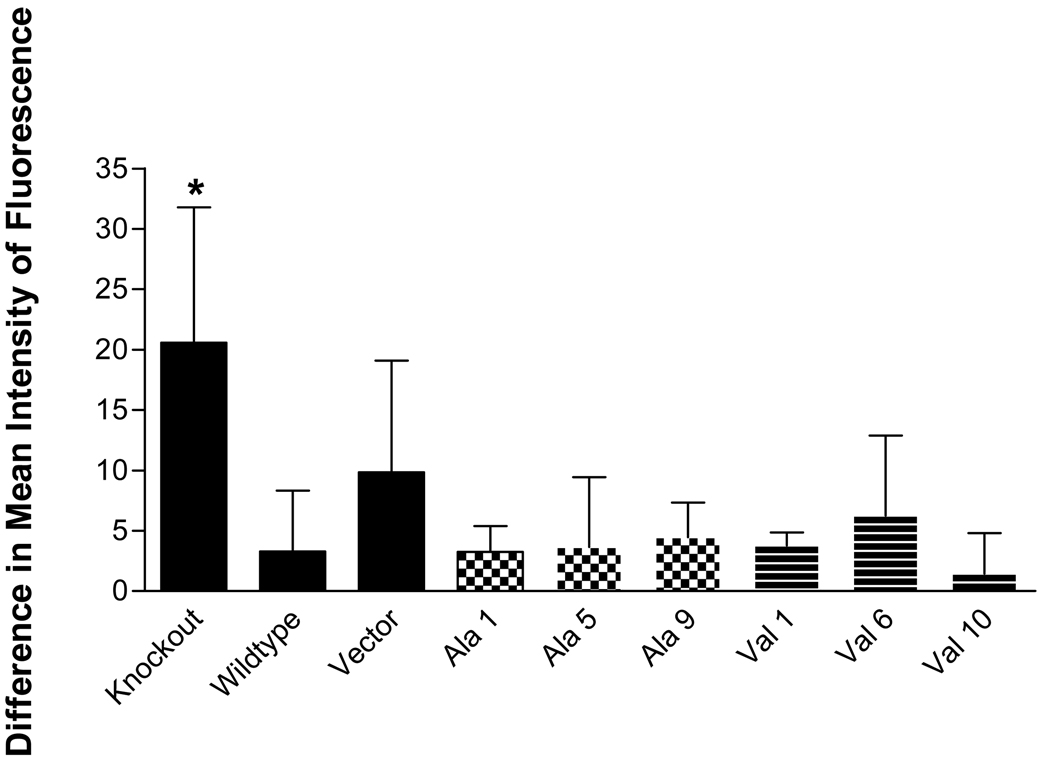
The relationship between the level of basal and induced ROS, represented by levels of superoxide, H2O2 and peroxynitrate, and the level of MnSOD expression in the MEF transformants was investigated. No dramatic effects of MnSOD expression or activity on the levels of these ROS species were observed. As seen in figure 7, H2O2 levels induced by antimycin A treatment tended to be greater in the KO (p<0.05) line compared to WT and the MnSOD transformants. However, among the transformants, there was no association between the level of MnSOD expression or activity and H2O2 level. Similarly, induction of superoxide by rotenone treatment did not result in significant differences among the transformant cell lines (data not shown). Peroxynitrate levels induced by treatment of the cells with GSNO showed no differences among the cell lines (data not shown).
Fig. 7. Measurement of hydrogen peroxide in MEF MnSOD−/− cells by flow cytometry.
H2O2 production in each of the cell lines following AA treatment compared to untreated cells. The difference between baseline and induced levels of H2O2 as assessed by CM-H2DCFCA fluorescence is shown. *The KO cell line produced significantly more H2O2 following AA treatment than WT, MnSOD-ala1, MnSOD-ala5, MnSOD-val1, and MnSOD-val10 (p<0.05). Each bar represents the average of three experiments, ± SD 1 A.
Discussion
The MnSOD ala16val polymorphism has been linked in a number of epidemiology studies to several human diseases including breast cancer [2, 6]. The results of studies of MnSOD activity and protein levels in endogenous and transfected systems have not been consistent. Several studies have examined the role of the polymorphism in isolated mitochondria or in cells transiently transfected with MnSOD [12–14], while additional studies have explored the effect of the polymorphism on endogenous MnSOD in intact cells [15, 16, 22]. To date, no studies have examined levels of MnSOD protein, activity or mRNA in human breast cells. Therefore, we investigated MnSOD protein, activity, and mRNA expression levels in several human breast epithelial cell lines.
We observed significantly more MnSOD protein and a significantly greater amount of MnSOD protein per unit mRNA in the ala/ala cell line, ZR-75-1, compared to two of the val/val cell lines, MCF-7 and T47D. While, overall, we did not see a clear correlation between MnSOD protein and the ala16val genotype in the breast epithelial cell lines, when pooled by genotype, there was significantly more MnSOD protein in the ala/ala cell lines compared to the val/val cell lines (Figure 1A). There were also increased amounts of MnSOD protein per unit MnSOD mRNA in the ala/ala cell lines that was nearly significant (p=0.08) (Figure 1E). Two of the ala/ala cell lines, HCC38 and ZR-75-1, had increased MnSOD: porin ratios and increased levels of MnSOD activity than the val/val cell lines, MCF-7 and T47D.
Estrogen, present in the serum used in the cell culture medium, has been shown to induce MnSOD expression via the estrogen receptor [23]. Among the six breast cell lines MDA-MB-231 [24], HCC-38 [25], and ZR-75-30 [26] are non-responsive to estrogen, while MCF-7 [27], T47D [28], and ZR-75-1 [26] are responsive to estrogen. Estrogen responsive breast cell lines were shown to be more sensitive to oxidative damage than estrogen non-responsive lines [29]. We observed that among the estrogen responsive lines, the ala/ala ZR-75-1 line had more MnSOD protein than the val/val, MCF-7 and T47D, lines. This suggests that estrogen responsiveness may influence the affect of the MnSOD polymorphism on MnSOD protein levels and deserves further investigation.
To further characterize the role of the ala16val polymorphism, we stably transfected the human MnSOD gene under CMV promoter control into MEF from the SOD2−/− mouse. Twenty cells lines (10 ala and 10 val) were produced by growth in zeocin. However, only 6 lines (3 ala and 3 val) had detectable levels of MnSOD protein expression. It is possible that the remaining lines did express MnSOD, albeit at very low/non-detectable levels. Alternatively, it is possible that the MnSOD gene was delected, while the Zeo gene was retained and expressed, allowing the cells to continue to grow in Zeocin. The cell lines developed provide a novel system for comparing the effects of the polymorphism and provide several advantages for studying the ala16val polymorphism. First, since the transformed cells are all from one SOD2−/− MEF line, they are genetically identical except for the human ala16val MnSOD gene, copy number, and point of insertion. Second, the endogenous MnSOD had been disrupted in the mice from which the MEF were derived, thus eliminating interference by endogenous MnSOD. And finally, the development of stable MnSOD transformants allows investigation of the effects of the ala and val polymorphisms on MnSOD without having to be concerned about differences in transfection efficiency from one experiment to the next as is the case when transient transformants are used.
Similar to the trend observed in the human breast epithelial cell lines, the MnSOD-val lines demonstrated an imbalance between mRNA and protein levels. This imbalance between mRNA and protein in the MnSOD-val cell lines, as evidenced by the decreased amount of MnSOD protein per unit mRNA and the lack of correlation between MnSOD protein and mRNA (figure 4C and figure 5), provides new insight into the ala16val polymorphism. The ala16val MnSOD polymorphism may be affecting protein stability in the MnSOD-val samples, which may require increased amounts of mRNA transcription in order to produce protein levels equivalent to that seen in the MnSOD-ala samples. A study by Sutton et al. [14] found that following treatment with a proteosome inhibitor, there was a slight increase in MnSOD-ala and a significant increase in MnSOD-val protein. Sutton et al. hypothesized that the MnSOD-val protein is not importing well or is becoming stuck in the IMM of the mitochondria and is subsequently being degraded by the proteasome. Other studies have found that mitochondrial preproteins that fail to properly import are subject to proteasomal degradation [30]. The imbalance we observed could also be due to the very high levels of MnSOD DNA in the MnSOD-val transformants as compared to wildtype (Table 1). The high levels of DNA may have produced more mRNA than could be effectively processed by the cell. However, a study by Zhang et al. showed that stable transfection of MnSOD into the human breast cancer line, MCF-7, resulted in the presence of MnSOD DNA that was associated with high levels of MnSOD protein production [31]. While the DNA copy number was not calculated, the results of PCR analysis show a very large increase in MnSOD DNA compared to wildtype levels [31]. It appears that in MCF-7 cells, large amounts of MnSOD protein can be produced following stable DNA transfection.
This model was then employed to explore ROS levels in the MnSOD transformant cell lines. No differences in baseline or induced levels of superoxide, hydrogen peroxide, or peroxynitrate were detected in the cell lines. This is contrary to our hypothesis that increased levels of MnSOD would result in decreased levels of superoxide. It is possible that the levels of ROS induced in the cell lines were not sufficient to overwhelm the MnSOD present, thereby preventing the detection of any difference in ROS due to the polymorphism. Also, in this model, the MEF were stably transfected with MnSOD and cultured for several months allowing sufficient time for the cells to adapt to increased levels of MnSOD. Several papers have reported that cells that stably overexpress MnSOD may adapt to this condition by increasing levels of catalase or glutathione peroxidase in order to compensate for the increased levels of H2O2, or by decreasing Cu/ZnSOD activity to decrease H2O2 production. In some studies, different clones from the same transfection have very different ROS profiles because some have adapted to increased MnSOD, while others have not [32–34]. Studies of Cu/ZnSOD overexpression have also demonstrated the capacity of cells to adapt by altering levels of other antioxidant proteins [35, 36]. One additional study failed to find any difference in H2O2 production in untreated cells that overexpress MnSOD [37]. In order to determine if these cell lines have adapted to their level of MnSOD, the levels of protein and activity for GPX, Cu/ZnSOD, and catalase would need to be assessed. It would also be interesting to measure levels of reduced and oxidized glutathione (GSH and GSSG respectively) to further characterize the redox environment of these cell lines. Future studies to assess levels/activity of these other antioxidant proteins are needed to better characterize cellular redox status.
While MnSOD has long been considered a tumor suppressor gene, recent studies have found increased expression of MnSOD in some tumor types. MnSOD overexpression has been reported in oral, breast, colorectal, esophageal [38], gastric cancer [39] and mesothelioma [40]. High MnSOD expression correlates with high tumor grade in malignant melanoma [41], breast carcinoma [42], and colorectal carcinoma [43]. This increased expression appears to increase the ability of the cancer cells to metastasize and inhibits apoptosis [38, 44]. In order to metastasize, cancer cells must first escape the extracellular matrix (ECM). Increased MnSOD activity has been shown increase matrix metalloproteinases expression and increase levels of H2O2, which leads to increased invasiveness [45–48]. In colorectal cancer cells, MnSOD over expression has been shown to lead to metastasis by allowing the cells to avoid tumor necrosis factor-related apoptosis-inducing ligand (TRAIL)-induced apoptosis [44]. Activating protein 2 (AP-2) is a negative regulator of MnSOD and the absence of AP-2 in aggressive cancer cells has been linked to increased levels of MnSOD [49]. High levels of MnSOD have also been correlated to p53 dysfunction and decreased sensitivity to chemotherapy or radiation treatment in several studies [49–53]. Additionally, ROS produced by MnSOD may block apoptosis by blocking poly(ADP-ribose) polymerase (PARP) cleavage [54]. In this study, we found that MnSOD ala, which has been suggested as a risk factor for several types of cancer, may import more efficiently to the mitochondrial matrix, allowing more protein expression compared to MnSOD-val. It appears that there are several mechanisms connecting MnSOD expression, apoptosis, and metastasis and understanding of these pathways will require further study.
The allele frequency of the alanine allele ranges from ~50% in American Caucasians [2] to 14% in Asian populations [55]. Any increase in disease risk due to this polymorphism therefore may have a significant impact on disease burden within the population. While several epidemiology studies have found an increase in risk associated with the polymorphism [2, 3], a clear mechanism in situ has not been found. While there were differences among the MEF transformant cell lines in the expression of MnSOD, a consistent finding was a possible imbalance between mRNA and protein levels associated with the MnSOD ala16val polymorphism. However, more research will be needed to further character the effect of this polymorphism. Future studies are needed to determine the role of this polymorphism in cellular redox balance and carcinogenesis.
Acknowledgements
This research was supported by NIH grants T32ESO7141 and R03CA94747 and center grant P30ES03819.
Abbreviations
- Ala
alanine
- ETS
electron transport chain
- MnSOD
Manganese superoxide dismutase
- MEF
Mouse embryonic fibroblasts
- MTS
Mitochondrial targeting signal
- Val
valine
References
- 1.Montano M, et al. Association between manganese superoxide dismutase (MnSOD) gene polymorphism and elderly obesity. Mol Cell Biochem. 2009 doi: 10.1007/s11010-009-0071-z. Epub ahead of print. [DOI] [PubMed] [Google Scholar]
- 2.Ambrosone CB, et al. Manganese Superoxide Dismutase (MnSOD) Genetic Polymorphisms, Dietary Antioxidants, and Risk of Breast Cancer. Cancer Research. 1999;59(3):602–606. [PubMed] [Google Scholar]
- 3.Mitrunen K, et al. Association between manganese superoxide dismutase (MnSOD) gene polymorphism and breast cancer risk. Carcinogenesis. 2001;22(5):827–829. doi: 10.1093/carcin/22.5.827. [DOI] [PubMed] [Google Scholar]
- 4.Kocabas NA, et al. Genetic polymorphism of manganese superoxide dismutase (MnSOD) and breast cancer susceptibility. Cell Biochemistry and Function. 2005;23(1):73–76. doi: 10.1002/cbf.1128. [DOI] [PubMed] [Google Scholar]
- 5.Mollsten A, et al. A functional polymorphism in the manganese superoxide dismutase gene and diabetic nephropathy. Diabetes. 2007;56:265–269. doi: 10.2337/db06-0698. [DOI] [PubMed] [Google Scholar]
- 6.Kang D, et al. Functional variant of manganese superoxide dismutase (SOD2 V16A) polymorphism is associated with prostate cancer risk in the prostate, lung, colorectal, and ovarian cancer study. Cancer Epidemiol Biomarkers Prev. 2007;16(8):1581–1586. doi: 10.1158/1055-9965.EPI-07-0160. [DOI] [PubMed] [Google Scholar]
- 7.Ezzikouri S, et al. Genetic polymorphims in the manganese superoxide dismutase gene is associated with an increased risk for hepatocellular carcinoma in HCV-infected Moroccan patients. Mutation Research. 2008;649(1–2):1–6. doi: 10.1016/j.mrgentox.2007.05.019. [DOI] [PubMed] [Google Scholar]
- 8.Zejnilovic J, et al. Association between manganese superoxide dismutase polymorphism and risk of lung cancer. Cancer Genet Cytogenet. 2009;189(1):1–4. doi: 10.1016/j.cancergencyto.2008.06.017. [DOI] [PubMed] [Google Scholar]
- 9.Liu L, et al. The manganese superoxide dismutase Val16Ala polymorphism is associated with decreased risk of diabetic nephropathy in Chinese patients with type 2 diabetes. Mol Cell Biochem. 2009;322(1–2):87–91. doi: 10.1007/s11010-008-9943-x. [DOI] [PubMed] [Google Scholar]
- 10.Bica C, et al. MnSOD Gene Polymorphism Association with Steroid-Dependent Cancer. Pathol Oncol Res. 2008 doi: 10.1007/s12253-008-9064-6. Epub ahead of print. [DOI] [PubMed] [Google Scholar]
- 11.Shimoda-Matsubayashi S, et al. Structural dimorphism in the mitochondrial targeting sequence in the human manganese superoxide dismutase gene. Biochemical and Biophysical Research Communications. 1996;226:561–565. doi: 10.1006/bbrc.1996.1394. [DOI] [PubMed] [Google Scholar]
- 12.Hiroi S, et al. Polymorphisms in the SOD2 and HLA-DRB1 Genes Are Associated with Nonfamilial Idiopathic Dilated Cardiomyopathy in Japanese. Biochemical and Biophysical Research Communications. 1999;261(2):332–339. doi: 10.1006/bbrc.1999.1036. [DOI] [PubMed] [Google Scholar]
- 13.Sutton A, et al. The Ala16Val genetic dimorphism modulates the import of human manganese superoxide dimutase into rat liver mitochondria. Pharmacogenetics. 2003;13:145–157. doi: 10.1097/01.fpc.0000054067.64000.8f. [DOI] [PubMed] [Google Scholar]
- 14.Sutton A, et al. The manganese superoxide dismutase Ala16Val dimorphism modulates both mitochondrial import and mRNA stability. Pharmacogenetics & Genomics. 2005;15(5):311–319. doi: 10.1097/01213011-200505000-00006. [DOI] [PubMed] [Google Scholar]
- 15.Kinnula VL, et al. Ultrastructural and Chromosomal Studies on Manganese Superoxide Dismutase in Malignant Mesothelioma. American Journal of Respiratory Cell and Molecular Biology. 2004;31(2):147–153. doi: 10.1165/rcmb.2003-0409OC. [DOI] [PubMed] [Google Scholar]
- 16.Elsakka NE, Webster NR, Galley HF. Polymorphism in the manganese superoxide dismutase gene. Free Radical Research. 2007;41(7):770–778. doi: 10.1080/10715760701338828. [DOI] [PubMed] [Google Scholar]
- 17.Li Y, et al. Dilated cardiomyopathy and neonatal lethality in mutant mice lacking manganese superoxide dismutase. 1995;11(4):376–381. doi: 10.1038/ng1295-376. [DOI] [PubMed] [Google Scholar]
- 18.Bradford MM. A rapid and sensitive method for the quantitation of microgram quantities of protein utilizing the principle of protein-dye binding. Analytical Biochemistry. 1976;72:248–254. doi: 10.1016/0003-2697(76)90527-3. [DOI] [PubMed] [Google Scholar]
- 19.Flohe L, Otting F. In: Methods in Enzymology: Oxygen Radicals in Biological Systems. Packer L, editor. New York: Academic Press; 1984. pp. 93–104. [Google Scholar]
- 20.MacMillan-Crow L, et al. Nitration and inactivation of manganese superoxide dismutase in chronic rejection of human renal allografts. PNAS. 1996;93(21):11853–11858. doi: 10.1073/pnas.93.21.11853. [DOI] [PMC free article] [PubMed] [Google Scholar]
- 21.Hanson B, et al. Cytochrome c Oxidase-deficient Patients Have Distinct Subunity Assembly Profiles. Journal of Biological Chemistry. 2001;276(19):16296–16301. doi: 10.1074/jbc.M011162200. [DOI] [PubMed] [Google Scholar]
- 22.Bastaki M, et al. Genotype-activity relationship for Mn-superoxide dismutase, glutathione peroxidase 1 and catalase in humans. Pharmacogenetics and Genomics. 2006;16:279–286. doi: 10.1097/01.fpc.0000199498.08725.9c. [DOI] [PubMed] [Google Scholar]
- 23.Vina J, et al. Part of the Series: From Dietary Antioxidants to Regulators in Cellular Signaling and Gene ExpressionRole of reactive oxygen species and (phyto)oestrogens in the modulation of adaptive response to stress. Free Radical Research. 2006;40(2):111–119. doi: 10.1080/10715760500405778. [DOI] [PubMed] [Google Scholar]
- 24.Rochefort H, et al. How to target estrogen receptor-negative breast cancer? Endocrine Related Cancer. 2003;10(2):261–266. doi: 10.1677/erc.0.0100261. [DOI] [PubMed] [Google Scholar]
- 25.Boyan BD, et al. Estrogen-Dependent Rapid Activation of Protein Kinase C in Estrogen Receptor-Positive MCF-7 Breast Cancer Cells and Estrogen Receptor-Negative HCC38 Cells Is Membrane-Mediated and Inhibited by Tamoxifen. Endocrinology. 2003;144(5):1812–1824. doi: 10.1210/en.2002-221018. [DOI] [PubMed] [Google Scholar]
- 26.Shyu R, et al. Expression and regulation of retinoid-inducible gene 1 (RIG1) in breast cancer. Anticancer Research. 2005;25(3c):2453–2460. [PubMed] [Google Scholar]
- 27.Greene G, Press M. Structure and dynamics of the estrogen receptor. Journal of Steroid Biochemistry. 1986;24(1):1–7. doi: 10.1016/0022-4731(86)90024-5. [DOI] [PubMed] [Google Scholar]
- 28.Rochefort H, et al. Steroidal and nonsteroidal antiestrogens in breast cancer cells in culture. Journal of Steroid Biochemistry. 1984;20(1):105–110. doi: 10.1016/0022-4731(84)90196-1. [DOI] [PubMed] [Google Scholar]
- 29.Mobley JA, Brueggemeier RW. Estrogen receptor-mediated regulation of oxidative stress and DNA damage in breast cancer. Carcinogenesis. 2004;25(1):3–9. doi: 10.1093/carcin/bgg175. [DOI] [PubMed] [Google Scholar]
- 30.Wright G, et al. Oxidative Stress Inhibits the Mitochondrial Import of Preproteins and Leads to Their Degradation. Experimental Cell Research. 2001;263(1):107–117. doi: 10.1006/excr.2000.5096. [DOI] [PubMed] [Google Scholar]
- 31.Zhang HJ, et al. Comparison of Effects of Two Polymorphic Variants of Manganese Superoxide Dismutase on Human Breast MCF-7 Cancer Cell Phenotype. Cancer Res. 1999;59(24):6276–6283. [PubMed] [Google Scholar]
- 32.Li N, Zhai Y, Oberley TD. Two distinct mechanisms for inhibition of cell growth in human prostate carcinoma cells with antioxidant enzyme imbalance. Free Radical Biology and Medicine. 1999;26(11–12):1554–1568. doi: 10.1016/s0891-5849(99)00024-6. [DOI] [PubMed] [Google Scholar]
- 33.Li N, et al. Overexpression of manganese superoxide dismutase in DU145 human prostate carcinoma cells has multiple effects on cell phenotype. The Prostate. 1998;35(3):221–233. doi: 10.1002/(sici)1097-0045(19980515)35:3<221::aid-pros8>3.0.co;2-j. [DOI] [PubMed] [Google Scholar]
- 34.Li N, et al. Inhibition of cell growth in NIH/3T3 fibroblasts by overexpression of manganese superoxide dismutase: Mechanistic studies. Journal of Cellular Physiology. 1998;175(3):359–369. doi: 10.1002/(SICI)1097-4652(199806)175:3<359::AID-JCP14>3.0.CO;2-0. [DOI] [PubMed] [Google Scholar]
- 35.Kelner M, Bagnell R. Alteration of endogenous glutathione peroxidase, manganese superoxide dismutase, and glutathione transferase activity in cells transfected with a copper-zinc superoxide dismutase expression vector Explanation for variations in paraquat resistance. J. Biol. Chem. 1990;265(19):10872–10875. [PubMed] [Google Scholar]
- 36.Kelner MJ, et al. Transfection with human copper-zinc superoxide dismutase induces bidirectional alterations in other antioxidant enzymes, proteins, growth factor response, and paraquat resistance. Free Radical Biology and Medicine. 1995;18(3):497–506. doi: 10.1016/0891-5849(94)00167-i. [DOI] [PubMed] [Google Scholar]
- 37.Melendez JA, et al. Nitric Oxide Enhances the Manganese Superoxide Dismutase-dependent Suppression of Proliferation in HT-1080 Fibrosarcoma Cells. Cell Growth Differ. 1999;10(9):655–664. [PubMed] [Google Scholar]
- 38.Hu H, et al. Up-regulated manganese superoxide dismutase expression increases apoptosis resistance in human esophogeal squamous cell carcinomas. Chin Med J. 2007;120(23):2092–2098. [PubMed] [Google Scholar]
- 39.Malafa M, et al. MnSOD expression is increased in metastatic gastric cancer. J Surg Res. 2000;88(2):130–134. doi: 10.1006/jsre.1999.5773. [DOI] [PubMed] [Google Scholar]
- 40.Markland S, et al. Copper- and zinc-containing superoxide dismutase, manganese-containing superoxide dismutase, catalse and glutathione peroxidase in normal and neoplastic human cell lines and normal human tissues. Cancer Res. 1982;42:1955–1961. [PubMed] [Google Scholar]
- 41.Schadendorf D, et al. Serum manganese superoxide dismutase is a new tumour marker for malignant melanoma. Melanoma Res. 1995;5:351–353. doi: 10.1097/00008390-199510000-00008. [DOI] [PubMed] [Google Scholar]
- 42.Tsanou E, et al. Immunohistochemical expression of superoxide dismutase (MnSOD) anti-oxidant enzyme in invasive breast carcinoma. Histol Histopathol. 2004;19(3):807–813. doi: 10.14670/HH-19.807. [DOI] [PubMed] [Google Scholar]
- 43.Nozoe T, et al. Significance of immunohistochemical expression of manganese superoxide dismutase as a marker of malignant potential in colorectal carcinoma. Oncol Rep. 2003;10(1):39–43. [PubMed] [Google Scholar]
- 44.Mohr A, et al. MnSOD protects colorectal cancer cells from TRAIL-induced apoptosis by inhibition of Smac/DIABLO release. Oncogene. 2008;27:763–774. doi: 10.1038/sj.onc.1210673. [DOI] [PubMed] [Google Scholar]
- 45.Wenk J, et al. Stable overexpression of manganese superoxide dismutase in mitochondria identifies hydrogen peroxide as a major oxidant in the AP-1-mediated induction of matrix adenocarcinoma cells. Clin Cancer Res. 1999;5:119–127. doi: 10.1074/jbc.274.36.25869. [DOI] [PubMed] [Google Scholar]
- 46.Zhang HJ, et al. Activation of Matrix Metalloproteinase-2 by Overexpression of Manganese Superoxide Dismutase in Human Breast Cancer MCF-7 Cells Involves Reactive Oxygen Species. Journal of Biological Chemistry. 2002;277(23):20919–20926. doi: 10.1074/jbc.M109801200. [DOI] [PubMed] [Google Scholar]
- 47.Takada Y, et al. Role of Reactive Oxygen Species in Cells Overexpressing Manganese Superoxide Dismutase: Mechanism for Induction of Radioresistance. Mol Cancer Res. 2002;1(2):137–146. [PubMed] [Google Scholar]
- 48.Connor KM, et al. Mitochondrial H2O2 Regulates the Angiogenic Phenotype via PTEN Oxidation 10.1074/jbc.M410690200. J. Biol. Chem. 2005;280(17):16916–16924. doi: 10.1074/jbc.M410690200. [DOI] [PubMed] [Google Scholar]
- 49.Xu Y, et al. Mutations in the SOD2 promoterr reveal a molecular basis for an activating protein 2 - dependent dysregulation of manganese superoxide dismutase expression in cancer cells. Mol Cancer Res. 2008;6(12):1881–1893. doi: 10.1158/1541-7786.MCR-08-0253. [DOI] [PMC free article] [PubMed] [Google Scholar]
- 50.Nakano T, Oka K, Taniguchi N. Manganese superoxide dismutase expression correlates with p53 status and local recurrence of cervical carcinoma treated with radiation therapy. Cancer Res. 1996;56:2771–2775. [PubMed] [Google Scholar]
- 51.Zhao Y, Chaiswing L, Velez J. p53 translocation to mitochondria precedes its nuclear translocation and targets mitochondrial oxidative defense protein-manganese superoxide dismutase. Cancer Res. 2005;65:3745–3750. doi: 10.1158/0008-5472.CAN-04-3835. [DOI] [PubMed] [Google Scholar]
- 52.Behrend L, et al. Manganese superoxide dismutase induces p53-dependent senescence in colorectal cancer cells. Molecular and cellular biology. 2005;25(17):7758–7769. doi: 10.1128/MCB.25.17.7758-7769.2005. [DOI] [PMC free article] [PubMed] [Google Scholar]
- 53.Pani G, Colavitti R, Bedogni B. Mitochondrial superoxide dismutase: a promising target for new anticancer therapies. Curr Med Chem. 2004;11:1299–1308. doi: 10.2174/0929867043365297. [DOI] [PubMed] [Google Scholar]
- 54.Kiningham KK, et al. Overexpression of manganese superoxide dismutase protects against mitochondrial-initiated poly(ADP-ribose) polymerase-mediated cell death. FASEB J. 1999;13(12):1601–1610. doi: 10.1096/fasebj.13.12.1601. [DOI] [PubMed] [Google Scholar]
- 55.Cai Q, et al. Genetic polymorphism in the manganese superoxide dismutase gene, antioxidant intake, and breast cancer risk: results from the Shanghai Breast Cancer Study. Breast Cancer Research. 2004;6(6):R647–R655. doi: 10.1186/bcr929. [DOI] [PMC free article] [PubMed] [Google Scholar]


