

Abstract
Q-Sweat, a commercial quantitative sweat measurement system, is modeled on Quantitative Sudomotor Axon Reflex Testing (QSART). The current study investigated the sweat response using Q-Sweat and Mayo-QSART recordings under identical conditions in healthy normal controls. Ninety-four participants were recruited for this study. All participants underwent randomized bilateral QSART recordings over the four standard recording regions. For both men and women, Wilcoxon signed rank tests of paired differences showed significantly lower volumes at each of the four sites for Q-Sweat vs. Mayo-QSART. Linear regression analysis was used to estimate the relationship between Q-Sweat and Mayo-QSART volume measurements separately for men and women. Although there was variability about the regression lines, these fitted models can be used to estimate the expected Mayo-QSART volume given an observed Q-Sweat volume, although it is preferable to use the Q-Sweat normative database directly. We hypothesize that the constant current generator used in conjunction with Q-Sweat provides a less efficient iontophoresis of acetylcholine than the Mayo-constructed constant current stimulator and results in lower volumes.
Keywords: QSART, Q-Sweat, Autonomic Testing, Autonomic Function, Sudomotor
Introduction
The quantitative sudomotor axon reflex test (QSART) has been a routine postganglionic sudomotor function (HCFA 95923) clinical laboratory test of the Mayo Clinic since 1983. QSART is a test designed to evaluate the integrity of the postganglionic sympathetic axons.5 At regional test sites, multi-compartmental sweat cells are attached to the limbs.5 Axon terminals are stimulated by the iontophoresis of acetylcholine (ACh) to one compartment, and the sweat response is recorded from a separate compartment. Typically, four regions are studied (1 on forearm and 3 on the leg). In a previously published study, a comparison of the difference between the right and left side showed no overall significant side-to-side difference.6
The Q-Sweat (Quantitative Sweat Measurement System, WR Medical Electronics Co., Stillwater, MN) is a patented commercially available version of the autonomic lab first described by Low et al. (1983).5 It was FDA approved in 2001 and introduced into the marketplace shortly afterwards; it is now widely used in the United States. New technologies, described in more detail in the method section, used in the Q-Sweat device were intended to make the device more reliable, reproducible and easier to use, operate, and maintain.
A large normative database of 376 participants of both genders aged from 10 to 83 years of age has been reported6 and is relied upon by clinicians and researchers for the interpretation of Q-Sweat responses. Since the introduction of the Q-Sweat device, researchers have reported lower sweat volumes in normal participants when compared to the current QSART normal database.4, 5, 6 The reason for the disagreement is not certain, since Q-Sweat devices must pass calibration verification at 1, 3, and 5 microliters of distilled water before leaving the factory for field use.
The current study was designed to give a formal comparison that evaluated whether Q-Sweat records sweat volume with fidelity and is quantitatively the same as Mayo-QSART.
Materials and Methods
Participants
With the approval of the Mayo Foundation Institutional Review Board, we investigated 94 healthy volunteers (men=44, women=50) free of autonomic disorders and not taking medications; exceptions were made for those taking daily vitamins and oral contraceptives. All participants were recruited from the Autonomic Disorders Center database of healthy volunteers; all medical records were screened and found to be free of neurological diseases or injuries that may affect the post ganglionic sudomotor system. In addition, all participants had to have a normal Autonomic Reflex Screen (within 2 years) prior to being enrolled in this study. Median age at the time of Q-Sweat was 48 years for men (range 19 to 78) and 28 years for women (range 18 to 65). Participants were asked to provide ethnicity and race information on a volunteer basis. Values are reported in Table 1. All participants received reimbursement for their time and participation.
Table 1.
Subject characteristics overall and by gender.
| Characteristic | Overall | Men | Women |
|---|---|---|---|
| Number of participants | 94 | 44 | 50 |
| Age at the time of Q-sweat, years | |||
| Median (IQR) | 34 (21, 54) | 48 (22, 62) | 28 (21, 44) |
| Range | 18 to 78 | 19 to 78 | 18 to 65 |
| Height, cm | |||
| Median (IQR) | 171 (163, 180) | 180 (174, 185) | 163 (159, 170) |
| Range | 147 to 198 | 156 to 198 | 147 to 180 |
| Weight, kg | |||
| Median (IQR) | 73 (61, 84) | 82 (75, 91) | 62 (56, 68) |
| Range | 50 to 118 | 63 to 118 | 50 to 93 |
| Body mass index (BMI), kg/m2 | |||
| Median (IQR) | 24 (22, 27) | 25 (24, 29) | 23 (21, 26) |
| Range | 17 to 41 | 20 to 41 | 17 to 38 |
| Ethnicity | |||
| Hispanic or Latino | 2 | 1 | 1 |
| Non-Hispanic nor Latino | 87 | 40 | 47 |
| Unknown/missing | 5 | 3 | 2 |
| Race | |||
| White | 88 | 41 | 47 |
| Black | 3 | 0 | 3 |
| Asian | 1 | 1 | 0 |
| American Indian | 1 | 1 | 0 |
| More than 2 races | 0 | 0 | 0 |
| Unknown/missing | 1 | 1 | 0 |
IRQ, interquartile range; BMI, body mass index
Materials and Procedures
All studies were completed in the Autonomic Disorders Center at the Mayo Clinic in Rochester, MN with the participant supine. Room temperature and humidity were controlled at 23°C and 25-35%, respectively. Participants were randomized by side tested (right versus left). All recordings for each device were performed on the same side of the body (i.e., one device went on the left side and the other device on the right side). Participants underwent bilateral routine Mayo-QSART and Q-Sweat recordings using the standard regional sites (forearm, proximal leg, distal leg, and foot). All regional test sites utilized the previously described cleaning procedure:5 acetone, alcohol, and water followed by thorough drying. Recordings were done consecutively on the same day in 88/94 participants and within 20 days in the remaining 6 participants (median time between testing was 9.5 days, range 3-20 days). The testing order was randomized to cancel out carry over and order effects. When regional limb temperatures were below 30.0°C, limbs were warmed with a servo-controlled heat lamp to no more than 33.5 °C to ensure adequate blood flow while simultaneously remaining below limb sweating threshold.7,8 Skin temperature measurements were recorded using a digital infrared temperature scanner (model OS91, Omega Engineering Inc, Stamford, CT). ACh solution (10% w/v) was used as the reagent to evoke the QSART response. All participants were asked to rate their perceived level of discomfort to the constant current stimulation (2mA for 5 min) using an 11-point visual analog scale (VAS), where 0 = no pain or discomfort and 10 = most severe pain or discomfort, for both sets of recordings.
Mayo-QSART Recordings
A full description of the device setup to measure QSART has been published.4,5,8 Briefly, nitrogen gas is channeled through the sudorometer then into the multi-compartmental sweat cell, where the thermal mass of the gas is changed as sweating occurs. The nitrogen is then channeled back into the sudorometer where the thermal changes are calculated, compared, and displayed on a computer screen. The constant current generator was designed and developed by the Mayo Clinic section of bioengineering in Rochester, MN.
Q-Sweat Recordings
A full description of the WR Medical Electronics Co. Q-Sweat device can be obtained from the manufacturer. Briefly, the Q-Sweat device uses a dessicant pack (#5190, WR Medical Electronics Co., Stillwater, MN) as its dry air source. Room air is drawn in through an intake pump and channeled through a serpentine of drierite (W.A. Hammond Company, Xenia, OH). This air is then passed through a set of sensors (Honeywell International Inc, Morristown, NJ) which controls the flow rate, preset to 60 standard cubic cm per minute. The sensors evaluate the temperature and percent relative humidity. Finally, the dried air is delivered to the capsule assembly (known as the multi-compartmental sweat cell) applied to the regional skin site. Moisture released from the human eccrine sweat gland is picked up by the dried room air and returned to the main unit of the device via Teflon-lined Tygon tubing. Once again, sensors evaluate the temperature and percent relative humidity along with flow rate. These values are compared against baseline (initial) values and integrated using the vapor pressure calculation for water between 0 and 50°C.1 Sweat rate, expressed as nanoliters per minute, is then displayed in the TestWorks software (WR Medical Electronics Co., Stillwater, MN). Life-Tech, Inc. (Stafford, TX) provides an FDA approved commercial constant current stimulator, the Iontophor® II (Model 6111PM/DX), that is commonly used in conjunction with the Q-Sweat.
Multi-compartmental sweat cells
The multi-compartmental sweat cells used for sweat collection in Q-Sweat and Mayo-QSART are identical in area, measuring 0.119 in2. Minor differences in other size calculations within the sweat cells were found, but none would contribute to the magnitude difference found within the recordings. Further evaluation found all differences to be within manufacturing tolerance for the specific measurement.
Analysis of QSART recordings
Recordings of both volume and latency for the Mayo-QSART and Q-Sweat obtained followed a standard procedure. All latency measurements were obtained by finding the time from the “on” of the stimulators until a noticeable sweat rate change occurred; the time is expressed in minutes. Volume measurements were made by integrating 10 minutes of the recording. The initial marker used for the volume measurement is the same one used to mark the start of the latency response. The second marker is placed 10 minutes afterwards, and the area is integrated to give a volume measurement in microliters/10 minutes.
Statistics
We performed all analyses separately for men and women due to expected gender differences in the nature of the sudomotor response. At each of the four sites, we evaluated whether there were systematic differences in temperature, latency, or volume using two-sided Wilcoxon signed rank tests of the paired differences. These differences were expressed as the QSART value minus the Q-Sweat value. Discomfort was evaluated using a two-sided Wilcoxon signed rank test based on the paired differences in discomfort levels for each device. We estimated agreement on temperature, latency, and volume at each site by calculating the intraclass correlation coefficient (ICC) using a one-way random effects model based on the rank-transformed data. With this model, total variability in the rank ordering of the participants can be partitioned into participant-to-participant variability and device variability. The ICC can therefore be interpreted as the proportion of total variability in the rank ordering of the subjects that is due to participant-to-participant variability. When the ICC is near one, most of the variability in the data is due to differences in participants, whereas when the ICC is near zero, most of the variability is due to differences in the devices.
We estimated the relationship between Mayo-QSART and Q-Sweat at each site with a linear regression model utilizing the HC4-type heteroskedasticity consistent covariance matrix (HCCM) which adjusts standard errors to account for increasing variability at higher measurements.2 In order to assess whether prediction of QSART volumes could be improved by taking into account other variables, we modeled the expected Mayo-QSART volume as a function of Q-Sweat volume, age, body mass index (BMI), temperature at the site, and latency at the site. To obtain a parsimonious model, we used backwards stepwise elimination with criteria for retention set at P=0.10 using the HCCM. No adjustments for multiple comparisons were made.10,11
We used the intraclass kappa statistic to asses the agreement between the two methods in terms of classifying patients as normal or abnormal according to the published norms table.4
This method was used over simple percent agreement since kappa takes into account the agreement that occurs by chance. All analyses were performed using R version 2.8.1 software.13
Results
Participant demographics are summarized in Table 1. Women in this study tended to be younger than men (median age of 28 vs. 48 years, P<0.001) although age ranges were comparable. Based on within-subject paired differences, skin temperatures differed significantly between Mayo-QSART and Q-Sweat only at the distal leg among women, although this median difference of 0.1°C was not considered to be clinically meaningful. For both men and women, latency was shorter for Mayo-QSART at all sites except for the distal leg. Median paired differences ranged from 0.1 to 0.4 minutes shorter for Mayo-QSART. Volume was significantly greater with the Mayo-QSART for both men and women at all sites. Median differences ranged from 1.8 μL for men in the forearm to 0.5 μL for women at the same site (Table 2). The median paired difference in discomfort was 0.0 (P=0.28); the median discomfort was 4.0 for Mayo-QSART and 3.0 for Q-Sweat. To quantify agreement between the devices, we estimated the ICC based on rank-transforming the data. These results are shown in Table 3 and indicate sometimes poor agreement, particularly in volume estimates.
Table 2.
Mayo-QSART and Q-Sweat summary statistics represented as median (minimum, maximum). The paired difference reported is the Mayo-QSART value minus the Q-Sweat value. P-values are based on one-sample signed rank test.
| Measurement | Mayo-QSART | Q-Sweat | Paired difference | P |
|---|---|---|---|---|
| Temperature, ° Celsius | ||||
| Forearm | ||||
| Men | 32.6 (30.3, 34.0) | 32.5 (30.2, 34.2) | -0.2 (-1.5, 2.5) | 0.57 |
| Women | 31.9 (30.4, 33.6) | 31.9 (30.0, 34.0) | -0.1 (-1.2, 1.1) | 0.30 |
| Proximal leg | ||||
| Men | 32.2 (30.5, 33.6) | 32.2 (30.1, 33.7) | 0.0 (-2.0, 1.9) | 0.84 |
| Women | 31.7 (30.0, 33.3) | 31.6 (29.7, 33.1) | 0.1 (-1.4, 1.6) | 0.27 |
| Distal leg | ||||
| Men | 31.5 (28.9, 33.5) | 31.6 (29.5, 33.0) | 0.0 (-1.7, 1.6) | 0.45 |
| Women | 31.0 (28.3, 33.6) | 31.3 (29.0, 33.5) | -0.1 (-2.0, 1.1) | 0.013 |
| Foot | ||||
| Men | 31.8 (27.9, 33.3) | 31.5 (27.9, 33.3) | 0.1 (-1.3, 2.0) | 0.38 |
| Women | 31.1 (29.5, 33.8) | 31.4 (28.9, 34.1) | -0.2 (-2.0, 2.0) | 0.20 |
| Latency, minutes | ||||
| Forearm | ||||
| Men | 1.5 (0.8, 3.1) | 1.7 (1.0, 3.0) | -0.3 (-1.2, 0.5) | <0.001 |
| Women | 1.7 (0.8, 3.3) | 2.0 (0.2, 3.5) | -0.3 (-1.3, 1.5) | <0.001 |
| Proximal leg | ||||
| Men | 1.2 (0.2, 2.6) | 1.5 (0.7, 3.1) | -0.1 (-2.2, 0.8) | 0.034 |
| Women | 1.4 (0.2, 2.4) | 1.7 (0.2, 3.6) | -0.2 (-1.3, 1.4) | <0.001 |
| Distal leg | ||||
| Men | 1.4 (0.4, 3.1) | 1.4 (0.4, 2.5) | 0.0 (-1.6, 1.4) | 0.97 |
| Women | 1.7 (0.2, 4.0) | 1.7 (0.4, 3.6) | 0.0 (-1.2, 0.9) | 0.78 |
| Foot | ||||
| Men | 1.9 (0.2, 5.1) | 2.5 (0.4, 5.2) | -0.4 (-2.7, 1.7) | 0.013 |
| Women | 2.3 (0.2, 5.2) | 2.8 (0.2, 5.3) | -0.3 (-3.2, 2.6) | 0.094 |
| Volume, μL | ||||
| Forearm | ||||
| Men | 3.2 (0.3, 7.3) | 1.3 (0.3, 3.9) | 1.8 (0.1, 5.1) | <0.001 |
| Women | 0.9 (0.1, 4.4) | 0.5 (0.1, 2.4) | 0.5 (-0.4, 3.0) | <0.001 |
| Proximal leg | ||||
| Men | 2.4 (0.8, 6.5) | 1.3 (0.4, 4.0) | 1.0 (-0.6, 4.0) | <0.001 |
| Women | 1.4 (0.2, 5.1) | 0.8 (0.1, 2.4) | 0.7 (-0.5, 3.2) | <0.001 |
| Distal leg | ||||
| Men | 3.6 (0.4, 7.8) | 1.9 (0.3, 3.9) | 1.8 (-0.3, 4.6) | <0.001 |
| Women | 1.7 (0.2, 6.5) | 1.0 (0.1, 3.5) | 0.6 (-0.1, 3.0) | <0.001 |
| Foot | ||||
| Men | 1.6 (0.1, 5.1) | 0.8 (0.2, 2.5) | 0.8 (-0.3, 4.1) | <0.001 |
| Women | 0.8 (0.1, 4.2) | 0.4 (0.0, 1.5) | 0.5 (-0.1, 3.4) | <0.001 |
Table 3.
Agreement as indicated by intraclass correlation of rank-transformed values (P-value for test of zero correlation)
| Measurement | Men | Women |
|---|---|---|
| Temperature | ||
| Forearm | 0.60 (<0.001) | 0.73 (<0.001) |
| Proximal leg | 0.50 (<0.001) | 0.67 (<0.001) |
| Distal leg | 0.74 (<0.001) | 0.73 (<0.001) |
| Foot | 0.76 (<0.001) | 0.66 (<0.001) |
| Latency | ||
| Forearm | 0.47 (0.0011) | 0.55 (<0.001) |
| Proximal leg | 0.44 (0.0023) | 0.34 (0.013) |
| Distal leg | 0.59 (<0.001) | 0.53 (<0.001) |
| Foot | 0.21 (0.18) | 0.36 (0.012) |
| Volume | ||
| Forearm | 0.19 (0.20) | 0.38 (0.0052) |
| Proximal leg | 0.29 (0.052) | 0.46 (<0.001) |
| Distal leg | 0.15 (0.33) | 0.70 (<0.001) |
| Foot | 0.33 (0.026) | 0.22 (0.13) |
On the other hand, there was found to be a linear relationship between Mayo-QSART and Q-Sweat volumes at all sites for both men and women as illustrated in Figure 1. Supplementary Figures S1 and S2 illustrate the relationship between the devices for temperature and latency. Table 4 provides the least squares intercept and slope estimate, a 95% confidence interval for the slope, and the P-value for testing whether the slope differs from the identity line of perfect agreement for temperature, latency, and volume. Least squares point estimates for temperature and latency were all less than one, indicating a tendency for reduced temperatures and longer latencies for the Q-Sweat device. However, the 95% confidence intervals for slope for temperature in the distal leg and foot among men, as well as the slope for latency in the distal leg among men and women included the value 1.0, indicating that the data were nevertheless consistent with a 1:1 relationship at some sites. On the other hand, least squares estimates for volume were greater than 1.0 in the forearm, proximal leg, and distal leg. The slope was significantly greater than 1.0 for the proximal leg among women (P=0.001), and the distal leg among men (P=0.02) and women (P<0.001). In the foot, the least squares estimate was 1.1 among men and 1.5 among women, neither of which differed significantly from the line of agreement. In multivariable modeling, the participant's BMI, site temperature, and site latency were not significant predictors of Mayo-QSART volume at the 0.10 level after accounting for Q-Sweat volume. However, among women, age significantly improved the prediction model in the distal (P=0.09) and proximal leg (P=0.07). Table 5 provides prediction equations for estimating QSART volume given a patient's Q-Sweat volume. Approximate 95% prediction intervals can be obtained by adding and subtracting twice the root mean square error (RMSE).
Figure 1.
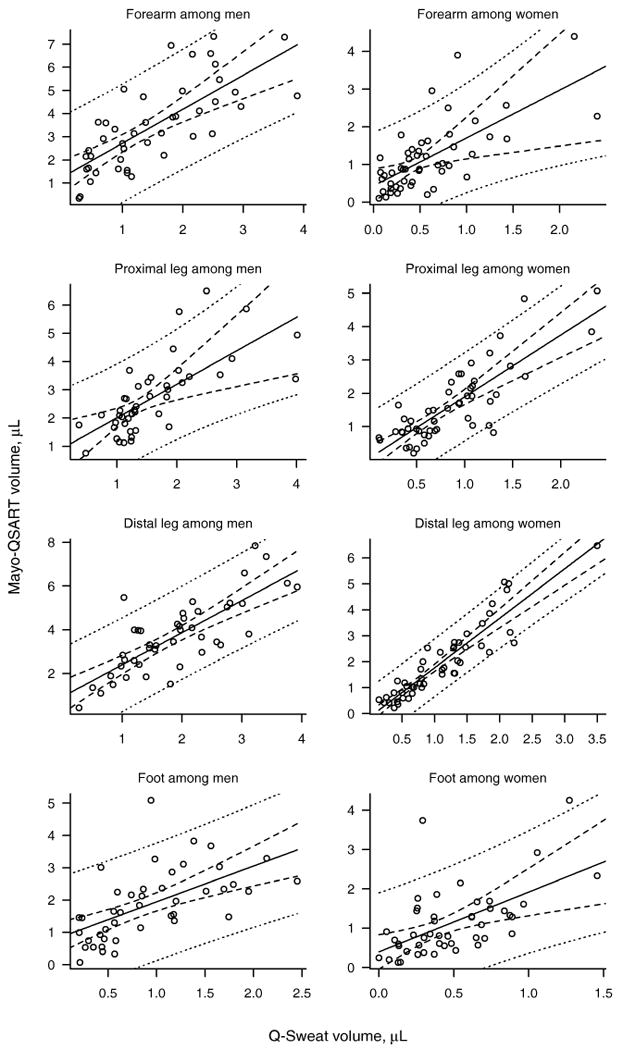
Mayo–QSART versus Q–Sweat volumes (in microliters) for each regional site separately for men and women. The least squares regression line and 95% confidence intervals are indicated by solid and dashed lines, respectively. The dotted lines indicate a 95% prediction interval for the Mayo–QSART volume of an arbitrary patient given his/her Q–Sweat volume.
Table 4.
Characterizing the linear relationships between Mayo-QSART and Q-Sweat separately for men and women.
| Measurement | Intercept | Slope | 95% CI for slope | P* |
|---|---|---|---|---|
| Latency | ||||
| Forearm | ||||
| Men | 0.408 | 0.589 | 0.26 to 0.92 | 0.02 |
| Women | 0.734 | 0.519 | 0.16 to 0.88 | 0.01 |
| Proximal leg | ||||
| Men | 0.541 | 0.526 | 0.064 to 0.99 | 0.04 |
| Women | 0.718 | 0.42 | 0.16 to 0.68 | <0.001 |
| Distal leg | ||||
| Men | 0.489 | 0.65 | 0.2 to 1.1 | 0.10 |
| Women | 0.456 | 0.722 | 0.39 to 1.1 | 0.10 |
| Foot | ||||
| Men | 0.903 | 0.442 | 0.082 to 0.8 | 0.003 |
| Women | 1.41 | 0.395 | 0.072 to 0.72 | <0.001 |
| Volume | ||||
| Forearm | ||||
| Men | 1.25 | 1.47 | 0.94 to 2 | 0.08 |
| Women | 0.435 | 1.27 | 0.32 to 2.2 | 0.60 |
| Proximal leg | ||||
| Men | 0.827 | 1.19 | 0.44 to 1.9 | 0.60 |
| Women | 0.0452 | 1.85 | 1.4 to 2.3 | 0.001 |
| Distal leg | ||||
| Men | 0.927 | 1.47 | 1.1 to 1.9 | 0.02 |
| Women | -0.133 | 1.91 | 1.6 to 2.2 | <0.001 |
| Foot | ||||
| Men | 0.841 | 1.11 | 0.63 to 1.6 | 0.70 |
| Women | 0.397 | 1.52 | 0.57 to 2.5 | 0.30 |
Testing whether slope is significantly different from 1.0, the line of agreement
Table 5.
Regression equations to predict QSART volume from Q-Sweat volume accounting for age when significant
| Endpoint | Regression equation | Model R2 | RMSE* |
|---|---|---|---|
| Forearm | |||
| Men | 1.25 + 1.47 × (Q-Sweat vol. in μL) | 0.55 | 1.25 |
| Women | 0.435 + 1.27 × (Q-Sweat vol. in μL) | 0.47 | 0.67 |
| Distal leg | |||
| Men | 0.927 + 1.47 × (Q-Sweat vol. in μL) | 0.62 | 1.04 |
| Women | 0.309 + 1.81 × (Q-Sweat vol. in μL) − 0.010 × (Age in y) | 0.86 | 0.54 |
| Proximal leg | |||
| Men | 0.877 + 1.17 × (Q-Sweat vol. in μL) | 0.51 | 0.92 |
| Women | 0.495 + 1.79 × (Q-Sweat vol. in μL) − 0.012 × (Age in y) | 0.69 | 0.63 |
| Foot | |||
| Men | 0.841 + 1.11 × (Q-Sweat vol.) | 0.35 | 0.89 |
| Women | 0.397 + 1.52 × (Q-Sweat vol. in μL) | 0.33 | 0.71 |
Root mean square error. Approximately 95% of QSART values can be expected to fall within 2 RMSE of the regression line.
A cross-classification table (Table 6) summarizes the number of healthy participants that would be diagnosed as normal using Mayo-QSART and abnormal using Q-Sweat collection methods and vice-versa. The table estimates the discordance rate between measures at the four sites to be: 18% (forearm), 18% (proximal leg), 12% (distal leg), and 22% (foot). Kappa was found to be 0.27 (forearm), -0.04 (proximal leg), 0.24 (distal leg), and 0.38 (foot) suggesting no agreement (k<0) in the proximal leg and fair agreement (k=0.21-0.40) in the forearm, distal leg and foot.3
Table 6.
Agreement between Q-Sweat and Mayo-QSART on whether a sweat volume is abnormal
| Mayo-QSART result | ||||
|---|---|---|---|---|
| Site | Q-Sweat result | Normal | Abnormal | Kappa |
| Forearm | Normal | 73 | 0 | 0.27 |
| Abnormal | 17 | 4 | ||
| Proximal leg | Normal | 77 | 2 | -0.04 |
| Abnormal | 15 | 0 | ||
| Distal leg | Normal | 80 | 0 | 0.24 |
| Abnormal | 11 | 2 | ||
| Foot | Normal | 61 | 0 | 0.38 |
| Abnormal | 20 | 9 | ||
Volume measurements collected using the Q-Sweat device were used in the regression equations presented above to estimate the Mayo-QSART volume. The corrected volume measures were then compared against the published norms;4 all volumes were found to be within normal limits. This would be expected since the volume measures are being converted to the long-term average Mayo-QSART for all participants at a particular Q-Sweat volume, and prediction intervals around the regression are wide.
Discussion
The main observation of this study is that there is a clear linear relationship between the volume estimates for the two devices as indicated by the narrow confidence intervals about the mean (Figure 1). This indicates that the Q-Sweat device faithfully measures the quantitative sudomotor axon-reflex test sweat response. However, the slopes of these relationships were not consistently found to be near 1.0 for all sites. Instead, we found the estimated slopes to range from 1.1 to 1.9 across the four sites for both men and women, suggesting that Q-Sweat underestimates the QSART volume. We generated a formula that predicts Mayo-QSART from Q-Sweat. The regression is robust for all sites except the foot, where there will be a degree of uncertainty when translating a Q-Sweat estimate to a Mayo-QSART volume for an individual patient as shown by the wide prediction intervals. The optimal approach for Q-Sweat users is to use Q-Sweat generated normative database directly.
There are a number of variables to be considered. The studies comparing these two devices were done on identical participants, and the design and results of the study exclude any confounding factor due to gender, age or side tested. Tight control of room and limb temperatures excludes any potential effects that may be contributed to temperature differences. Multi-compartmental sweat cell design and acetylcholine concentration are identical. Both devices have been well-calibrated to accurately measure the volume of sweat response.
Since there is no difference due to capsule design, skin temperature, ACh concentration, and recording fidelity, the remaining variable is that of stimulator efficiency. Both stimulators are designed to deliver 2 mA. However, the actual current delivered and the efficiency of delivery depends on the characteristics of the stimulator, return electrodes, and the skin resistance of the participant. The longer latency and lower volumes of the sweat response generated using the typical Q-Sweat setup supports the notion that stimulation using Life-Tech current generators results in less efficient ion delivery. However, an argument against stimulus strength is the perception of the same degree of participant discomfort in response to Life-Tech and Mayo-built stimulators. Stimulus strength is a critical issue. A stimulus strength >20mA will electrically evoke an axon-reflex sweat response,9 but it is quite painful. We chose a concentration of acetylcholine and stimulus strength that is adequate but either not painful or only minimally painful. It is known that these stimulus conditions can result in a sub-threshold stimulus in the occasional participant with high skin resistance, especially the female forearm site.4 The most parsimonious explanation is that there is a difference in the efficiency of ion delivery between the Mayo-built constant current generator and the commercially available unit, and that carbonized rubber electrodes used in conjunction with Q-Sweat results in lower current delivery.12 Clearly the mechanism of difference is unknown at this time. Particularly, because of some uncertainty with estimates of lower volumes, it would be ideal for each laboratory to generate its own normative data set, however, knowing this may not be feasible we provide a method to convert Q-Sweat to Mayo-QSART values; common sense judgment must be used when applying these equations to the data.
Supplementary Material
Acknowledgments
This research was supported by research funds from NIH (NS3 2352, NS4 4233, NS4 3364, UL1 RR24150) and Mayo Clinic. Dr. Low is a consultant to WR Medical.
Abbreviations
- ACh
acetylcholine
- BMI
body mass index
- HCCM
heteroskedasticity consistent covariance matrix
- ICC
intraclass correlation coefficient
- IQR
interquartile range
- QSART
quantitative sudomotor axon reflex test
- Q-Sweat
quantitative sweat measurement system
- RMSE
root mean square error
- VAS
visual analog scale (11-point)
References
- 1.Lide DR, editor. CRC. Handbook of Chemistry and Physics. 2004-2005. [Google Scholar]
- 2.Cribari-Neto F. Asymptotic inference under heteroskedasticity of unknown form. Computational Statistics and Data Analysis. 2004;45:215–233. [Google Scholar]
- 3.Landis JR, Koch GG. The measurement of observer agreement for categorical data. Biometrics. 1977;33:159–174. [PubMed] [Google Scholar]
- 4.Low PA. Laboratory Evalution of Autonomic Failure. In: Low PA, Benarroch EE, editors. Clinical Autonomic Disorders. 3rd. Philadelphia: Lippincott Williams & Wilkins; 2008. pp. 130–163. [Google Scholar]
- 5.Low PA, Caskey PE, Tuck RR, Fealey RD, Dyck PJ. Quantitative sudomotor axon reflex test in normal and neuropathic subjects. Ann Neurol. 1983;14:573–580. doi: 10.1002/ana.410140513. [DOI] [PubMed] [Google Scholar]
- 6.Low PA, Denq JC, Opfer-Gehrking TL, Dyck PJ, O'Brien PC, Slezak JM. Effect of age and gender on sudomotor and cardiovagal function and blood pressure response to tilt in normal subjects. Muscle Nerve. 1997;20:1561–1568. doi: 10.1002/(sici)1097-4598(199712)20:12<1561::aid-mus11>3.0.co;2-3. [DOI] [PubMed] [Google Scholar]
- 7.Low PA, Opfer-Gehrking TL, Kihara M. In vivo studies on receptor pharmacology of the human eccrine sweat gland. Clin Auton Res. 1992;2:29–34. doi: 10.1007/BF01824208. [DOI] [PubMed] [Google Scholar]
- 8.Low PA, Zimmerman BR, Dyck PJ. Comparison of distal sympathetic with vagal function in diabetic neuropathy. Muscle Nerve. 1986;9:592–596. doi: 10.1002/mus.880090703. [DOI] [PubMed] [Google Scholar]
- 9.Namer B, Bickel A, Kramer H, Birklein F, Schmelz M. Chemically and electrically induced sweating and flare reaction. Auton Neurosci. 2004;114:72–82. doi: 10.1016/j.autneu.2004.06.007. [DOI] [PubMed] [Google Scholar]
- 10.O'Brien PC. The appropriateness of analysis of variance and multiple comparison procedures. Biometrics. 1983;39:787–788. [PubMed] [Google Scholar]
- 11.Perneger TV. What's wrong with Bonferroni adjustments. BMJ. 1998;316:1236–1238. doi: 10.1136/bmj.316.7139.1236. [DOI] [PMC free article] [PubMed] [Google Scholar]
- 12.Petrofsky J, Schwab E, Cuneo M, George J, Kim J, Almalty A, et al. Current distribution under electrodes in relation to stimulation current and skin blood flow: are modern electrodes really providing the current distribution during stimulation we believe they are? J Med Eng Technol. 2006;30:368–381. doi: 10.1080/03091900500183855. [DOI] [PubMed] [Google Scholar]
- 13.R Development Core Team. R Foundation for Statistical Computing; Vienna, Austria: 2007. R: A language and environment for statistical computing. URL http://www.R-project.org. [Google Scholar]
Associated Data
This section collects any data citations, data availability statements, or supplementary materials included in this article.