Abstract
Background/Aims
Alcoholic liver disease (ALD) is one of the leading causes of cirrhosis and yet efficient therapeutic strategies are lacking. Polyenephospha tidylcholine (PPC), a major component of essential phospholipids, prevented alcoholic liver fibrosis in baboons, but its precise mechanism remains uncertain. We aimed to explore the effects of PPC on ALD using ethanol-fed peroxisome proliferator-activated receptor α(Ppara)-null mice, showing several similarities to human ALD.
Methods
Male wild-type and Ppara-null mice were pair-fed a Lieber-DeCarli control or 4% ethanol-containing diet with or without PPC (30 mg/kg/day) for 6 months.
Results
PPC significantly ameliorated ethanol-induced hepatocyte damage and hepatitis in Ppara-nullmice. These effects were likely a consequence of decreased oxidative stress through down-regulation of reactive oxygen species (ROS)-generating enzymes, including cytochrome P450 2E1, acyl-CoA oxidase, and NADPH oxidases, in addition to restoration of increases in Toll-like receptor 4 and CD14. PPC also decreased Bax and truncated Bid, thus inhibiting apoptosis. Furthermore, PPC suppressed increases in transforming growth factor-β1 expression and hepatic stellate cell activation, which retarded hepatic fibrogenesis.
Conclusions
PPC exhibited anti-inflammatory, anti-apoptotic, and anti-fibrotic effects on ALD as a result of inhibition of the overexpression of ROS-generating enzymes. Our results demonstrate detailed molecular mechanisms of the antioxidant action of PPC.
Keywords: Cytochrome P450 2E1, Acyl-CoA oxidase, NOX-4, MCP-1, TLR-4
1. Introduction
Chronic alcohol consumption can cause a wide spectrum of liver abnormalities that ranges from simple steatosis to hepatitis, cirrhosis, and hepatocellular carcinoma. It has been reported that alcoholic liver disease (ALD) remains the most common cause of liver cirrhosis in Western countries [1]. Since the appearance of hepatitis is a predictor of progression to cirrhosis and liver cancer, appropriate therapeutic intervention at this point is important in treating ALD.
Numerous data on the pathogenesis of ALD have been obtained from animal studies [1–3]. Chronic alcohol consumption induces hepatic oxidative stress due to increased generation of reactive oxygen species (ROS) and/or reduced anti-oxidant capacity. Oxidative stress causes further lipid peroxidation, which can directly damage the membranes of cells and organelles and lead to release of reactive aldehydes with potent pro-inflammatory and pro-fibrotic properties. Chronic alcohol intake also increases gut-derived lipopolysaccaride (LPS) concentration in portal blood, which binds to Toll-like receptor 4 (TLR4)/CD14 complexes and activates nuclear factor-kappa B (NF-κB), triggering pro-inflammatory responses such as induction of tumor necrosis factor-α (TNF-α) and interleukin-1β (IL-1β). Furthermore, ethanol is singularly so toxic that it can induce hepatocyte apoptosis by itself. These mechanisms are all presumed to contribute to human ALD to varying degrees.
Peroxisome proliferator-activated receptors (PPARs) are ligand-activated nuclear receptors belonging to the steroid/thyroid hormone receptor superfamily. Three isoforms of PPARs exist, designated as PPARα, PPARβ/δ, and PPARγ. Of these, PPARα is associated with the control of fatty acid transport and metabolism primarily in the liver [4]. A close relationship between PPARα and the development of ALD is believed to exist since chronic alcohol consumption decreases hepatic PPARα expression and suppresses the transcriptional activity of PPARα-regulated genes [5,6]. We previously reported that PPARα-null (Ppara−/−) mice fed a 4% ethanol-containing Lieber-DeCarli diet for 6 months exhibited hepatomegaly, macrovesicular steatosis, hepatocyte apoptosis, mitochondrial swelling, hepatitis, and hepatic fibrosis, all of which resembled the clinical and pathological features of patients with ALD [7]. These abnormalities appeared with very high reproducibility and stressful surgical procedures to increase alcohol levels, such as gastric tube insertion, were not required. Therefore, Ppara−/− mice are regarded as a useful animal model to investigate the pathogenesis of human ALD.
Essential phospholipids are highly-purified phosphatidylcholine fractions containing linoleic acid and other unsaturated fatty acids. Polyenephosphatidylcholine (PPC), a major active ingredient in essential phospholipids, has a high bioavailability and affinity for cellular and subcellular membranes and maintains membrane fluidity and function. Several experiments have demonstrated the hepatoprotective effects of PPC [8–10]. However, the precise molecular mechanism of PPC action against ethanol toxicity has not been fully elucidated in vivo, which prompted us to evaluate the effects of PPC on ALD in greater detail using Ppara−/− mice.
2. Methods
2.1. Mice and treatment
Generation of Ppara−/− mice on a Sv/129 genetic background was described previously [11]. The mice were housed in an environment controlled for temperature, humidity, and light (25 °C, 12-h light/dark cycle) and maintained with standard laboratory chow and tap water ad libitum until 12 weeks of age. Male 12-week-old Sv/129 wild-type or Ppara−/− mice (n = 24 in each genotype) weighing 31–35 g were selected, randomly divided into 4 groups, and pair-fed the following diet for 6 months: (1) control Lieber-DeCarli liquid diet (n = 6); (2) control liquid diet with PPC (30 mg/kg/day) (n = 6); (3) 4% ethanol-containing Lieber-DeCarli liquid diet (n = 6); and (4) 4% ethanol-containing liquid diet with PPC (30 mg/kg/day) (n = 6). The ethanol-containing diet consisted of 19.4% (per weight basis) protein as casein, 51.0% carbohydrate as sucrose, 13.2% olive oil, 3.6% corn oil, 4.5% cellulose, 2.9% mineral mix, 1.1% vitamin mix, 0.3% choline bitartrate, and 4% ethanol (Oriental Yeast Co., Ltd, Tokyo, Japan). The control diet was replaced ethanol with isocaloric sucrose. PPC was provided from Alfresa (Osaka, Japan), and mixed in with the diet. Ethanol concentrations were raised gradually from 2% to 4% over the first month and maintained at 4% for the remainder of the administration period. Dietary intake was recorded every day and body weight was measured once a week. Six months after commencing treatment, all mice were sacrificed under anesthesia. After obtaining portal blood, livers were removed and weighed. All animal experiments were conducted in accordance with animal study protocols outlined in the “Guide for the Care and Use of Laboratory Animals” prepared by the National Academy of Sciences and approved by Shinshu University School of Medicine.
2.2. Measurement of plasma ethanol concentrations
To ascertain the amount of ethanol intake, blood was obtained from a tail vein at the same time (AM 10:00) of the first day of each month, and plasma ethanol concentration was determined using the vial equilibration method, as described elsewhere [7].
2.3. Preparation of nuclear and cytosolic fractions
Nuclear and cytosolic fractions were prepared as described previously [12].
2.4. Immunoblot analysis
Protein concentrations were measured colorimetrically with a BCA™ Protein Assay kit (Pierce, Rockford, IL, USA). For analysis of NF-κB, nuclear fractions (100 µg of protein) were subjected to 10% SDS–polyacrylamide gel electrophoresis (SDS–PAGE). For analysis of other proteins, whole lysate or cytosolic fractions (50–100 µg of protein) were subjected to 8–10% SDS–PAGE [12–15]. The samples were obtained from all Ppara−/− mice (n = 6 in each group). In each electrophoresis assay, samples from three different mice in the same group were loaded. After electrophoresis, the proteins were transferred to nitrocellulose membranes and incubated with the primary antibody followed by alkaline phosphatase-conjugated goat anti-rabbit IgG. Antibodies raised against cytochrome P450 2E1 (CYP2E1), acyl-coenzyme A oxidase (AOX), and catalase were described previously [4,7]. Antibodies against other proteins were purchased commercially (BD Transduction Laboratories, San Diego, CA, USA for cytochrome c antibody, Cell Signaling Technology, Beverly, MA, USA for phosphorylated kinases, and Santa Cruz Biotechnology, Santa Cruz, CA, USA for others). The antibody against protein kinase C (PKC) recognized all PKC isoforms. Actin or histone H1 bands were used as loading controls. Band intensity was measured densitometrically, normalized to that of actin or histone H1, and expressed as fold change relative to that of Ppara−/− mice fed a control Lieber-DeCarli liquid diet without addition of PPC. For confirmation of data reproducibility, immunoblot analysis using the same samples was done twice. Similar immunoblot analysis was also performed with the remaining three samples from each group. Overall, four independent assays were carried out for each target molecule and the data of 12 band intensities were obtained for each group and subjected to statistical analysis.
2.5. Analysis of mRNA
Total liver RNA was extracted from all Ppara−/− mice (n = 6 in each group) using an RNeasy Mini Kit (Qiagen, Tokyo, Japan), and cDNA was generated by SuperScript II reverse transcriptase (Gibco BRL, Paisley, Scotland) [16]. Quantitative RT-PCR was performed using a SYBR green PCR kit and ABI Prism 7700 Sequence Detection System (Applied Biosystems, Foster City, CA, USA). The primer pairs used are shown in Supplementary Table 1. Measured mRNA levels were normalized to glyceraldehyde-3-phosphate dehydrogenase (GAP-DH) mRNA levels, and expressed as fold change relative to those of Ppara−/− mice fed a control Lieber-DeCarli liquid diet without addition of PPC.
2.6. Histological evaluation
Small blocks of liver tissue from each mouse were fixed in 4% para-formaldehyde in phosphate-buffered saline and embedded in paraffin. Sections (4 µm thick) were stained with hematoxylin and eosin or Azan-Mallory method. At least three discontinuous liver sections were evaluated in each mouse. Histological findings were scored by an independent pathologist in a blinded fashion according to the following criteria: (1) grade of steatosis: 0, none; 1, mild (5–33% of parenchymal involvement by steatosis); 2, moderate (33–66%); 3, severe (>66%); (2) activity of inflammation: 0, none; 1, mild; 2, moderate; 3, severe; and (3) stage of fibrosis: 0, none; 1, mild perisinusoidal fibrosis mainly in zone 3; 2, moderate perisinusoidal fibrosis in zone 3; 3, perisinusoidal or portal/periportal fibrosis; 4, perisinusoidal and portal/periportal fibrosis. The overall inflammation score was expressed as the sum of portal (0– 3) and lobular (0–3) inflammation scores and ranged from 0 to 6. The number of necrotic foci was counted in 20 randomly selected 200× microscopic fields per section and expressed as number per square millimeter [17]. The number of neutrophils infiltrating into liver lobuli was counted in 20 randomly selected 400× microscopic fields per section and expressed as number per high-power field. To assess hepatocyte apoptosis, the terminal deoxynucleotidyl transferase-mediated deoxyuridine triphosphate nick-end labeling (TUNEL) assay was performed using MEBSTAIN Apoptosis Kit II (Medical & Biological Laboratories, Nagoya, Japan). Two-hundred hepatocytes were examined in each section, and the number of TUNEL-positive hepatocytes was expressed as a percentage [12].
2.7. Other methods
Assays for enzymatic activity were carried out as described previously [7,18]. Plasma concentrations of aspartate and alanine aminotransferase (AST and ALT) were examined using a GOT and GPT-test kit (Wako), respectively. Plasma LPS level was measured by means of an endotoxin single- test kit (Wako). Total hepatic lipids were extracted according to a method by Folch et al. [19], and levels of triglycerides (TG) and lipid peroxides [malondialdehyde (MDA) and 4-hydroxynonenal (4-HNE)] were measured with a Triglyceride E-test (Wako) and LPO-586 kit (OXIS International, Portland, OR, USA), respectively.
2.8. Statistical analysis
Statistical analysis was performed using the two-tailed Student’s t-test. Quantitative data were expressed as mean ± standard deviation (SD). A probability value of less than 0.05 was considered to be statistically significant.
3. Results
3.1. General effect of PPC in 4% ethanol-fed mice
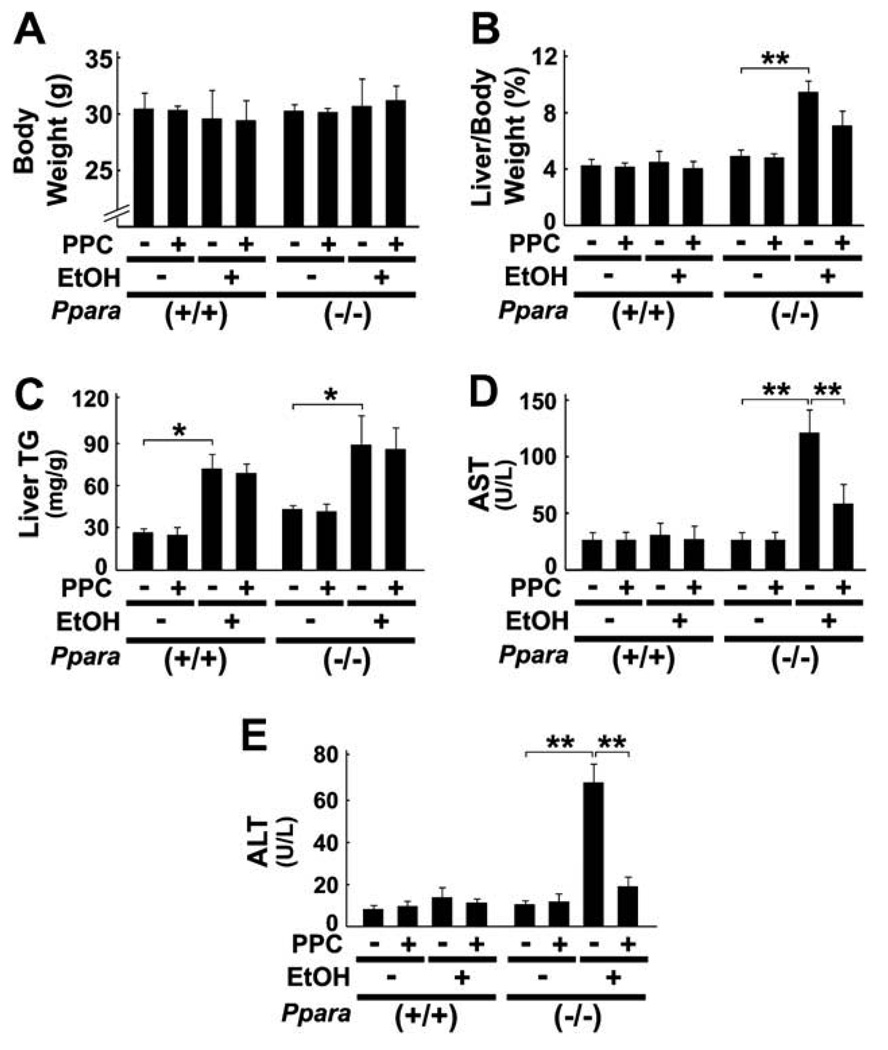
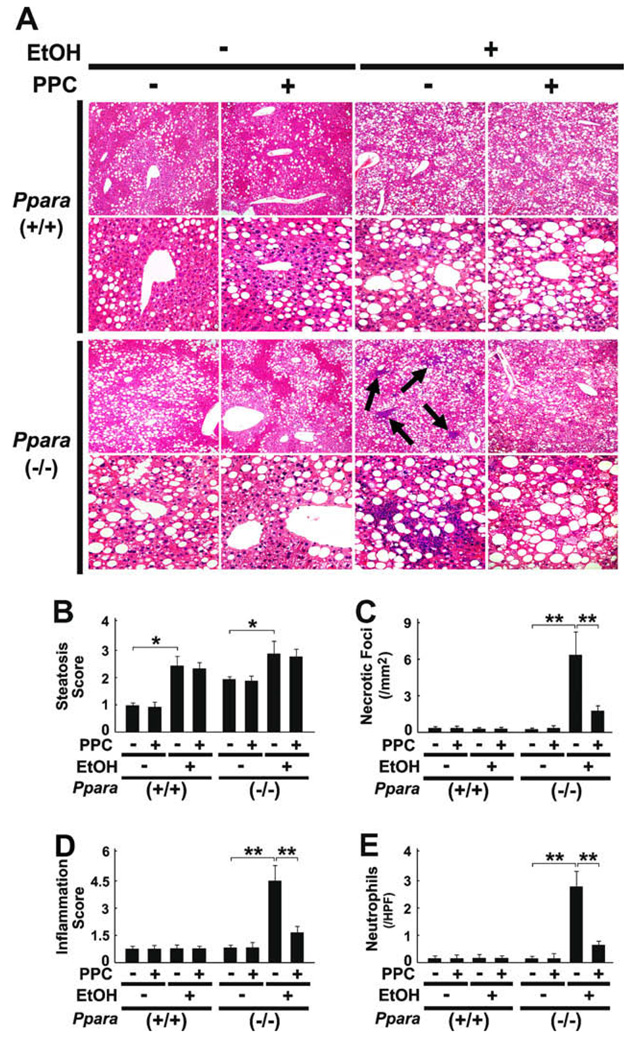
All mice survived treatment and the body weights of mice did not differ in each genotype (Fig. 1A). Although liver TG contents were increased in wild-type and Ppara−/− mice fed a 4% ethanol-containing diet, hepatomegaly and significant elevation of serum AST and ALT levels were observed only in ethanol-treated Ppara−/− mice (Fig. 1B, D, and E), which were consistent with the previous report [7]. In histological examinations, focal necrosis of hepatocytes and infiltration of inflammatory cells, mainly neutrophils, were detected only in Ppara−/− mice fed the liquid diet containing ethanol, but ballooned hepatocytes or Mallory’s hyaline were not found (Fig. 2A, C–E). Moderate-to-severe macrovesicular steatosis was seen in all groups (Fig. 2A and B). PPC did not have any effects on hepatomegaly or hepatic TG accumulation (Fig. 1B and C), but significantly improved serum AST and ALT levels (Fig. 1D and E) and activity of hepatitis (Fig. 2A, C–E) in ethanol-fed Ppara−/− mice. These results demonstrate that PPC could alleviate ethanol-induced hepatocyte damage and hepatitis occurred specifically in Ppara−/− mice.
Fig. 1.
General effects of PPC in 4% ethanol-treated mice. Male wild-type (+/+) and Ppara-null (−/−) mice were pair-fed a control- or 4% ethanol (EtOH)-containing liquid diet with or without PPC (30 mg/kg/ day) for six months. The body weights (A), the degrees of hepatomegaly and liver TG accumulation (B and C), and serum levels of AST and ALT (D and E) are shown. Results are expressed as mean ± SD (n = 6/group). **P < 0.01; *P < 0.05.
Fig. 2.
Effects of PPC on liver histology in 4% ethanol-treated mice. (A) Light micrographs of liver stained by hematoxylin and eosin method. Upper and lower rows in each genotype show a magnification of 100× and 400×, respectively. Macrovesicular steatosis was found in all groups, but intralobular and periportal inflammations (arrows) were evident only in ethanol (EtOH)-fed Ppara-null (−/−) mice without PPC treatment. (B–E) Semiquantitative evaluation of histological findings. These assays were carried out as described in Section 2. Results are expressed as mean ± SD (n = 6/group). **P < 0.01; *P < 0.05.
3.2. Effect of PPC on ethanol metabolism
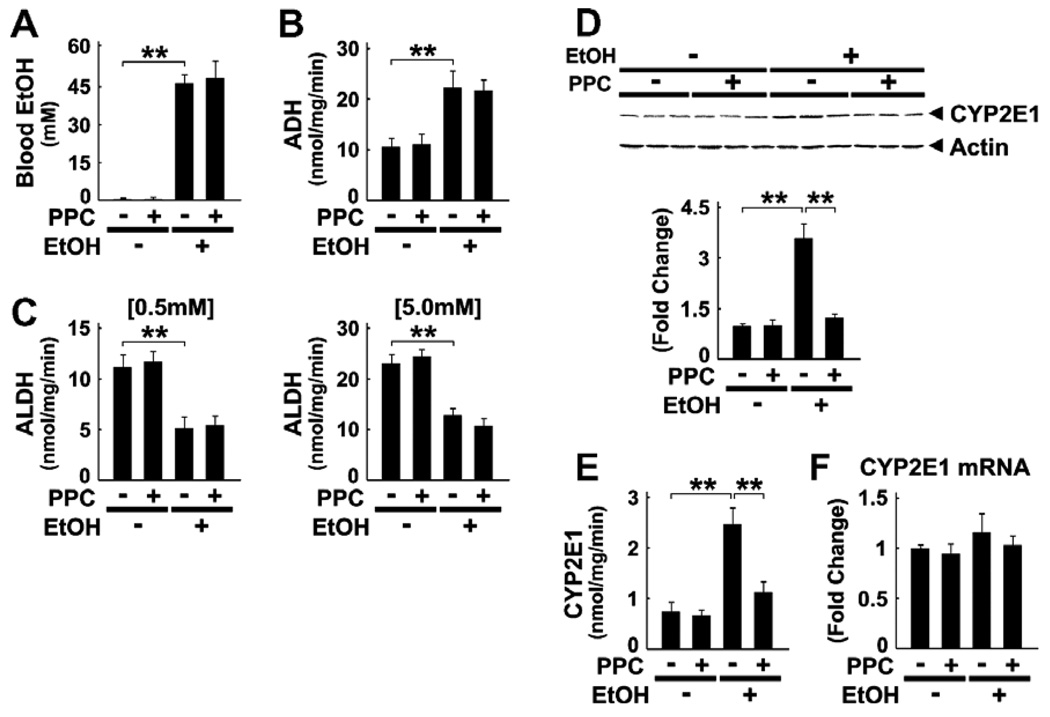
To explore the mechanism of PPC action on ALD in Ppara−/− mice, we first examined the changes in ethanol-metabolizing enzymes in the liver. Plasma ethanol concentrations were similar between Ppara−/− mice fed ethanol-containing diets with or without PPC (36 ± 12 vs. 34 ± 14 mM at one month; 45 ± 12 vs. 44 ± 10 mM at 2 months; and 46 ± 6 vs. 47 ± 14 mM at 4 months), as well as those at the endpoint (Fig. 3A). Although PPC did not change the levels of alcohol dehydrogenase (ADH) or aldehyde dehydrogenase (ALDH) activity (Fig. 3B and C), it normalized increases in the expression and activity of CYP2E1 (Fig. 3D and E). Quantitative RT-PCR analysis revealed that the changes in CYP2E1 expression were due to a post-transcriptional mechanism (Fig. 3F).
Fig. 3.
Analyses of factors associated with ethanol metabolism in Ppara−/− mice. (A–C) Blood concentrations of ethanol (EtOH, A) and hepatic activities of ADH (B) and ALDH at low (0.5 mM) and high (5.0 mM) acetaldehyde concentrations (C). Results are expressed as mean ± SD (n = 6/group). **P < 0.01. (D) Immunoblot analysis of CYP2E1. Whole liver lysates (50 µg of protein) obtained from three different mice in each group were loaded. Actin was used as the loading control. The bands shown are representative of four independent experiments. Band intensity was quantified densitometrically, normalized to that of actin, and subsequently normalized to that in control Ppara−/−mice. Results are expressed as mean ± SD (n = 6/ group). **P < 0.01. (E) Hepatic activities of CYP2E1. Results are expressed as mean ± SD (n = 6/group). **P < 0.01. (F) Levels of CYP2E1 mRNA. CYP2E1 mRNA levels were normalized to those of GAPDH and subsequently normalized to those in control Ppara−/− mice. Results are expressed as mean ± SD (n = 6/group).
3.3. Effect of PPC on hepatic oxidative stress
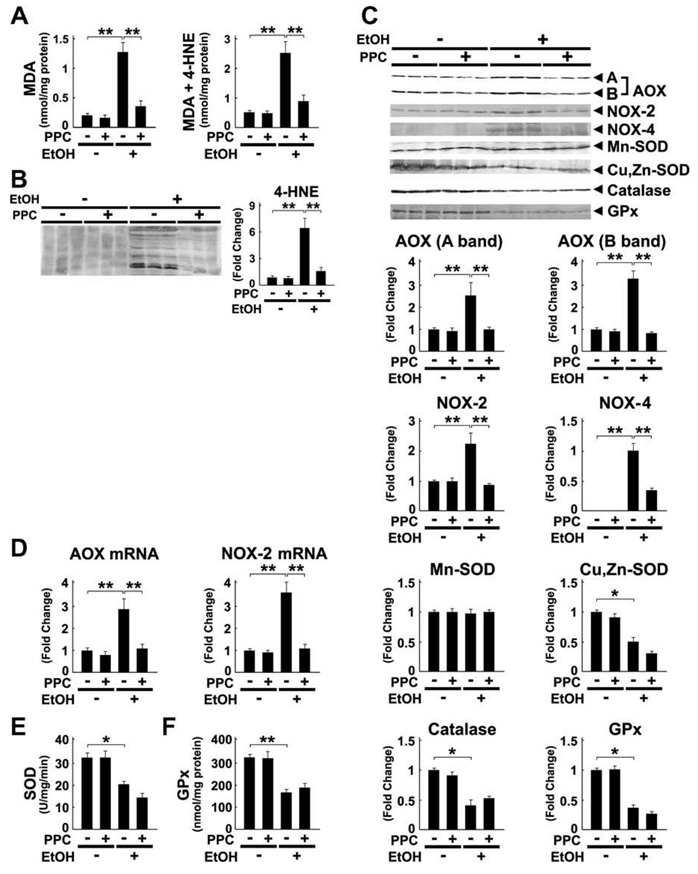
To test whether PPC modified the ROS production caused by ethanol intake, the hepatic content of lipid peroxides MDA and 4-HNE were determined. As expected, PPC halted increases in these byproducts (Fig. 4A and B). PPC diminished the induction of ROS-generating enzymes AOX and NADPH oxidase NOX-2 (Fig. 4C), and the same was true for changes in their mRNA levels (Fig. 4D). Furthermore, PPC alleviated the increases in NOX-4 (Fig. 4C). On the other hand, PPC did not influence either the expression of ROS-eliminating enzymes, such as Cu, Zn-superoxide dismutase (SOD), Mn-SOD, catalase, and glutathione peroxidase (GPx), or the activities of SOD and GPx (Fig. 4C, E, and F). Additionally, PPC did not have any impact on the activity of glutathione S-transferase or glutathione content in the liver (data not shown). Overall, it appears that PPC contributed to decreases in ethanol-derived oxidative stress by inhibiting the overexpression of ROS-generating enzymes, but not by reinforcing anti-oxidant defense capacity.
Fig. 4.
Ethanol-induced increases in oxidative stress were inhibited by PPC treatment in Ppara−/− mice. (A) Hepatic contents of lipid peroxides. Results are expressed as mean ± SD (n = 6/group). **P < 0.01. (B and C) Immunoblot analysis of 4-HNE and ROS-generating and ROS-eliminating enzymes. The same samples used in Fig. 3D (whole liver lysate, 50 µg of protein) were adopted. The bands shown are representative of four independent experiments. Band intensity was quantified densitometrically, normalized to that of actin, and subsequently normalized to that in control Ppara−/− mice. Results are expressed as mean ± SD (n = 6/group). A and B bands of AOX, full-length and truncated AOX, respectively; **P < 0.01; *P < 0.05. (D) Levels of AOX and NOX-2 mRNA. The mRNA levels were normalized to those of GAPDH and subsequently normalized to those in control Ppara−/− mice. Results are expressed as mean ± SD (n = 6/group). **P < 0.01. (E and F) Activities of SOD and GPx in the liver. **P < 0.01; *P < 0.05.
3.4. Effect of PPC on kinase phosphorylation
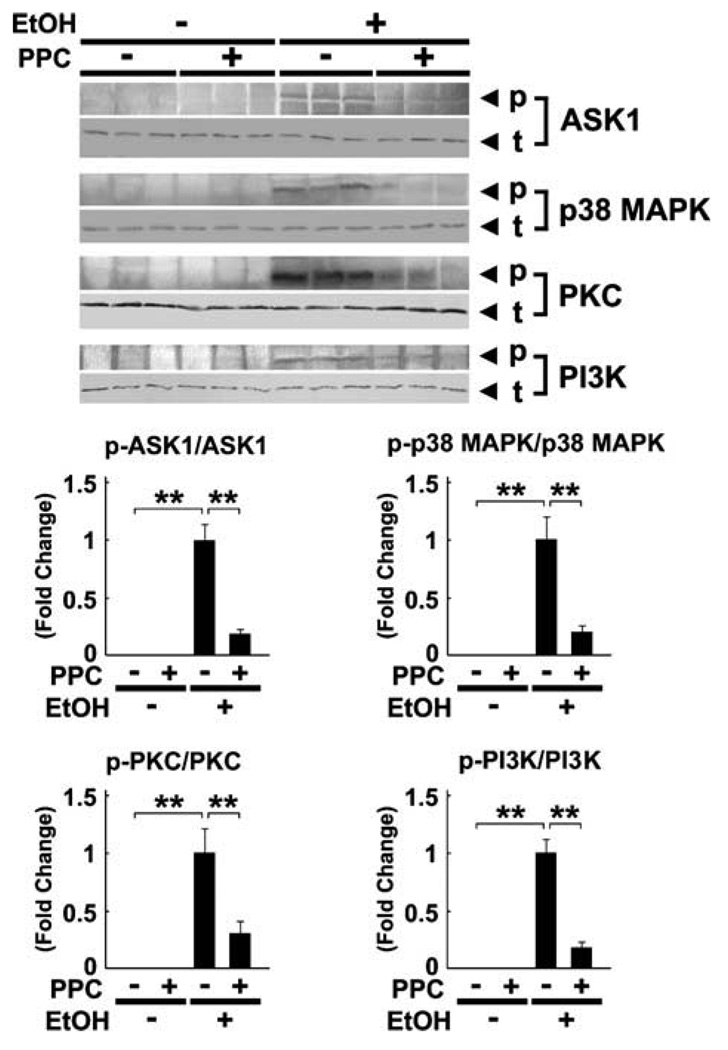
Since ROS can serve as a second messenger in signal transduction by activating various stress kinases, the degree of phosphorylation of these enzymes was examined. Continuous ethanol administration increased the phosphorylated forms of apoptosis signal-regulating kinase 1 (ASK1), p38 mitogen-activated protein kinase (p38 MAPK), PKC, and phosphatidylinositol-3 kinase (PI3K) (Fig. 5). However, PPC significantly suppressed the increases in each of these proteins (Fig. 5).
Fig. 5.
Immunoblot analysis of representative stress kinases and their phosphorylated forms using Ppara−/− mouse livers. The same samples used in Fig. 3D (whole liver lysate, 100 µg of protein) were used. The bands shown are representative of four independent experiments. The band intensity of phosphorylated proteins was quantified densitometrically, normalized to that of the corresponding total protein, and subsequently normalized to that in the EtOH-fed Ppara−/− mice without PPC treatment since phosphorylated proteins could not be detected in controls. Results are expressed as mean ± SD (n = 6/group). p, phosphorylated protein; t, total protein; **P < 0.01.
3.5. Effect of PPC on the NF-κB-mediated signaling pathway
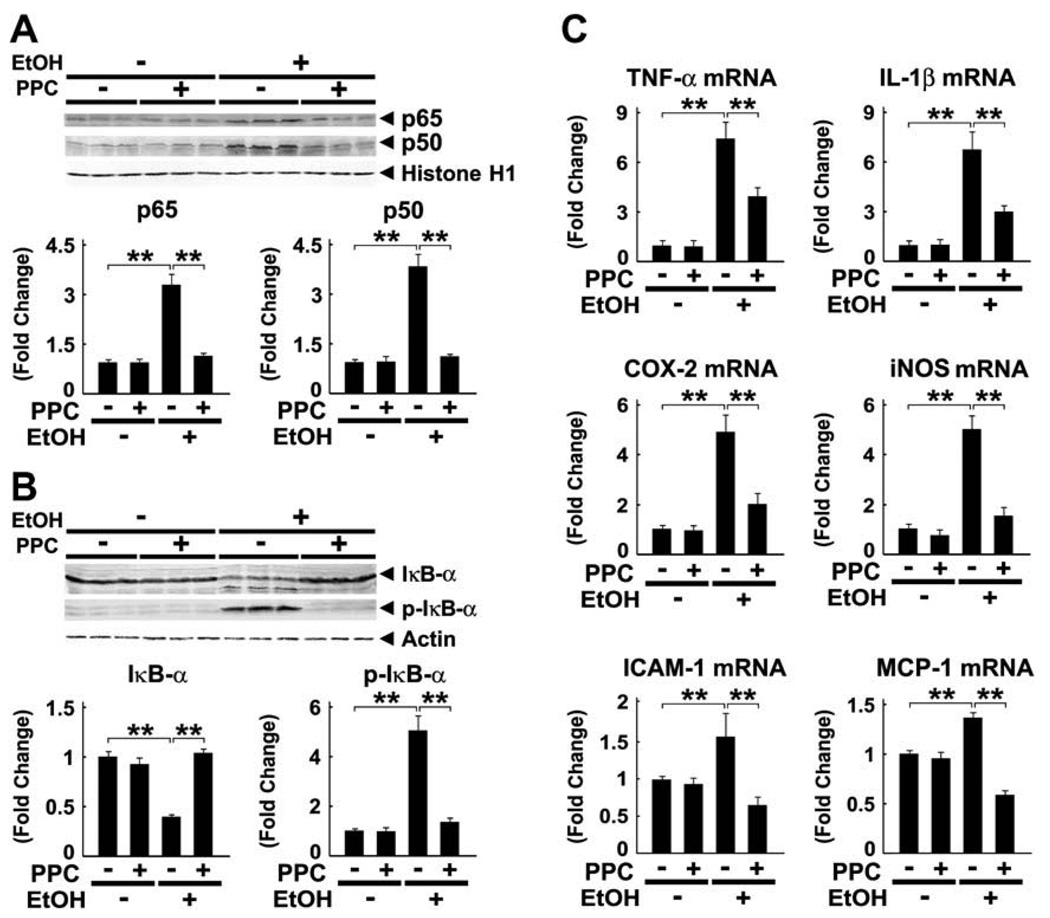
PPC normalized the increases in NF-κB subunits p65 and p50 in hepatocyte nuclei of ethanol-fed mice (Fig. 6A). To determine whether the activation of NF-κB was the result of degradation of IκB-α, an inhibitor of NF-κB, the expression of IκB-α and its phosphorylated form (p-IκB-α) was assessed by immunoblot analysis. Ethanol caused marked decreases in IκB-α and increases in p-IκB-α, but PPC corrected these changes (Fig. 6B), thus ameliorating the ethanol-enhanced increases in mRNA levels of NF-κB-regulated genes, including TNF-α, IL-1β, cyclo-oxygenase 2 (COX-2), inducible nitric oxide synthase (iNOS), intercellular adhesion molecule 1 (ICAM-1), and monocyte chemotactic protein 1 (MCP-1) (Fig. 6C). Collectively, these results indicate that PPC significantly attenuated NF-κB activation and the resultant pro-inflammatory responses induced by persistent ethanol consumption.
Fig. 6.
Ethanol-induced NF-κB activation and increases in pro-inflammatory responses were blocked by PPC treatment in Ppara−/− mice. (A) Immunoblot analysis of NF-κB subunits p65 and p50. Nuclear fractions obtained from three different mice in each group (100 µg of protein) were loaded. Histone H1 was used as the loading control. The bands are representative of four independent experiments. Band intensity was quantified densitometrically, normalized to that of histone H1, and subsequently normalized to that in the control Ppara−/− mice. Results are expressed as mean ± SD (n = 6/group). **P < 0.01. (B) Immunoblot analysis of IκB-α and its phosphorylated form. Cytosolic fractions obtained from three different mice in each group (100 µg of protein) were loaded. The bands shown are representative of four independent experiments. Band intensity was quantified densitometrically, normalized to that of actin, and subsequently normalized to that in the control Ppara−/− mice. Results are expressed as mean ± SD (n = 6/group). **P < 0.01. (C) Levels of mRNA of NF-κB-regulated genes. The mRNA levels were normalized to those of GAPDH and subsequently normalized to those in control Ppara−/− mice. Results are expressed as mean ± SD (n = 6/group). **P < 0.01.
3.6. Effect of PPC on the LPS-mediated signaling pathway
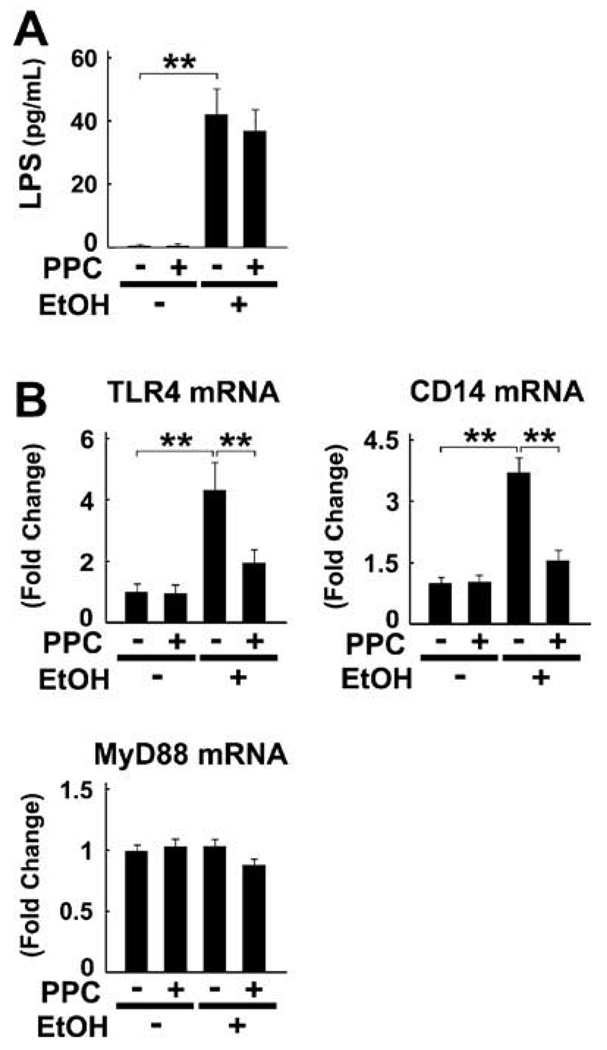
Since gut-derived LPS is also known to be a potent activator of NF-κB, the effect of PPC on portal LPS concentrations was examined. These concentrations were raised by the end of the treatment period in ethanol-fed mice, but were not improved by PPC (Fig. 7A). On the other hand, PPC suppressed ethanol-induced increases in mRNA levels of TLR4 and CD14 (Fig. 7B). The mRNA levels of myeloid differentiation factor 88 (MyD88), an essential adapter molecule that combines with TLR4/CD14, remained unchanged in all groups (Fig. 7B). PPC appears to prevent ethanol-induced amplification of the LPS-mediated signaling pathway.
Fig. 7.
Ethanol-induced increases in TLR4/CD14 were suppressed by PPC treatment in Ppara−/− mice. (A) Portal LPS concentrations. **P < 0.01. (B) Levels of mRNA of genes associated with the LPS-mediated signaling pathway. Results are expressed as mean ± SD (n = 6/ group). **P < 0.01.
3.7. Effect of PPC on hepatocyte apoptosis
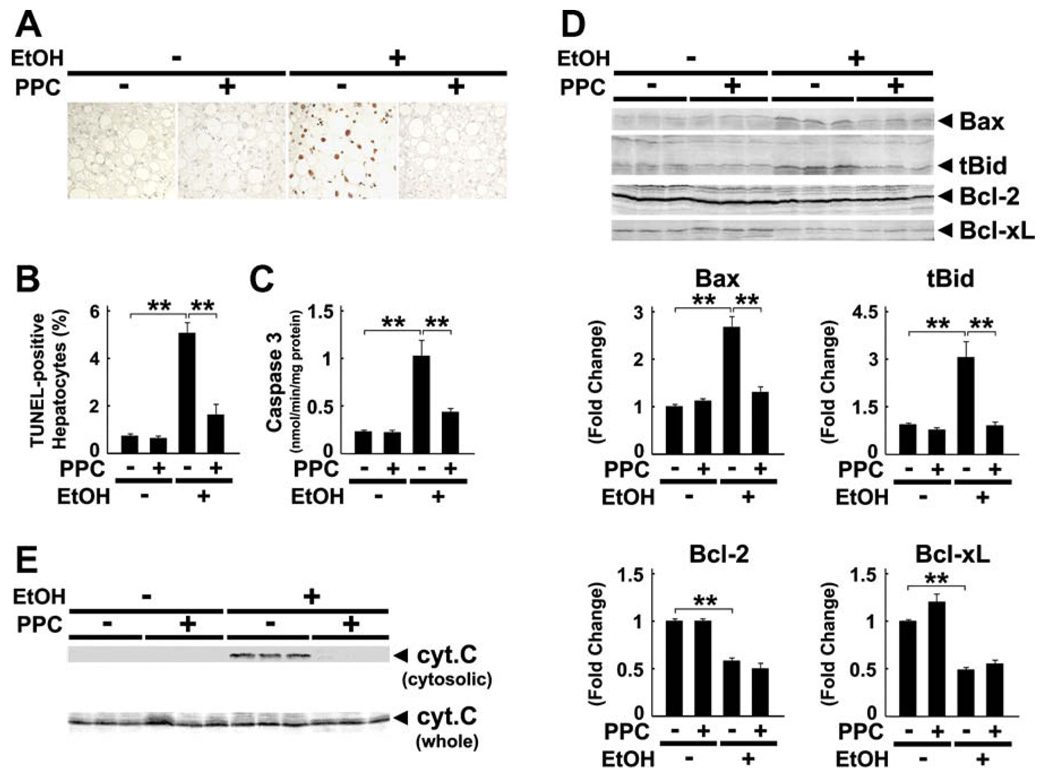
PPC significantly decreased the number of TUNEL-positive hepatocytes and caspase 3 activity in ethanolfed mice (Fig. 8A–C). PPC also suppressed increases in Bax and truncated Bid (Fig. 8D) and blocked activation of mitochondrial permeability transition (MPT), as revealed by the absence of cytochrome c leakage to the cytoplasm (Fig. 8E). In contrast, PPC did not influence the expression of anti-apoptotic proteins, such as Bcl-2 and Bcl-xL (Fig. 8D).
Fig. 8.
Ethanol-induced hepatocyte apoptosis was prevented by PPC treatment in Ppara−/− mice. (A and B) Apoptotic hepatocytes as determined by TUNEL staining. Two-hundred hepatocytes were examined for each section, and the number of TUNEL-positive hepatocytes was expressed as a percentage. Results are expressed as mean ± SD (n = 6/group). **P < 0.01. (C) Activity of caspase 3. **P < 0.01. (D) Immunoblot analysis of apoptosis-related proteins. The same samples in Fig. 3D (whole liver lysate, 50 µg of protein) were used. The bands shown are representative of four independent experiments. Band intensity was quantified densitometrically, normalized to that of actin, and subsequently normalized to that in control Ppara−/− mice. Results are expressed as mean ± SD (n = 6/group). tBid, truncated Bid; **P < 0.01. (E) Immunoblot analysis of cytochrome c (cyt. c). The same samples used in Fig. 3D (whole liver lysate, 50 µg of protein) and Fig. 6B (cytosolic fraction, 100 µg of protein) were adopted. Results are representative of four independent experiments.
3.8. Effect of PPC on hepatic fibrosis
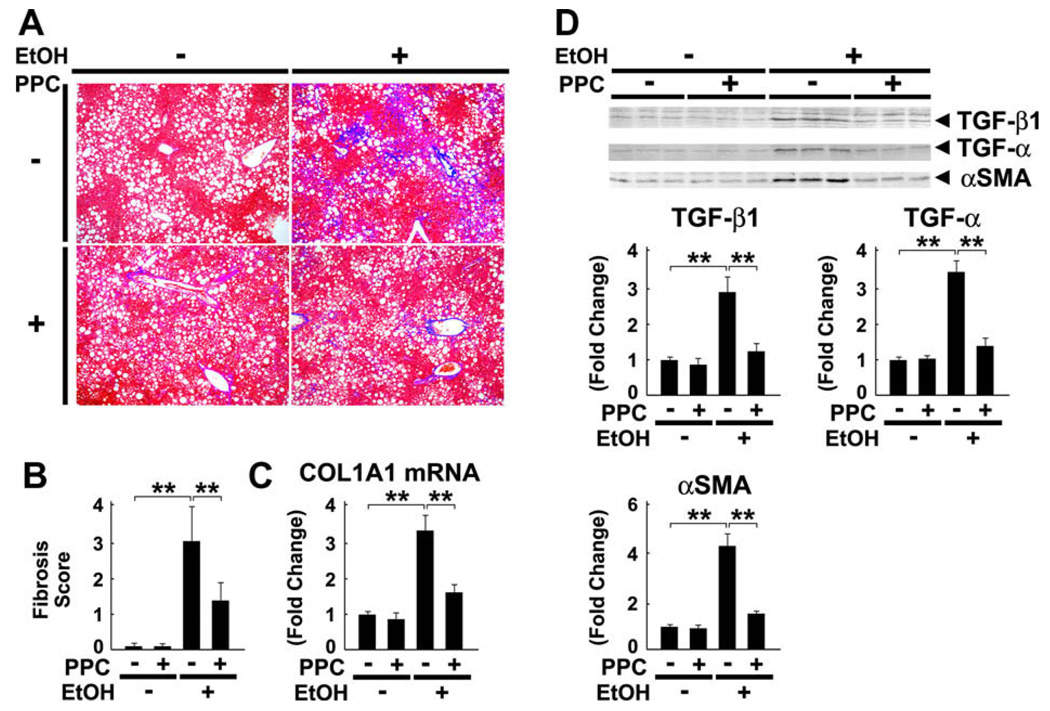
Lastly, PPC inhibited perisinusoidal fibrosis in chronically ethanol-administered mice (Fig. 9A and B). This finding was corroborated by quantification of collagen type 1 α1 (COL1A1) mRNA levels (Fig. 9C). PPC also inhibited ethanol-induced increases in the expression of pro-fibrotic cytokines transforming growth factor-β1 (TGF-β1) and TGF-α, as well as that of α-smooth muscle actin (αSMA), an indicator of hepatic stellate cell activation (Fig. 9D). Taken together, these results demonstrate that PPC exhibited an anti-fibrotic effect against ALD.
Fig. 9.
Ethanol-induced hepatic fibrosis was alleviated by PPC treatment in Ppara−/− mice. (A and B) Liver sections were subjected to Azan-Mallory staining and the degree of fibrosis was assessed according to the grading system described in Section 2. Results are expressed as mean ± SD (n = 6/group). **P < 0.01. (C) Levels of COL1A1 mRNA. COL1A1 mRNA levels were normalized to those of GAPDH and subsequently normalized to those in control Ppara−/− mice. **P < 0.01. (D) Immunoblot analysis of molecules contributing to fibrogenesis. The same samples in Fig. 3D (whole liver lysate, 50 µg of protein) were used. The bands shown are representative of four independent experiments. Band intensity was quantified densitometrically, normalized to that of actin, and subsequently normalized to that in control Ppara−/− mice. Results are expressed as mean ± SD (n = 6/group). **P < 0.01.
4. Discussion
The present study characterized the diverse hepato-protective effects of PPC on ALD in Ppara−/− mice. Namely, we identified a novel and unique mechanism involving attenuation of hepatic ROS generation through down-regulation of CYP2E1, AOX, NOX-2, and NOX-4. Such action differs from that of well-known anti-oxidants tocopherol and S-adenosyl methionine, which restores glutathione content [1,20]. The peculiar properties of PPC to inhibit ROS production are considered to be essential in the down-regulation of several signal transduction pathways activated by ethanol, i.e., ROS-PKC-PI3K-NF-κB, ROS-ASK1-p38 MAPK, ROS-TLR4/CD14, and ROS-Bax/tBid-MPT activation. These findings enabled us to propose detailed mechanisms of the anti-oxidant effect of PPC.
Chronic ethanol exposure leads to a metabolic shift from ADH to CYP2E1 in the liver, which is largely responsible for the overproduction of ROS [1–3]. Our results demonstrated that ethanol significantly increased hepatic CYP2E1 expression at the post-transcriptional level in mice. Chronic ethanol consumption is also known to cause protein accumulation in hepatocytes because of decreased protein-catabolizing ability in proteasomes [21]. Considering that there was an inverse correlation between proteasomal activity and hepatic amounts of lipid peroxides [22], as well as the fact that decreases in proteasomal activity were not detected in ethanol-fed CYP2E1-knockout mice [23], we can speculate that CYP2E1-derived oxidative stress plays an essential role in proteasomal dysfunction in ALD. Since CYP2E1 itself is also degraded by proteasomes [24], ethanol-induced oxidative stress may down-regulate the proteasomal degradation pathway and increase CYP2E1 expression, thus further overproducing ROS. The finding that PPC can discontinue this vicious cycle is consistent with recent evidence that choline facilitates proteasomal degradation of phosphoethanolamine methyltransferase [25]. However, it remains to be elucidated how either PPC or choline improves proteasomal activity.
A novel and unexpected result in this study was that AOX mRNA levels, encoding a rate-limiting enzyme in the peroxisomal β-oxidation pathway, were increased in ethanol-fed Ppara−/− mice but normalized by PPC. The same alterations were confirmed in the expression of other peroxisomal enzymes, such as peroxisomal hydratase and thiolase (data not shown). Since these enzymes are known to be induced by PPARα activation [4], it is plausible that PPARα-independent mechanisms also exist to induce such enzymes [26]. Indeed, Latruffe et al. previously showed that PKC activation might be associated with increases in mRNA levels of peroxisomal β-oxidation enzymes [27]. PKC was markedly phosphorylated in ethanol-treated Ppara−/− mice, implying that ethanol-derived ROS may have activated PKC resulting in induction of AOX in a PPARα-independent manner, thus generating further ROS. Therefore, we believe that PPC reduces CYP2E1-derived ROS, prevents activation of PKC, and possibly inhibits overexpression of AOX.
The observation that PPC inhibits NF-κB activation is consistent with the previous result that dilinoleoylphosphatidylcholine decreases acetaldehyde-induced NF-κB activation and TNF-α generation in isolated Kupffer cells [9]. NF-κB activated by ROS and acetaldehyde induces the enhancement of NOX-2 expression, whose gene contains an NF-κB response element in its promoter region [28]. Furthermore, NF-κB activation can induce the expression of iNOS, another major source of ROS. Therefore, activated NF-κB strongly amplifies generation of ROS, which further activates oxidative stress-responsive transcriptional factors, including NF-κB itself and activator protein 1 (AP-1). PPC is presumed to block this harmful spiral.
PPC did not decrease portal concentrations of LPS, suggesting only a minor contribution to gut flora and integrity of the intestinal mucosal barrier. On the other hand, we found for the first time that PPC significantly suppressed increases in TLR4/CD14 expression, which probably prevented amplification of LPS-mediated signals by ethanol. The transcriptional activity of TLR4/ CD14 is enhanced by NF-κB and/or AP-1, whose binding sites are found in the promoter regions of both genes [29,30]. Moreover, induction of the TLR4 gene can also result from post-transcriptional stabilization of mRNA by activation of p38 MAPK [29]. Therefore, the suppressive effect of PPC on hepatic TLR4/CD14 levels seems to occur through the diminishment of oxidative stress.
COL1A1 and COL1A2 genes, encoding collagen type 1 α1 and α2 chains, respectively, are highly sensitive to ROS. The COL1A2 promoter possesses TGF-β1-, TNF-α-, and NF-κB-binding sites, and its transcription is reported to be activated through a lipid peroxidation-PKC-PI3K-NF-κB-driven mechanism [31]. Thus, PPC is suspected to inhibit collagen synthesis by reducing ROS, down-regulating TGF-β1, and inactivating the PKC-PI3K-NF-κB-mediated pathway.
It is quite noteworthy that PPC markedly corrected the increases in hepatic NOX-4 expression caused by chronic ethanol consumption. Because of trace amounts of NOX-4 in normal livers, little information has been available regarding the contribution of this NOX isoform to various liver diseases. However, a recent study demonstrated a central role in the process of TGF-βinduced hepatocyte apoptosis [32]. Furthermore, over-expression of NOX-4 was detected in the livers of human ALD [33]. Thus, down-regulation of NOX-4 by PPC is considered to be one of the molecular mechanisms of its anti-oxidant and anti-apoptotic properties.
It has been reported that the expression of molecules contributing to fibrogenesis (TGF-β1, COL1A1, and αSMA) and inflammation (MCP-1) was significantly up-regulated in human livers with alcoholic hepatitis, and was strongly correlated with disease severity [33]. Since these increases were also found in 4% ethanol-fed Ppara−/− mice, the mechanism documented in the present study might, at least in part, apply to human ALD. Although there was a trend towards improvement of serum ALT levels in PPC-treated groups in a long-term trial in patients with alcoholic cirrhosis, the full spectrum of PPC benefits have not been evaluated appropriately because of the dramatic reduction in alcohol consumption in the treated and placebo groups [34]. Thus, PPC might deserve re-examination for its efficacy in patients with alcoholic hepatitis, especially in non-cirrhotic ones.
In conclusion, we were able to uncover the precise mechanism of PPC in the amelioration of ethanol-induced oxidative stress, which was distinct from other anti-oxidants. These data raise the possibility that PPC might be beneficial in chronic liver diseases associated with increased oxidative stress, including ALD, nonalcoholic steatohepatitis, and chronic hepatitis C [35,36]. Further studies are needed to confirm the efficacy of PPC against these diseases.
Supplementary Material
Acknowledgement
We thank Trevor Ralph for his editorial assistance.
Abbreviations
- ADH
alcohol dehydrogenase
- ALDH
aldehyde dehydrogenase
- AOX
acyl-coenzyme A oxidase
- AP-1
activator protein-1
- ASK1
apoptosis signal-regulating kinase 1
- COL1A1
collagen type 1 α1
- COX-2
cyclo-oxygenase 2
- CYP2E1
cytochrome P450 2E1
- GAPDH
glyceraldehyde-3-phosphate dehydrogenase
- GPx
glutathione peroxidase
- 4-HNE
4-hydroxynonenal
- ICAM-1
intercellular adhesion molecule-1
- IκB
inhibitor of NF-κB
- IL-1β
interleukin-1β
- iNOS
inducible nitric oxide synthase
- MAPK
mitogen-activated protein kinase
- MCP-1
monocyte chemotactic protein-1
- MDA
malondialdehyde
- MPT
mitochondrial permeability transition
- MyD88
myeloid differentiation factor 88
- NF-κB
nuclear factor-κB
- NOX
nonphagocytic oxidase
- PI3K
phosphatidylinositol-3 kinase
- PPC
polyenephosphatidylcholine
- SDS-PAGE
sodium dodecyl sulfate-polyacrylamide gel electrophoresis
- αSMA
α smooth muscle actin
- SD
standard deviation
- SOD
superoxide dismutase
- TNF-α
tumor necrosis factor-α
- TUNEL
terminal deoxynucleotidyl transferase-mediated deoxyuridine triphosphate nick-end labeling
Appendix A. Supplementary data
Supplementary data associated with this article can be found, in the online version, at doi:10.1016/j.jhep. 2009.01.025.
Footnotes
The authors who have taken part in this study declared that they do not have anything to disclose regarding funding or conflict of interest with respect to this manuscript.
References
- 1.Tilg H, Day CP. Management strategies in alcoholic liver disease. Nat Clin Pract Gastroenterol Hepatol. 2007;4:24–34. doi: 10.1038/ncpgasthep0683. [DOI] [PubMed] [Google Scholar]
- 2.Lieber CS. Alcoholic fatty liver: its pathogenesis and mechanism of progression to inflammation and fibrosis. Alcohol. 2004;34:9–19. doi: 10.1016/j.alcohol.2004.07.008. [DOI] [PubMed] [Google Scholar]
- 3.Seitz HK, Lieber CS, Stickel F, Salaspuro M, Schlemmer HP, Horie Y. Alcoholic liver disease: from pathophysiology to therapy. Alcohol Clin Exp Res. 2005;29:1276–1281. doi: 10.1097/01.alc.0000171896.37022.f7. [DOI] [PubMed] [Google Scholar]
- 4.Aoyama T, Peters JM, Iritani N, Nakajima T, Furihata K, Hashimoto T, et al. Altered constitutive expression of fatty acid-metabolizing enzymes in mice lacking the peroxisome proliferator-activated receptor α (PPARα) J Biol Chem. 1998;273:5678–5684. doi: 10.1074/jbc.273.10.5678. [DOI] [PubMed] [Google Scholar]
- 5.Galli A, Pinaire J, Fischer M, Dorris R, Crabb DW. The transcriptional and DNA binding activity of peroxisome proliferator-activated receptor α is inhibited by ethanol metabolism. A novel mechanism for the development of ethanol-induced fatty liver. J Biol Chem. 2001;276:68–75. doi: 10.1074/jbc.M008791200. [DOI] [PubMed] [Google Scholar]
- 6.Fischer M, You M, Matsumoto M, Crabb DW. Peroxisome proliferator-activated receptor α (PPAR α) agonist treatment reverses PPAR α dysfunction and abnormalities in hepatic lipid metabolism in ethanol-fed mice. J Biol Chem. 2003;278:27997–28004. doi: 10.1074/jbc.M302140200. [DOI] [PubMed] [Google Scholar]
- 7.Nakajima T, Kamijo Y, Tanaka N, Sugiyama E, Tanaka E, Kiyosawa K, et al. Peroxisome proliferator-activated receptor α protects against alcohol-induced liver damage. Hepatology. 2004;40:972–980. doi: 10.1002/hep.20399. [DOI] [PubMed] [Google Scholar]
- 8.Lieber CS, Robins SJ, Li J, DeCarli LM, Mak KM, Fasulo JM, et al. Phosphatidylcholine protects against fibrosis and cirrhosis in the baboon. Gastroenterology. 1994;106:152–159. doi: 10.1016/s0016-5085(94)95023-7. [DOI] [PubMed] [Google Scholar]
- 9.Cao Q, Mak KM, Lieber CS. Dilinoleoylphosphatidylcholine decreases acetaldehyde-induced TNF-α generation in Kupffer cells of ethanol-fed rats. Biochem Biophys Res Commun. 2002;299:459–464. doi: 10.1016/s0006-291x(02)02672-4. [DOI] [PubMed] [Google Scholar]
- 10.Cao Q, Mak KM, Lieber CS. DLPC and SAMe combined prevent leptin-stimulated TIMP-1 production in LX-2 human hepatic stellate cells by inhibiting H2O2-mediated signal transduction. Liver Int. 2006;26:221–231. doi: 10.1111/j.1478-3231.2005.01204.x. [DOI] [PubMed] [Google Scholar]
- 11.Lee SS, Pineau T, Drago J, Lee EJ, Owens JW, Kroetz DL, et al. Targeted disruption of the α isoform of the peroxisome proliferator- activated receptor gene in mice results in abolishment of the pleiotropic effects of peroxisome proliferators. Mol Cell Biol. 1995;15:3012–3022. doi: 10.1128/mcb.15.6.3012. [DOI] [PMC free article] [PubMed] [Google Scholar]
- 12.Tanaka N, Moriya K, Kiyosawa K, Koike K, Aoyama T. Hepatitis C virus core protein induces spontaneous and persistent activation of peroxisome proliferator-activated receptor α in transgenic mice: implications for HCV-associated hepatocarcino-genesis. Int J Cancer. 2008;122:124–131. doi: 10.1002/ijc.23056. [DOI] [PubMed] [Google Scholar]
- 13.Aoyama T, Uchida Y, Kelley RI, Marble M, Hofman K, Tonsgard JH, et al. A novel disease with deficiency of mitochondrial very-long-chain acyl-CoA dehydrogenase. Biochem Biophys Res Commun. 1993;191:1369–1372. doi: 10.1006/bbrc.1993.1368. [DOI] [PubMed] [Google Scholar]
- 14.Aoyama T, Souri M, Ushikubo S, Kamijo T, Yamaguchi S, Kelley RI, et al. Purification of human very-long-chain acylcoenzyme A dehydrogenase and characterization of its deficiency in seven patients. J Clin Invest. 1995;95:2465–2473. doi: 10.1172/JCI117947. [DOI] [PMC free article] [PubMed] [Google Scholar]
- 15.Tanaka N, Hora K, Makishima H, Kamijo Y, Kiyosawa K, Gonzalez FJ, et al. In vivo stabilization of nuclear retinoid X receptor α in the presence of peroxisome proliferator-activated receptor α. FEBS Lett. 2003;543:120–124. doi: 10.1016/s0014-5793(03)00423-x. [DOI] [PubMed] [Google Scholar]
- 16.Nakajima T, Tanaka N, Sugiyama E, Kamijo Y, Hara A, Hu R, et al. Cholesterol-lowering effect of bezafibrate is independent of peroxisome proliferator-activated receptor activation in mice. Biochem Pharmacol. 2008;76:108–119. doi: 10.1016/j.bcp.2008.04.001. [DOI] [PubMed] [Google Scholar]
- 17.Nanji AA, Jokelainen K, Rahemtulla A, Miao L, Fogt F, Matsumoto H, et al. Activation of nuclear factor-κB and cytokine imbalance in experimental alcoholic liver disease in the rat. Hepatology. 1999;30:934–943. doi: 10.1002/hep.510300402. [DOI] [PubMed] [Google Scholar]
- 18.Gong P, Cederbaum AI, Nieto N. Increased expression of cytochrome P450 2E1 induces heme oxygenase-1 through ERK MAPK pathway. J Biol Chem. 2003;278:29693–29700. doi: 10.1074/jbc.M304728200. [DOI] [PubMed] [Google Scholar]
- 19.Folch J, Lees M, Sloane Stanley GH. A simple method for the isolation and purification of total lipides from animal tissues. J Biol Chem. 1957;226:497–509. [PubMed] [Google Scholar]
- 20.Altavilla D, Marini H, Seminara P, Squadrito G, Minutoli L, Passaniti M, et al. Protective effects of antioxidant raxofelast in alcohol-induced liver disease in mice. Pharmacology. 2005;74:6–14. doi: 10.1159/000082939. [DOI] [PubMed] [Google Scholar]
- 21.Donohue JM, Jr, Cederbaum AI, French SW, Barve S, Gao B, Osna NA. Role of the proteasome in ethanol-induced liver pathology. Alcohol Clin Exp Res. 2007;31:1446–1459. doi: 10.1111/j.1530-0277.2007.00454.x. [DOI] [PubMed] [Google Scholar]
- 22.Fataccioli V, Andraud E, Gentil M, French SW, Rouach H. Effects of chronic ethanol administration on rat liver proteasome activities: relationship with oxidative stress. Hepatology. 1999;29:14–20. doi: 10.1002/hep.510290106. [DOI] [PubMed] [Google Scholar]
- 23.Bardag-Gorce F, Yuan QX, Li J, French BA, Fang C, Ingelman-Sundberg M, et al. The effect of ethanol-induced cytochrome p4502E1 on the inhibition of proteasome activity by alcohol. Biochem Biophys Res Commun. 2000;279:23–29. doi: 10.1006/bbrc.2000.3889. [DOI] [PubMed] [Google Scholar]
- 24.Goasduff T, Cederbaum AI. NADPH-dependent microsomal electron transfer increases degradation of CYP2E1 by the proteasome complex: role of reactive oxygen species. Arch Biochem Biophys. 1999;370:258–270. doi: 10.1006/abbi.1999.1399. [DOI] [PubMed] [Google Scholar]
- 25.Witola WH, Ben Mamoun C. Choline induces transcriptional repression and proteasomal degradation of the malarial phosphoethanolamine methyltransferase. Eukaryot Cell. 2007;6:1618–1624. doi: 10.1128/EC.00229-07. [DOI] [PMC free article] [PubMed] [Google Scholar]
- 26.Zhang X, Tanaka N, Nakajima T, Kamijo Y, Gonzalez FJ, Aoyama T. Peroxisome proliferator-activated receptor α-independent peroxisome proliferation. Biochem Biophys Res Commun. 2006;346:1307–1311. doi: 10.1016/j.bbrc.2006.06.042. [DOI] [PubMed] [Google Scholar]
- 27.Latruffe N, Cherkaoui Malki M, Nicolas-Frances V, Clemencet MC, Jannin B, Berlot JP. Regulation of the peroxisomal β-oxidation-dependent pathway by peroxisome proliferator-activated receptor α and kinases. Biochem Pharmacol. 2000;60:1027–1032. doi: 10.1016/s0006-2952(00)00416-0. [DOI] [PubMed] [Google Scholar]
- 28.Anrather J, Racchumi G, Iadecola C. NF-κB regulates phagocytic NADPH oxidase by inducing the expression of gp91phox. J Biol Chem. 2006;281:5657–5667. doi: 10.1074/jbc.M506172200. [DOI] [PubMed] [Google Scholar]
- 29.Yan ZQ. Regulation of TLR4 expression is a tale about tail. Arterioscler Thromb Vasc Biol. 2006;26:2582–2584. doi: 10.1161/01.ATV.0000250933.92917.dd. [DOI] [PubMed] [Google Scholar]
- 30.Wheeler MD, Thurman RG. Up-regulation of CD14 in liver caused by acute ethanol involves oxidant-dependent AP-1 pathway. J Biol Chem. 2003;278:8435–8441. doi: 10.1074/jbc.M212076200. [DOI] [PubMed] [Google Scholar]
- 31.Nieto N. Ethanol and fish oil induce NFκB transactivation of the collagen α2 (I) promoter through lipid peroxidation-driven activation of the PKC-PI3K-Akt pathway. Hepatology. 2007;45:1433–1445. doi: 10.1002/hep.21659. [DOI] [PubMed] [Google Scholar]
- 32.Carmona-Cuenca I, Roncero C, Sancho P, Caja L, Fausto N, Fernandez M, et al. Upregulation of the NADPH oxidase NOX4 by TGF-beta in hepatocytes is required for its pro-apoptotic activity. J Hepatol. 2008;49:965–976. doi: 10.1016/j.jhep.2008.07.021. [DOI] [PubMed] [Google Scholar]
- 33.Colmenero J, Bataller R, Sancho-Bru P, Bellot P, Miquel R, Moreno M, et al. Hepatic expression of candidate genes in patients with alcoholic hepatitis: correlation with disease severity. Gastroenterology. 2007;132:687–697. doi: 10.1053/j.gastro.2006.12.036. [DOI] [PubMed] [Google Scholar]
- 34.Lieber CS, Weiss DG, Groszmann R, Paronetto F, Schenker S Veterans Affairs Cooperative Study 391 Group. Veterans Affairs Cooperative Study of polyenylphosphatidylcholine in alcoholic liver disease. Alcohol Clin Exp Res. 2003;27:1765–1772. doi: 10.1097/01.ALC.0000093743.03049.80. [DOI] [PubMed] [Google Scholar]
- 35.Tanaka N, Sano K, Horiuchi A, Tanaka E, Kiyosawa K, Aoyama T. Highly purified eicosapentaenoic acid treatment improves nonalcoholic steatohepatitis. J Clin Gastroenterol. 2008;42:413–418. doi: 10.1097/MCG.0b013e31815591aa. [DOI] [PubMed] [Google Scholar]
- 36.Tanaka N, Moriya K, Kiyosawa K, Koike K, Gonzalez FJ, Aoyama T. PPARα activation is essential for HCV core protein-induced hepatic steatosis and hepatocellular carcinoma in mice. J Clin Invest. 2008;119:683–694. doi: 10.1172/JCI33594. [DOI] [PMC free article] [PubMed] [Google Scholar]
Associated Data
This section collects any data citations, data availability statements, or supplementary materials included in this article.


