At 3.0 T, the magnetization-prepared rapid acquisition gradient-echo MR sequence appears to have higher diagnostic capability for the detection and quantification of relatively large intraplaque hemorrhages compared with the fast spin-echo and time-of-flight sequences.
Abstract
Purpose:
To compare the diagnostic performances of three T1-weighted 3.0-T magnetic resonance (MR) sequences at carotid intraplaque hemorrhage (IPH) imaging, with histo logic analysis as the reference standard.
Materials and Methods:
Institutional review board approval and informed consent were obtained for this HIPAA-compliant study. Twenty patients scheduled for carotid endarterectomy underwent 3.0-T carotid MR imaging, including two-dimensional fast spin-echo, three-dimensional time-of-flight (TOF), and three-dimensional magnetization-prepared rapid acquisition gradient-echo (RAGE) sequences. Two reviewers blinded to the histologic findings assessed the presence, area, and signal intensity of IPH with each sequence. Detection statistics (sensitivity, specificity, and Cohen κ values) and agreement between area measurements (Pearson correlation coefficient [r] values) were calculated for each sequence.
Results:
When all 231 available MR sections were included for analysis, the magnetization-prepared RAGE (κ = 0.53) and fast spin-echo (κ = 0.42) sequences yielded moderate agreement between MR and histologic measurements, while the TOF sequence yielded fair agreement (k = 0.33). However, when 47 sections with either small IPHs or heavily calcified IPHs were excluded, sensitivity, specificity, and κ values, respectively, were 80%, 97%, and 0.80 for magnetization-prepared RAGE imaging; 70%, 92%, and 0.63 for fast spin-echo imaging; and 56%, 96%, and 0.57 for TOF imaging. MR imaging–histologic analysis correlation for IPH area was highest with magnetization-prepared RAGE imaging (r = 0.813), followed by TOF (r = 0.745) and fast spin-echo (r = 0.497) imaging. The capability of these three sequences for IPH detection appeared to be in good agreement with the quantitative contrast of IPH versus background plaque tissue.
Conclusion:
The magnetization-prepared RAGE sequence, as compared with the fast spin-echo and TOF sequences, demonstrated higher diagnostic capability for the detection and quantification of IPH. Potential limitations of 3.0-T IPH MR imaging are related to hemorrhage size and coexisting calcification.
© RSNA, 2010
Introduction
Intraplaque hemorrhage (IPH) is thought to be a critical entity in the progression of atherosclerosis because of the potent atherogenic stimulus created by the accumulation of cholesterol-rich erythrocyte membranes (1). High-spatial-resolution magnetic resonance (MR) imaging is recognized as a reliable method for the comprehensive characterization of atherosclerotic plaque tissue composition and the identification of IPH in particular (2–8). Carotid IPH identified at in vivo MR imaging has been shown to have strong associations with recent and future cerebrovascular ischemic events and with plaque progression (9–16). T1-weighted MR sequences are commonly used to detect IPH owing to the degradation of hemorrhage into methemoglobin, which results in T1 shortening (2) and correspondingly causes high signal intensity on T1-weighted MR images. Among the T1-weighted MR sequences, a black-blood fast spin-echo sequence with a relatively short repetition time and a bright-blood spoiled gradient-echo sequence routinely used for three-dimensional (3D) time-of-flight (TOF) angiography are currently used for clinical examinations (3,4,9–11,17). An alternative technique proposed for IPH detection is based on a heavily T1-weighted 3D magnetization-prepared rapid acquisition gradient-echo (RAGE) sequence, which for this application is termed direct thrombus imaging by Moody et al (2) and others (12–15,18). All of these MR techniques have been optimized for and extensively used at 1.5 T.
A new generation of 3.0-T MR imagers is currently being used in clinical radiology. High-spatial-resolution carotid plaque imaging at 3.0 T demonstrates substantial improvements in signal-to-noise ratio (SNR), contrast-to-noise ratio (CNR), and image quality compared with 1.5-T carotid plaque imaging (19,20). However, it has been shown that with use of T1-weighted fast spin-echo and 3D TOF sequences, an increased susceptibility for paramagnetic ferric iron in hemorrhage may degrade the quantification and/or detection of hemorrhage at 3.0 T compared with the quantification and/or detection at 1.5 T (19). A 3D magnetization-prepared RAGE sequence was recently optimized for IPH imaging at 3.0 T (21). However, no study had been performed to determine the effectiveness of this pulse sequence for IPH detection and quantification.
Thus, the purpose of this study was to prospectively compare the diagnostic performance of three T1-weighted sequences—two-dimensional fast spin echo, 3D TOF, and 3D magnetization-prepared RAGE—in the detection and quantification of IPH at 3.0 T, with histologic analysis as the reference standard.
Materials and Methods
This study was supported in part by grants from Bracco Diagnostics (Princeton, New Jersey) and Pfizer (Groton, Conn). No authors were employees of these companies, and these companies had no control of the data or information submitted for publication. The period of funding for this project ended in 2007, precluding any further collection of data. This study was compliant with the Health Insurance Portability and Accountability Act and was approved by the institutional review boards of the University of Washington Medical Center (Seattle, Wash), VA Puget Sound Health Care System (Seattle, Wash), and Ingham Cardiothoracic & Vascular Surgeons (Lansing, Mich).
Patient Population
The patient population in our study, conducted from March 2006 to October 2007, comprised 38 consecutive patients who were scheduled for carotid endarterectomy at the University of Washington Medical Center, VA Puget Sound Health Care System, or Ingham Cardiothoracic & Vascular Surgeons. The indication for carotid endarterectomy was either asymptomatic, greater than 80% carotid artery stenosis or symptomatic, greater than 70% carotid artery stenosis. Patients were prospectively enrolled. Exclusion criteria were recurrent carotid stenosis, prior carotid stent placement, clinically required emergent surgery, presence of a coronary or peripheral artery stent that was not evaluated at 3.0-T MR imaging, claustrophobia, weight too heavy (>109 kg) for MR imaging, other contraindications to MR imaging, and no interest in participation.
Of the 38 patients, three (8%) had stents that were not evaluated at 3.0-T MR Imaging, two (5%) needed emergent surgery, one (3%) weighed too much to undergo MR imaging, and 12 (32%) were not interested in participating in the study. Accordingly, 20 patients (mean age, 67.7 years ± 10.8 [standard deviation]; age range, 49–85 years) were recruited: 16 (80%) men (mean age, 69.2 years ± 10.5; age range, 50–85 years) and four (20%) women (mean age, 61.5 years ± 11.4; age range, 49–76 years). The patients signed informed consent forms at each facility.
MR Imaging Protocol
Fifteen (75%) of the 20 patients were from Ingham Cardiothoracic & Vascular Surgeons and were imaged with a 3.0-T whole-body MR imager (Signa Excite; GE Health Care, Waukesha, Wis) and a four-channel phased-array surface coil (Pathway MRI, Seattle, Wash) at Michigan State University (site 1). The remaining five (25%) patients were imaged at the Bio-Molecular Imaging Center, University of Washington (site 2), with another 3.0-T imager (Achieva; Philips Medical Systems, Best, the Netherlands) and the same four-channel phased-array surface coil. These five patients were recruited from the University of Washington Medical Center and the VA Puget Sound Health Care System.
Similar MR imaging protocols, which included transverse two-dimensional T1-weighted fast spin-echo, 3D TOF, and 3D magnetization-prepared RAGE sequences, were used at both sites. The fast spin-echo and TOF sequence parameters used were similar to those previously reported (19,20), while the magnetization-prepared RAGE sequence was implemented according to a more recently described design (21). No cardiac gating was used, as this has been reported to facilitate no improvement in image quality (22) and might have resulted in a considerable increase in imaging time. The details of the MR imaging protocols used are listed in Table 1.
Table 1.
Parameters Used for Carotid IPH MR Imaging
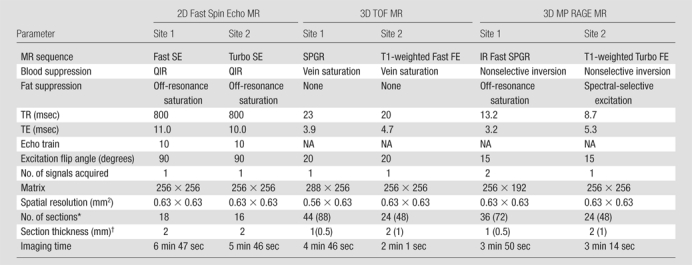
Note.—A field of view of 160 × 160 mm was used for all MR examinations. FE = field echo, IR = inversion recovery, MP = magnetization prepared, NA = not applicable, QIR = quadruple inversion recovery (23), SE = spin echo, SPGR = spoiled gradient recalled echo, TE = echo time, TR = repetition time, 2D = two-dimensional.
Values in parentheses are the interpolated numbers of sections after zero-filled Fourier transform in the slab direction.
Values in parentheses are the interpolated section thicknesses after zero-filled Fourier transform in the slab direction.
MR Image Analysis
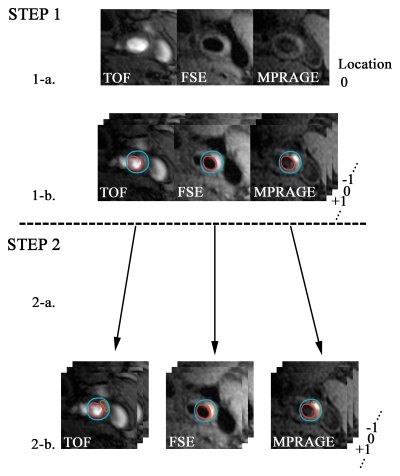
Image analysis was accomplished in two stages (Fig 1). In the first stage, two reviewers (H.O., and X.Z., both with 2 years experience in carotid MR imaging) registered the three sets of T1-weighted MR images by using the bifurcation of the carotid artery as the point of consensus. The reviewers then outlined the lumen and outer wall boundaries of the carotid arteries by using a semiautomated vessel wall analysis algorithm (CASCADE [computer-aided system for cardiovascular disease evaluation], developed by the Vascular Imaging Laboratory at the University of Washington, Seattle, Wash) (24). In the second stage, months after completion of the first stage, the resulting data sets were randomized and a second group of reviewers (H.O., H.R.U. [6 years experience in carotid MR imaging]) outlined the regions of high signal intensity identified with the three sequences. The reviewers were blinded to the sequence, histologic findings, and clinical information. An image quality score was also assigned to each location. An image quality score of 1 indicated poor quality: The arterial wall and lumen margins were not identifiable. A score of 2 indicated adequate quality: The arterial wall was visible, but the compositional substructure was partially obscured. A score of 3 indicated good quality: Motion and flow artifacts were minimal, and the vessel wall and lumen boundaries were clearly defined. A score of 4 indicated excellent quality: No artifacts were seen, and the wall architecture and plaque composition were depicted in detail (19).
Figure 1:
Postprocessing of MR images obtained in 66-year-old man. In step 1-a, TOF, fast spin-echo (FSE), and magnetization-prepared RAGE (MPRAGE) images were registered on the basis of the bifurcation (Location 0). In step 1-b, the lumen (outlined in red) and the outer wall (outlined in blue) were outlined by using all three sequences together. In step 2-a, three separate data sets—of TOF, fast spin-echo, and magnetization-prepared RAGE image data—were acquired. In step 2-b, each set was reviewed, with blinding to the data for the other two sequences. Hemorrhage (outlined in orange) was outlined on each image. −1 = One level below the bifurcation, 0 = bifurcation, +1 = one level above the bifurcation.
The contours of the vessel wall, the plaque components, and the signal intensities of the regions presumed to be IPH were recorded and used to calculate the SNR, CNR, and contrast percentage in each location where IPH was identified. All noise measurements were sampled in the corners of images, outside anatomic structures and image artifacts. SNR was calculated as follows: SNR = [0.695 · (S m 2 – S n 2)1/2]/σ, where S m is the signal intensity magnitude for the tissue of interest (IPH or remaining plaque), S n is the signal intensity magnitude of noise, σ is the measured standard deviation of noise, and 0.695 is the coefficient of proportionality between the signal intensity magnitude of noise and the true standard deviation of noise for a four-array coil design (20,25). CNR was calculated as the difference between the SNRs of IPH and plaque (20). Contrast percentage (CP) was calculated as follows: CP = [(S IPH – S Pl)/S Pl] · 100, where S IPH is the signal magnitude of the IPH and S Pl is the signal magnitude of the remaining plaque (21).
Histologic Sample Processing and Review
The carotid endarterectomy specimens were fixed in 10% neutral buffered formalin within 4 hours after excision, decalcified in 10% formic acid, and embedded en bloc in paraffin. Sections (10 μm thick) were excised every 1.0 mm in the common carotid artery and every 0.5 mm in the internal carotid artery through the length of the specimen and stained with hematoxylin-eosin and Mallory trichrome. The histologic sections were examined by one of the authors (M.S.F., 19 years experience in carotid pathologic analysis), who was blinded to the MR image findings. The presence, absence, and size of the IPHs were recorded. In addition, if calcified fragments were present in the area of the IPH, the IPH was categorized as moderately (<50% of total IPH area calcified) or heavily (≥50% of total IPH area calcified) calcified. IPH and calcification were defined according to standard pathologic criteria (5,26–30). Calcified regions were identified on the basis of the characteristic purple rim at hematoxylin-eosin staining, which indicated residual deposits of calcium in surrounding tissues that were not removable by means of a standard decalcification procedure. In the cases of a disrupted specimen, the hemorrhage and calcium areas were estimated by using the composition of the remaining intact plaque for guidance.
Matching MR Images to Histologic Specimens
The histologic specimens were matched to the MR images by the author who examined the histologic specimens (M.S.F., 19 years experience in histologic specimen–MR image matching) and an MR image reviewer with 3 months experience in carotid MR imaging who was not otherwise involved in this study. The MR image data generated during the first stage of the MR image review process were used for MR image and histologic specimen matching. The two individuals performed the matching while blinded to the results of MR imaging IPH evaluation. Landmarks such as the relative distance from the common carotid bifurcation and morphologic features such as lumen size, lumen shape, and prominent calcifications were then used to match the MR images to the histologic specimens.
Given the difference in thickness between the MR image sections (2 mm) and the histologic cross sections (10 μm, every 0.5–1.0 mm), two to four histologic sections were compared with one cross-sectional MR image on the basis of the relative distance from the bifurcation. The average of areas for a given component per a matched MR image location was computed.
Statistical Analyses
With MR image section as the unit of observation, the sensitivity, specificity, and Cohen κ value derived with each sequence were evaluated, with histologic analysis as the reference standard across all matched locations. In considering the difference in spatial resolution between the histologic and MR image sections, we also calculated κ values after excluding sections in which the IPH area measured with histologic analysis was smaller than a specified cutoff value to evaluate detection statistics as a function of IPH size. Cutoff values were calculated before the analysis as the area (A) of a circle where the radius was an increment of the image spatial resolution (0.63 mm, Table 1): A = π · (0.63x)2, where x was 1.0, 1.5, 2.0, or 2.5 (yielding cutoff values of 1.25, 2.81, 4.99, or 7.79 mm2, respectively). To consider the possible influence of local calcification on the detection of IPH, we calculated the sensitivity, specificity, and κ values in subgroups after excluding sections with heavily calcified IPH. κ Values of 0.01–0.20 indicated slight agreement; 0.21–0.40, fair agreement; 0.41–0.60, moderate agreement; 0.61–0.80, good agreement; and 0.81–1.00, excellent agreement. To accommodate the use of multiple sections per artery, κ values and estimated standard errors were calculated by using the bootstrap method with 1000 samples each (31).
When those sections in which IPH was detected on all of the T1-weighted MR images were included, measurements of the SNR, CNR, and contrast percentage of IPH were compared between the three MR sequences by using repeated-measures analysis of variance with Bonferroni adjustment for post hoc comparisons.
The mean IPH for all the T1-weighted MR sequences and all the histologic specimens was calculated. Pearson correlation coefficients (r values) with estimated standard errors were used to determine associations between MR imaging and histologic measurements of IPH area. The paired t test was used to evaluate the difference between the IPH area measured with MR imaging and the IPH area measured with histologic analysis. Repeated-measures analysis of variance was used to compare image quality between the MR sequences.
These statistical computations were performed by using SPSS 16.0 (SPSS, Chicago, Ill) and R2.8.1 (R Foundation for Statistical Computing, Vienna, Austria) software. P < .05 indicated statistical significance.
Results
Demographic data for the study group are presented in Table 2. The mean time interval between MR imaging and carotid endarterectomy was 23.3 days ± 25.9 (standard deviation). No patient experienced new or recurrent symptoms between MR imaging and surgery.
Table 2.
Demographic Data of Study Patients
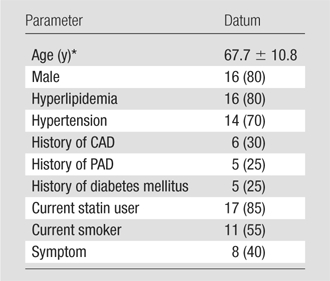
Note.—All data except age are numbers of patients (n = 20), with percentages in parentheses. CAD = coronary artery disease, PAD = peripheral artery disease.
Mean age ± standard deviation.
Review Results and Appearance of IPH
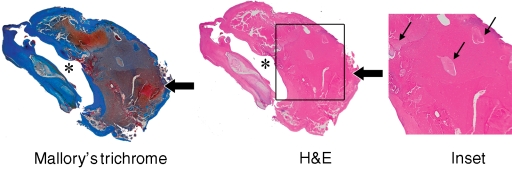
The 20 evaluated arteries (in 20 patients) yielded 231 MR sections matched to histologic specimens. Only four (20%) of the 20 artery specimens did not have IPH. Of the 231 sections, 97 (42%) showed IPH at histologic analysis, and 30 (31%) of these 97 sections showed IPH mixed with calcification. Fifteen of the 30 sections had IPH mixed with heavy calcification (occupying ≥50% of IPH area). IPH had variable appearances on the different T1-weighted images, with a more hyperintense signal on the magnetization-prepared RAGE images (Figs 2 , 3 ). The ability to visualize IPH with MR imaging was affected by coexisting calcification (Figs 2 –4 ).
Figure 2a:
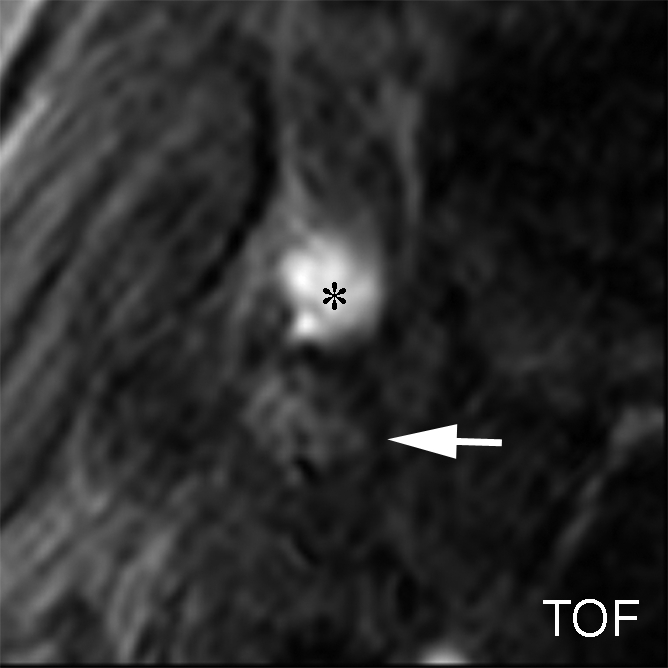
IPH with no mixed calcification at level of bifurcation of left carotid artery in 57-year-old man. (a–c) On T1-weighted MR images, area of high signal intensity (arrow) measures 16.4 mm2 on TOF image (20/4.7 [repetition time msec/echo time msec], 20° flip angle), 19.2 mm2 on fast spin-echo (FSE) image (800/10), and 18.0 mm2 on magnetization-prepared RAGE (MPRAGE) image (8.7/5.3, 15° flip angle). (d) On histologic specimen, outlined area of IPH measures 21.6 mm2. (Hematoxylin-eosin stain; original magnification, × 10.) * = Lumen.
Figure 2b:
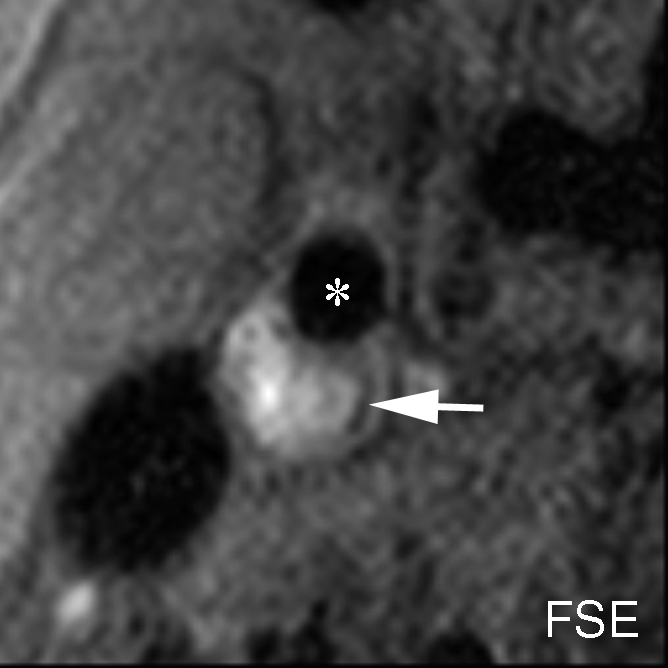
IPH with no mixed calcification at level of bifurcation of left carotid artery in 57-year-old man. (a–c) On T1-weighted MR images, area of high signal intensity (arrow) measures 16.4 mm2 on TOF image (20/4.7 [repetition time msec/echo time msec], 20° flip angle), 19.2 mm2 on fast spin-echo (FSE) image (800/10), and 18.0 mm2 on magnetization-prepared RAGE (MPRAGE) image (8.7/5.3, 15° flip angle). (d) On histologic specimen, outlined area of IPH measures 21.6 mm2. (Hematoxylin-eosin stain; original magnification, × 10.) * = Lumen.
Figure 2c:
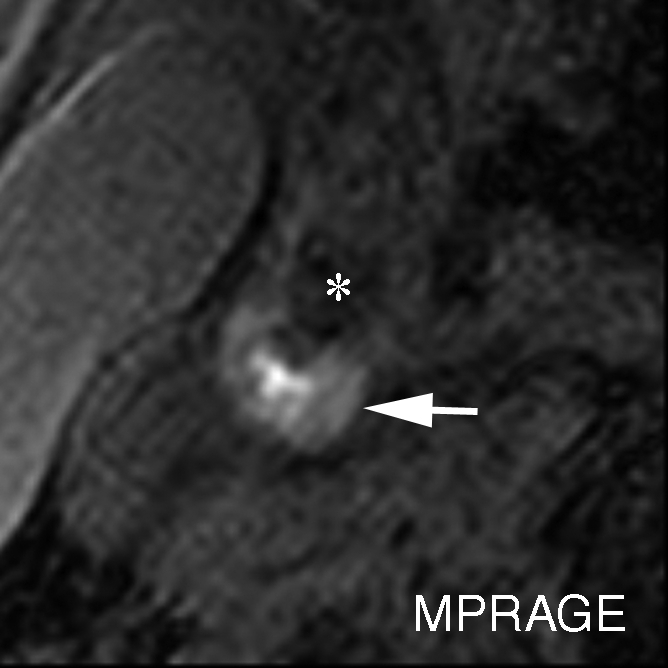
IPH with no mixed calcification at level of bifurcation of left carotid artery in 57-year-old man. (a–c) On T1-weighted MR images, area of high signal intensity (arrow) measures 16.4 mm2 on TOF image (20/4.7 [repetition time msec/echo time msec], 20° flip angle), 19.2 mm2 on fast spin-echo (FSE) image (800/10), and 18.0 mm2 on magnetization-prepared RAGE (MPRAGE) image (8.7/5.3, 15° flip angle). (d) On histologic specimen, outlined area of IPH measures 21.6 mm2. (Hematoxylin-eosin stain; original magnification, × 10.) * = Lumen.
Figure 2d:
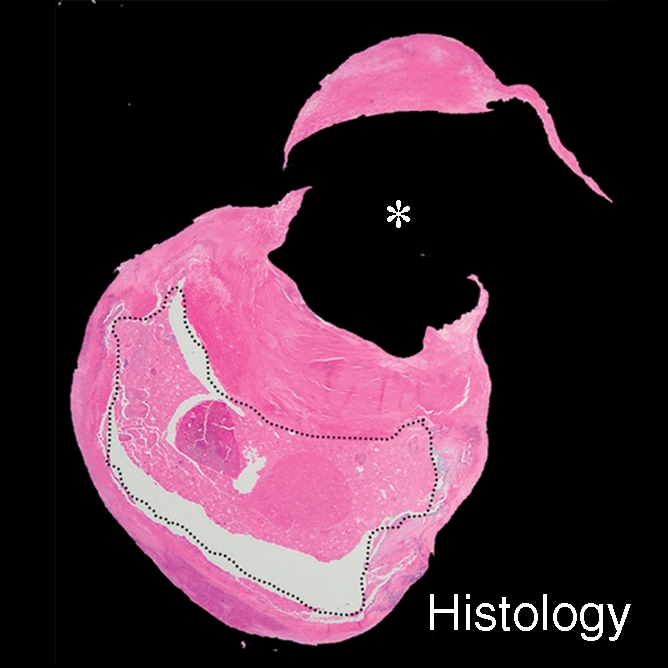
IPH with no mixed calcification at level of bifurcation of left carotid artery in 57-year-old man. (a–c) On T1-weighted MR images, area of high signal intensity (arrow) measures 16.4 mm2 on TOF image (20/4.7 [repetition time msec/echo time msec], 20° flip angle), 19.2 mm2 on fast spin-echo (FSE) image (800/10), and 18.0 mm2 on magnetization-prepared RAGE (MPRAGE) image (8.7/5.3, 15° flip angle). (d) On histologic specimen, outlined area of IPH measures 21.6 mm2. (Hematoxylin-eosin stain; original magnification, × 10.) * = Lumen.
Figure 3a:
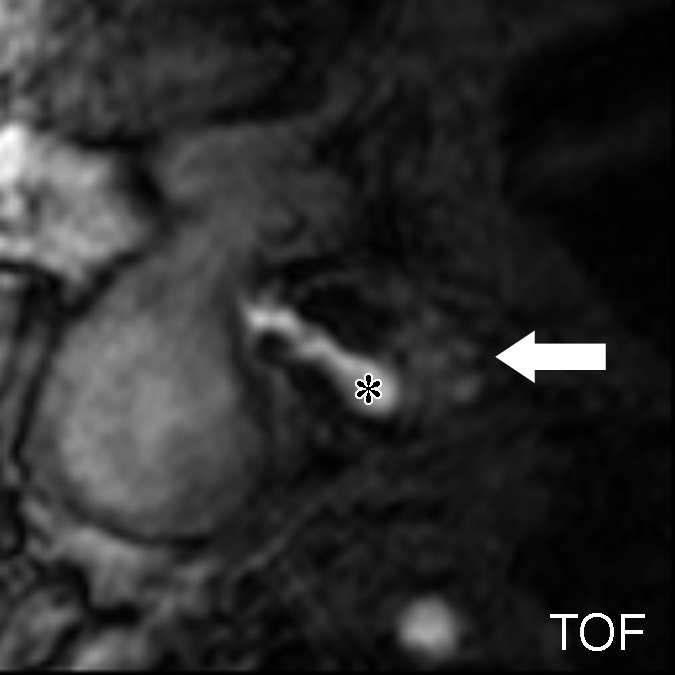
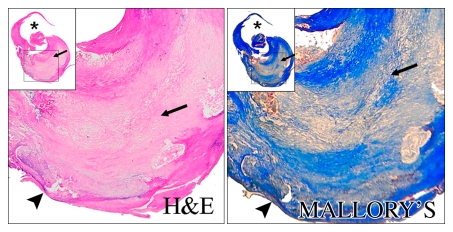
Moderately calcified IPH in left internal carotid artery in 75-year-old man. (a–c) On T1-weighted MR images, high-signal-intensity area (arrow) measures 15.8 mm2 on TOF image (23/3.5, 20° flip angle), 8.6 mm2 on fast spin-echo (FSE) image (800/11), and 24.8 mm2 on magnetization-prepared RAGE (MPRAGE) image (13.2/3.2, 15° flip angle). (d) Mallory trichrome–stained histologic specimen shows variable red staining pattern in necrotic core (arrow). (Original magnification, × 10.) Adjacent section stained with hematoxylin-eosin (H&E) shows large necrotic core (arrow) filled with IPH measuring 34.9 mm2. (Original magnification, × 10.) The inset is a magnified region of necrotic core (outlined in black) showing small fragments of calcification (arrows). (Original magnification, × 100.) * = Lumen.
Figure 3b:
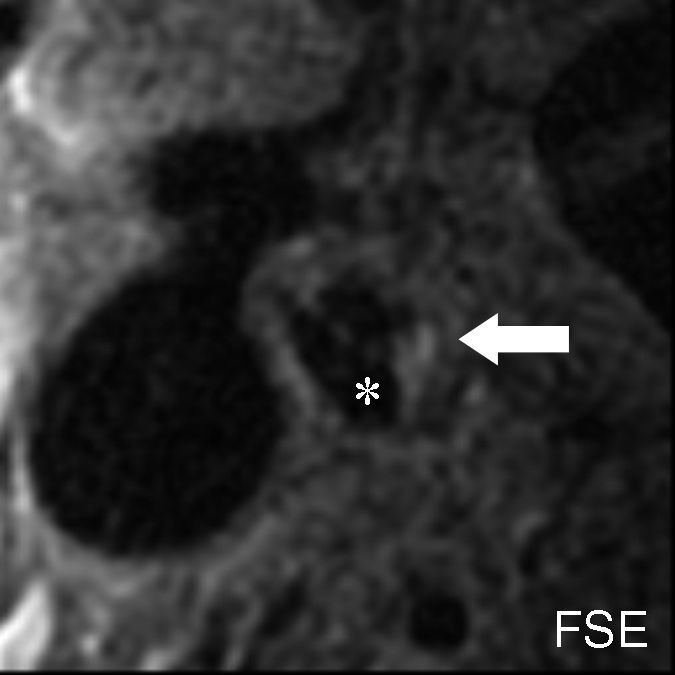
Moderately calcified IPH in left internal carotid artery in 75-year-old man. (a–c) On T1-weighted MR images, high-signal-intensity area (arrow) measures 15.8 mm2 on TOF image (23/3.5, 20° flip angle), 8.6 mm2 on fast spin-echo (FSE) image (800/11), and 24.8 mm2 on magnetization-prepared RAGE (MPRAGE) image (13.2/3.2, 15° flip angle). (d) Mallory trichrome–stained histologic specimen shows variable red staining pattern in necrotic core (arrow). (Original magnification, × 10.) Adjacent section stained with hematoxylin-eosin (H&E) shows large necrotic core (arrow) filled with IPH measuring 34.9 mm2. (Original magnification, × 10.) The inset is a magnified region of necrotic core (outlined in black) showing small fragments of calcification (arrows). (Original magnification, × 100.) * = Lumen.
Figure 3c:
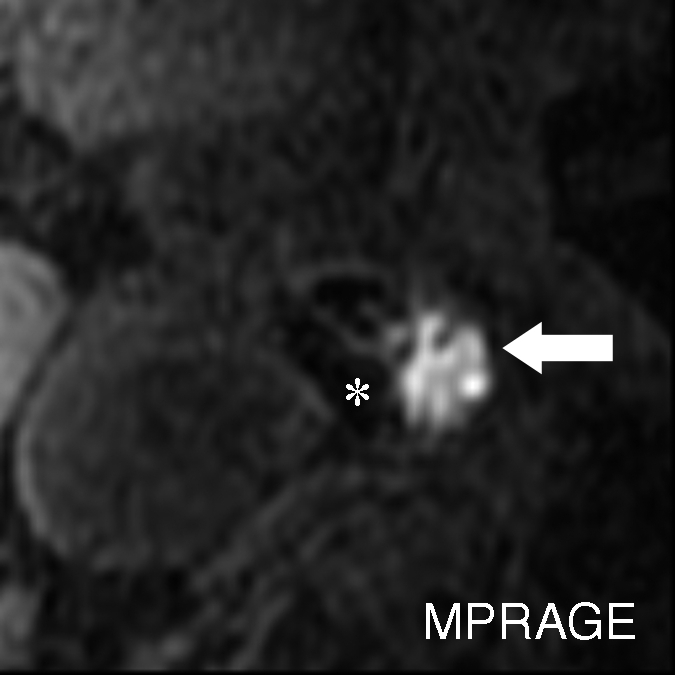
Moderately calcified IPH in left internal carotid artery in 75-year-old man. (a–c) On T1-weighted MR images, high-signal-intensity area (arrow) measures 15.8 mm2 on TOF image (23/3.5, 20° flip angle), 8.6 mm2 on fast spin-echo (FSE) image (800/11), and 24.8 mm2 on magnetization-prepared RAGE (MPRAGE) image (13.2/3.2, 15° flip angle). (d) Mallory trichrome–stained histologic specimen shows variable red staining pattern in necrotic core (arrow). (Original magnification, × 10.) Adjacent section stained with hematoxylin-eosin (H&E) shows large necrotic core (arrow) filled with IPH measuring 34.9 mm2. (Original magnification, × 10.) The inset is a magnified region of necrotic core (outlined in black) showing small fragments of calcification (arrows). (Original magnification, × 100.) * = Lumen.
Figure 3d:
Moderately calcified IPH in left internal carotid artery in 75-year-old man. (a–c) On T1-weighted MR images, high-signal-intensity area (arrow) measures 15.8 mm2 on TOF image (23/3.5, 20° flip angle), 8.6 mm2 on fast spin-echo (FSE) image (800/11), and 24.8 mm2 on magnetization-prepared RAGE (MPRAGE) image (13.2/3.2, 15° flip angle). (d) Mallory trichrome–stained histologic specimen shows variable red staining pattern in necrotic core (arrow). (Original magnification, × 10.) Adjacent section stained with hematoxylin-eosin (H&E) shows large necrotic core (arrow) filled with IPH measuring 34.9 mm2. (Original magnification, × 10.) The inset is a magnified region of necrotic core (outlined in black) showing small fragments of calcification (arrows). (Original magnification, × 100.) * = Lumen.
Figure 4a:
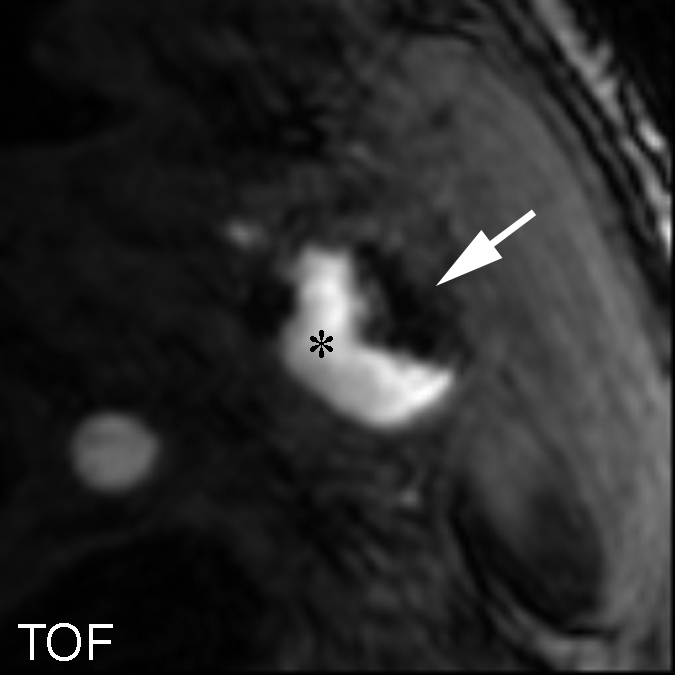
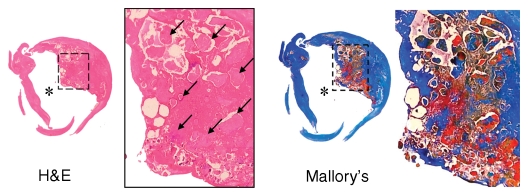
Heavily calcified IPH in left common carotid artery in 85-year-old man. (a–c) Hypointense region (arrow) is seen on TOF (23/3.5, 20° flip angle), fast spin-echo (FSE) (800/11), and magnetization-prepared RAGE (MPRAGE) (13.2/3.2, 15° flip angle) T1-weighted MR images. No high signal intensity is present on any image. (d) On hematoxylin-eosin (H&E)-stained histologic specimen, calcification (arrows) is readily visible and appears to be occupying more than 60% of the area; region outlined by dotted lines is magnified at right. On histologic specimen stained with Mallory trichrome for fibrin and blood (red), a small amount of hemorrhage is visible; region outlined by dotted lines is magnified at right. * = Lumen.
Figure 4b:
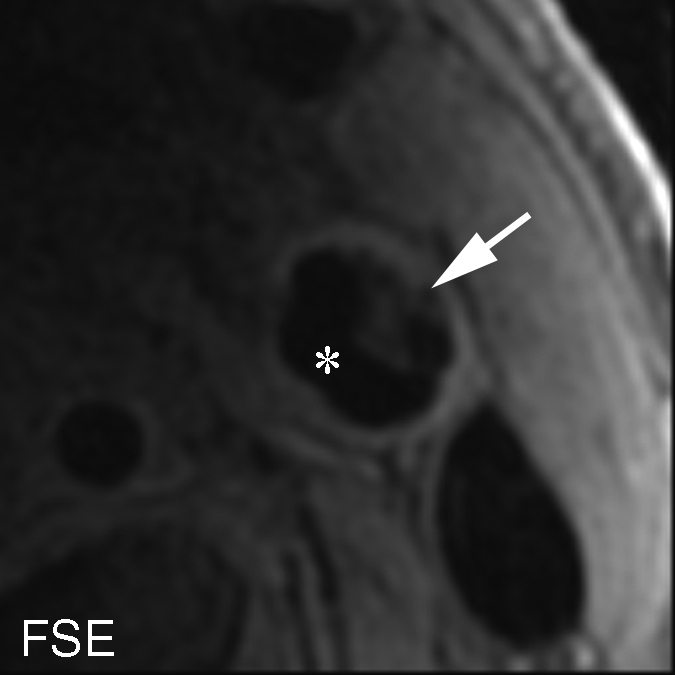
Heavily calcified IPH in left common carotid artery in 85-year-old man. (a–c) Hypointense region (arrow) is seen on TOF (23/3.5, 20° flip angle), fast spin-echo (FSE) (800/11), and magnetization-prepared RAGE (MPRAGE) (13.2/3.2, 15° flip angle) T1-weighted MR images. No high signal intensity is present on any image. (d) On hematoxylin-eosin (H&E)-stained histologic specimen, calcification (arrows) is readily visible and appears to be occupying more than 60% of the area; region outlined by dotted lines is magnified at right. On histologic specimen stained with Mallory trichrome for fibrin and blood (red), a small amount of hemorrhage is visible; region outlined by dotted lines is magnified at right. * = Lumen.
Figure 4c:
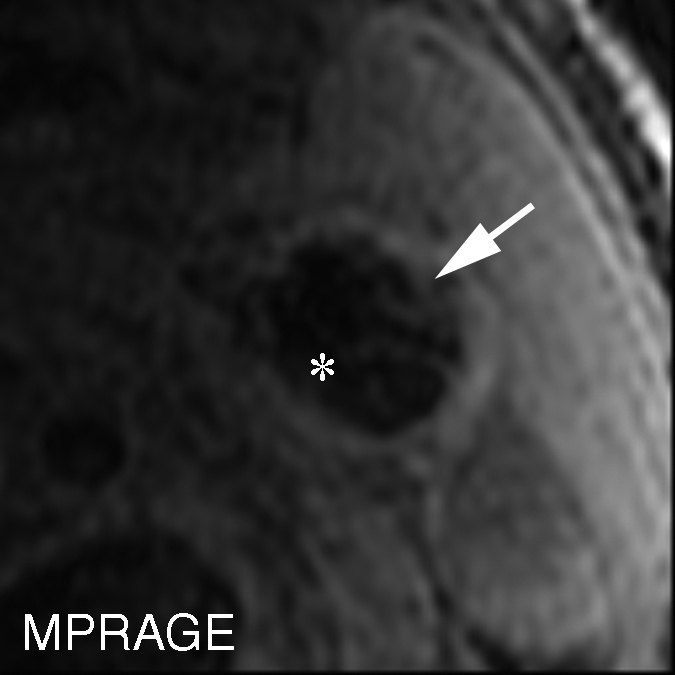
Heavily calcified IPH in left common carotid artery in 85-year-old man. (a–c) Hypointense region (arrow) is seen on TOF (23/3.5, 20° flip angle), fast spin-echo (FSE) (800/11), and magnetization-prepared RAGE (MPRAGE) (13.2/3.2, 15° flip angle) T1-weighted MR images. No high signal intensity is present on any image. (d) On hematoxylin-eosin (H&E)-stained histologic specimen, calcification (arrows) is readily visible and appears to be occupying more than 60% of the area; region outlined by dotted lines is magnified at right. On histologic specimen stained with Mallory trichrome for fibrin and blood (red), a small amount of hemorrhage is visible; region outlined by dotted lines is magnified at right. * = Lumen.
Figure 4d:
Heavily calcified IPH in left common carotid artery in 85-year-old man. (a–c) Hypointense region (arrow) is seen on TOF (23/3.5, 20° flip angle), fast spin-echo (FSE) (800/11), and magnetization-prepared RAGE (MPRAGE) (13.2/3.2, 15° flip angle) T1-weighted MR images. No high signal intensity is present on any image. (d) On hematoxylin-eosin (H&E)-stained histologic specimen, calcification (arrows) is readily visible and appears to be occupying more than 60% of the area; region outlined by dotted lines is magnified at right. On histologic specimen stained with Mallory trichrome for fibrin and blood (red), a small amount of hemorrhage is visible; region outlined by dotted lines is magnified at right. * = Lumen.
Sensitivity, Specificity, and κ Statistics
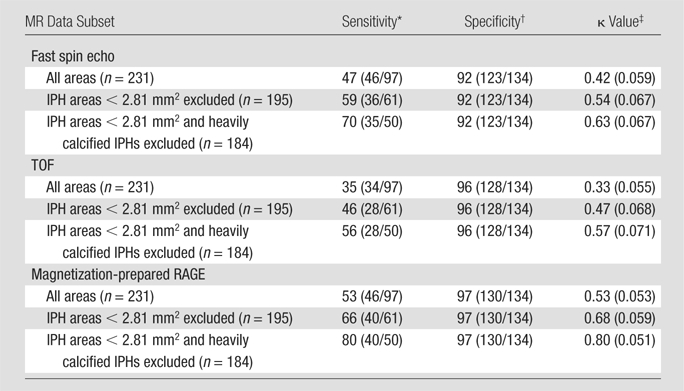
IPH detection statistics are summarized in Table 3. On the basis of findings in the entire data set of 231 MR imaging sections, moderate MR image–histologic specimen agreement was achieved with the magnetization-prepared RAGE (κ = 0.53; standard error, 0.053) and fast spin-echo (κ = 0.42; standard error, 0.059) sequences, and fair agreement was achieved with the TOF sequence (κ = 0.33; standard error, 0.055).
Table 3.
IPH Detection Statistics for Three T1-weighted MR Sequences and Data Subsets
Data are percentages, with numbers used to calculate percentages (number of true-positive cross sections divided by sum of true-positive plus false-negative cross sections) in parentheses.
Data are percentages, with numbers used to calculate percentages (number of true-negative cross sections divided by sum of true-negative plus false-positive cross sections) in parentheses.
Numbers in parentheses are standard errors.
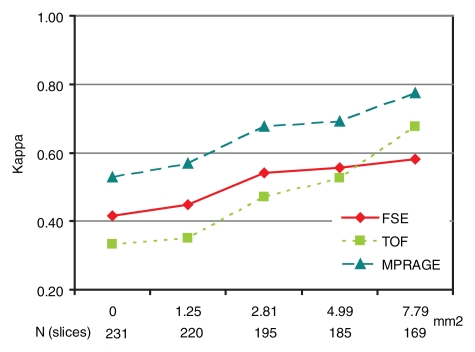
Figure 5 illustrates the effect of IPH size on IPH detection. When MR sections with IPH areas smaller than each cutoff value (1.25, 2.81, 4.99, or 7.79 mm2) were excluded, κ values consistently increased along with the cutoff values at all sequences. For each cutoff value, magnetization-prepared RAGE imaging consistently yielded the highest κ value. After the exclusion of 36 (16%) sections with IPH areas smaller than 2.81 mm2, approximating lesions with a less than 3-pixel diameter, good agreement between the magnetization-prepared RAGE MR images and the histologic specimens was achieved (κ = 0.68) (Table 3, Fig 5). It should be noted that the results for small IPHs with all three sequences were not considered to be reliable. When the 36 (16%) sections with IPH areas smaller than 2.81 mm2 were included, sensitivities for the detection of IPH were 31% (11 of 36 sections) with magnetization-prepared RAGE imaging, 17% (six of 36 sections) with TOF imaging, and 28% (10 of 36 sections) with fast spin-echo imaging.
Figure 5:
Graph illustrates κ values for the three T1-weighted MR sequences as a function of IPH area cutoff value. On horizontal axis, top numbers are IPH area cutoff values (in square millimeters) and bottom values are numbers of MR sections. FSE = fast spin echo, MPRAGE = magnetization-prepared RAGE.
To evaluate the reasons for disagreement between the MR imaging and histologic findings, the 15 (6%) sections with heavily calcified IPHs were excluded. When the data subset in which the total of 47 (20%) sections with either an IPH area smaller than 2.81 mm2 or heavily calcified IPHs was excluded, good agreement between the histologic specimens and both the magnetization-prepared RAGE and fast spin-echo images was achieved, with moderate TOF image–histologic specimen agreement (Table 3). It is notable that none of the heavily calcified IPHs was detected with the TOF or magnetization-prepared RAGE sequences (Fig 4 ), and heavily calcified IPH was detected on only one fast spin-echo MR image section.
On an artery basis, the TOF and magnetization-prepared RAGE sequences enabled correct classification of all lesions, with and without IPH, when the IPH areas smaller than 2.81 mm2 or the heavily calcified IPHs were excluded: in six (30%) of 20 cases. With fast spin-echo imaging, however, two (14%) of 14 arteries had findings false-positive for IPH, while no arteries with false-negative findings were found. At histologic analysis, the two false-positive cases demonstrated patterns of fibrous tissue with high lipid infiltration. It is notable that areas of high signal intensity mimicking hemorrhage were seen with the fast spin-echo sequence only; these regions were isointense on the TOF and magnetization-prepared RAGE images (Fig 6 ).
Figure 6a:
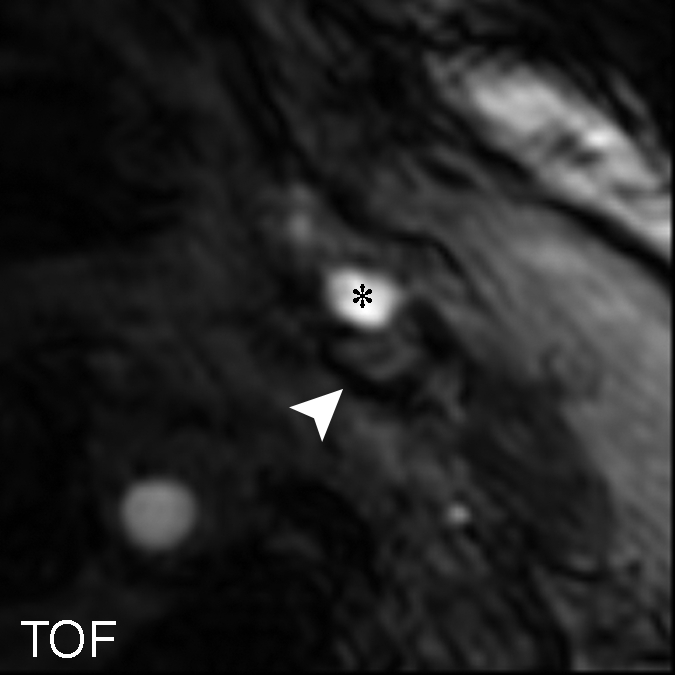
(a–c) T1-weighted MR images and (d) histologic specimens of left common carotid artery in 74-year-old man. (b) Fast spin-echo (FSE) image (800/11) shows area of high signal intensity (arrow), which is isointense on (a) TOF (23/3.5, 20° flip angle) and (c) magnetization-prepared RAGE (MPRAGE) (13.2/3.2, 15° flip angle) images, with a contrast percentage of 40.5%. (d) Right: Matching Mallory trichrome–stained histologic specimen (inset) shows the high-signal-intensity region (black arrows on histologic specimen, white arrows on MR image) contains no IPH at either hematoxylin-eosin or Mallory trichrome staining analysis, as Mallory trichrome staining results in red-stained blood products and blue matrix. For both hematoxylin-eosin (H&E)- and Mallory trichrome–stained specimens, the main (larger) specimen is a magnification of the region outlined in the inset in top left corner. Calcification (arrowhead) has low signal intensity on all three MR images and is seen as an acellular area bordered by a purple band on the hematoxylin-eosin–stained histologic specimen. * = Lumen.
Figure 6b:
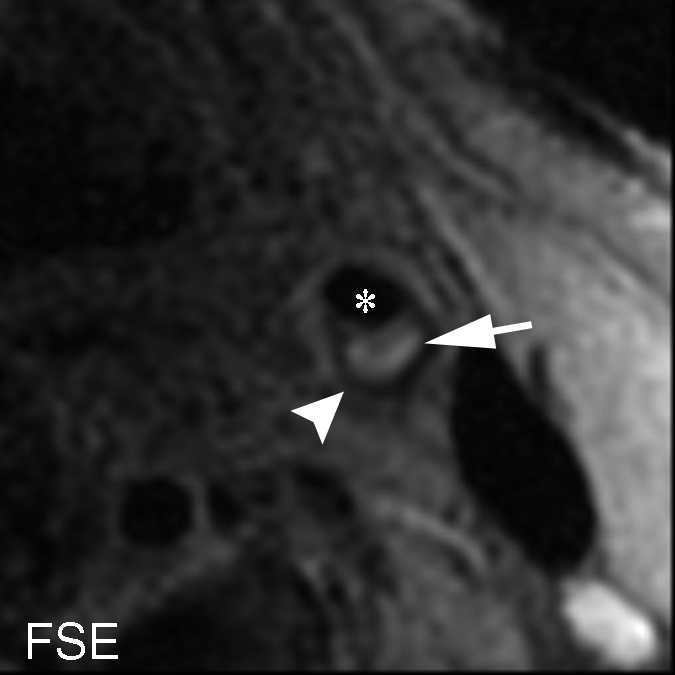
(a–c) T1-weighted MR images and (d) histologic specimens of left common carotid artery in 74-year-old man. (b) Fast spin-echo (FSE) image (800/11) shows area of high signal intensity (arrow), which is isointense on (a) TOF (23/3.5, 20° flip angle) and (c) magnetization-prepared RAGE (MPRAGE) (13.2/3.2, 15° flip angle) images, with a contrast percentage of 40.5%. (d) Right: Matching Mallory trichrome–stained histologic specimen (inset) shows the high-signal-intensity region (black arrows on histologic specimen, white arrows on MR image) contains no IPH at either hematoxylin-eosin or Mallory trichrome staining analysis, as Mallory trichrome staining results in red-stained blood products and blue matrix. For both hematoxylin-eosin (H&E)- and Mallory trichrome–stained specimens, the main (larger) specimen is a magnification of the region outlined in the inset in top left corner. Calcification (arrowhead) has low signal intensity on all three MR images and is seen as an acellular area bordered by a purple band on the hematoxylin-eosin–stained histologic specimen. * = Lumen.
Figure 6c:
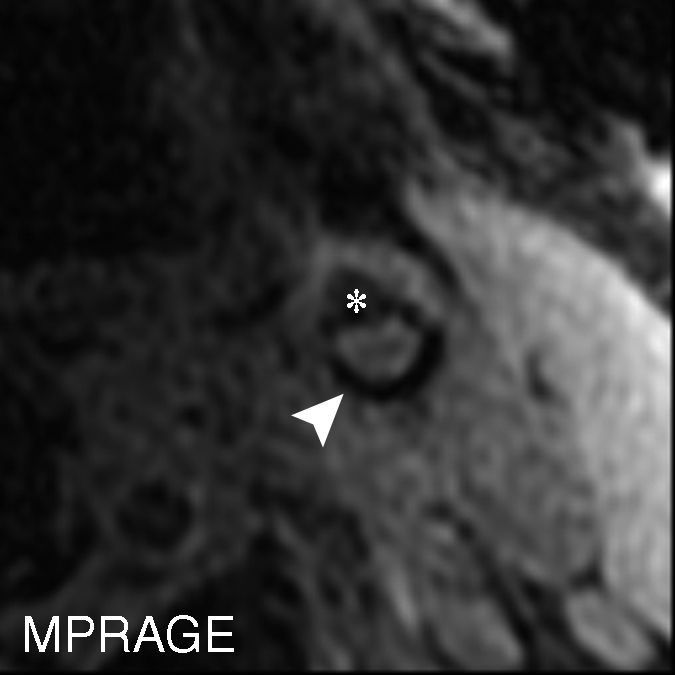
(a–c) T1-weighted MR images and (d) histologic specimens of left common carotid artery in 74-year-old man. (b) Fast spin-echo (FSE) image (800/11) shows area of high signal intensity (arrow), which is isointense on (a) TOF (23/3.5, 20° flip angle) and (c) magnetization-prepared RAGE (MPRAGE) (13.2/3.2, 15° flip angle) images, with a contrast percentage of 40.5%. (d) Right: Matching Mallory trichrome–stained histologic specimen (inset) shows the high-signal-intensity region (black arrows on histologic specimen, white arrows on MR image) contains no IPH at either hematoxylin-eosin or Mallory trichrome staining analysis, as Mallory trichrome staining results in red-stained blood products and blue matrix. For both hematoxylin-eosin (H&E)- and Mallory trichrome–stained specimens, the main (larger) specimen is a magnification of the region outlined in the inset in top left corner. Calcification (arrowhead) has low signal intensity on all three MR images and is seen as an acellular area bordered by a purple band on the hematoxylin-eosin–stained histologic specimen. * = Lumen.
Figure 6d:
(a–c) T1-weighted MR images and (d) histologic specimens of left common carotid artery in 74-year-old man. (b) Fast spin-echo (FSE) image (800/11) shows area of high signal intensity (arrow), which is isointense on (a) TOF (23/3.5, 20° flip angle) and (c) magnetization-prepared RAGE (MPRAGE) (13.2/3.2, 15° flip angle) images, with a contrast percentage of 40.5%. (d) Right: Matching Mallory trichrome–stained histologic specimen (inset) shows the high-signal-intensity region (black arrows on histologic specimen, white arrows on MR image) contains no IPH at either hematoxylin-eosin or Mallory trichrome staining analysis, as Mallory trichrome staining results in red-stained blood products and blue matrix. For both hematoxylin-eosin (H&E)- and Mallory trichrome–stained specimens, the main (larger) specimen is a magnification of the region outlined in the inset in top left corner. Calcification (arrowhead) has low signal intensity on all three MR images and is seen as an acellular area bordered by a purple band on the hematoxylin-eosin–stained histologic specimen. * = Lumen.
IPH Area Measurements
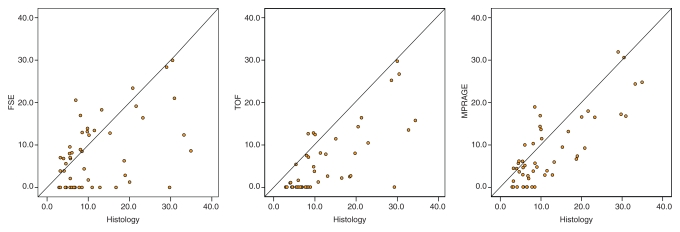
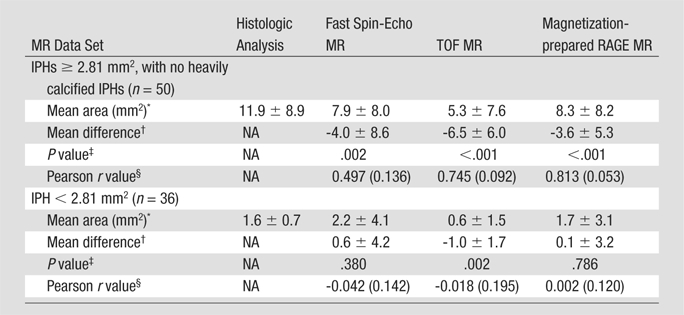
Among the 97 MR sections with histologically confirmed IPH, 50 (52%) with an IPH area of 2.81 mm2 or larger and no heavy calcifications were included for IPH area measurements. The Pearson r value for the correlation between MR-derived and histologic analysis–derived IPH areas was highest with the magnetization-prepared RAGE sequence, followed by the TOF and fast spin-echo sequences (Table 4). The IPH areas measured with each sequence and with histologic analysis are compared in the scatterplots in Figure 7. Paired t test results indicated that the MR measurements of IPH area yielded significant underestimations of IPH size. The mean difference between the MR imaging and histologic measurements was smallest with the magnetization-prepared RAGE sequence, followed by the fast spin-echo and TOF sequences (Table 4). When the 36 (of 97, 37%) sections with an IPH area smaller than 2.81 mm2 were included, there was no significant correlation between the MR-derived and histologic analysis–derived IPH area measurements (Table 4).
Table 4.
Comparison of Mean IPH Areas Measured with T1-weighted Sequences versus Histologic Analysis
Mean IPH area ± standard deviation.
Mean difference (± standard deviation) in IPH area between MR measurement and histologic analysis measurement.
P values derived with paired t test.
Numbers in parentheses are standard errors.
Figure 7:
Scatterplots show comparison of IPH areas on 50 MR sections with an IPH area of 2.81 mm2 or larger and no heavily calcified IPH, as measured with each T1-weighted MR sequence and at histologic analysis. FSE = fast spin echo, MPRAGE = magnetization-prepared RAGE.
SNR, CNR, and Contrast Percentage
The SNRs, CNRs, and contrast percentages on 26 (of 97, 27%) MR sections in which IPH was detected with all sequences and confirmed at histologic analysis were compared between the three T1-weighted MR sequences (Table 5). The SNR on the TOF images was significantly higher than that on the fast spin-echo (P < .001) and magnetization-prepared RAGE (P < .001) images, and the magnetization-prepared RAGE sequence yielded significantly higher SNRs than did the fast spin-echo sequence (P = .012). Both magnetization-prepared RAGE imaging (P = .001) and TOF imaging (P = .031) yielded significantly higher CNRs than did fast spin-echo imaging. No significant difference in CNR between the magnetization-prepared RAGE and TOF sequences (P > .99) was observed. Magnetization-prepared RAGE imaging yielded a significantly higher contrast percentage than did TOF (P < .001) and fast spin-echo (P < .001) imaging, with no significant difference between the TOF and fast spin-echo sequences (P > .99).
Table 5.
Comparison of IPH SNR, CNR, and Contrast Percentage between Three T1-weighted Sequences

Note.—Data are mean values ± standard deviations. Values were compared on 26 MR sections. Statistical significance was evaluated by using repeated-measures analysis of variance with Bonferroni adjustment for post hoc comparisons.
P < .05 for comparisons of fast spin-echo versus TOF, fast spin-echo versus magnetization-prepared RAGE, and TOF versus magnetization-prepared RAGE sequences.
Image Quality
Mean image quality scores, per artery, for the fast spin-echo, TOF, and magnetization-prepared RAGE sequences were 2.5 ± 0.4 (standard deviation), 2.6 ± 0.5, and 2.4 ± 0.3, respectively. Repeated-measures analysis of variance revealed no significant differences in image quality score between the sequences (P = .08).
Discussion
To our knowledge, this study is the first in which three 3.0-T T1-weighted MR sequences were compared for IPH imaging and matching with histologic findings. Previous studies of 1.5-T MR imaging have revealed that carotid plaque MR imaging performed with a combination of 3D TOF and two-dimensional fast spin-echo T1-weighted sequences can depict IPH with sensitivities of 87%–96% and specificities of 74%–82% (3,4,17). The reported κ value was 0.71 for agreement between MR imaging and histologic analysis when the IPH size exceeded 2 mm2 (4). In a study to detect complicated American Heart Association type IV plaques with 1.5-T magnetization-prepared RAGE MR imaging (referred to as direct thrombus imaging), Moody et al (2) reported 84% sensitivity and 84% specificity compared with the values achieved by matching endarterectomy specimens. Bitar et al (32) recently reported achieving 97% sensitivity and 84% specificity with use of a high-spatial-resolution version of direct thrombus imaging in a prescreened endarterectomy population of patients who had hyperintense lesions at low-spatial-resolution direct thrombus imaging screening.
Compared with the results of previous studies of 1.5-T MR imaging (2–4,17), the findings in our present investigation indicate consistently higher specificity and similar or better (depending on the sequence) overall agreement in the detection of IPH with 3.0-T imaging. The improved specificity at 3.0 T can be attributed to the lower false-positive result rate, which was caused by areas of high signal intensity that were not related to IPH. Cappendijk et al (6) found that most of the false-positive cases at 1.5-T IPH imaging resulted from fibrous tissue and were more prevalent with the fast spin-echo sequence than with the inversion-recovery–prepared gradient-echo sequence, which is similar to the magnetization-prepared RAGE sequence used in this study. These findings were due to the effect of T2* shortening caused by the layered collagen-rich structure of fibrous tissue (6), which results in more pronounced signal intensity on gradient-echo images. This mechanism is in agreement with our findings, as both T2* and T2 are further reduced with increased field strength to result in better discrimination between IPH and fibrous tissue. Furthermore, our data indicate that better specificity is achieved with gradient-echo sequences (ie, TOF and magnetization-prepared RAGE) than with fast spin-echo sequences; these findings are also in agreement with those of Cappendijk et al (6). The lipid-rich necrotic core may, on occasion, also appear hyperintense on T1-weighted fast spin-echo images (6,8). The two arteries with findings false-positive for IPH on fast spin-echo images with lipid infiltration in our study fit this concept, although more detailed studies are needed to identify histopathologic correlations of hemorrhage-mimicking components. Another factor that may contribute to the improved specificity at 3.0 T is the increase in SNR and CNR compared with those at 1.5 T (19,20).
In contradistinction to the specificity, the sensitivity of 3.0-T MR imaging for the detection of IPH appears to be lower than that reported for 1.5-T examinations (3,4,6). Two factors appear to cause false-negative results: IPH size and coexisting calcification. In terms of the former factor, sensitivity and κ values consistently improved as IPH size increased in our study. All three T1-weighted MR sequences evaluated had unreliable performance in the detection and quantification of small IPHs. This result indicates that improvements in spatial resolution will be helpful for visualizing smaller IPHs. In terms of the latter factor, neither magnetization-prepared RAGE imaging nor TOF imaging depicted IPH mixed with calcification that encompassed 50% or more of the IPH area. Although a direct comparison of carotid 3.0-T MR imaging with histologic analysis for the detection and quantification of calcification has not been reported, it has been suggested that plaque calcifications are prone to the magnetic susceptibility effect, which causes an apparent increase in calcification size at 3.0-T imaging compared with the calcification size at 1.5-T imaging (19). Concurrent signal trends (an increase due to T1 shortening and a decrease due to the susceptibility effect) make calcified IPH more difficult—or even impossible—to detect at 3.0 T.
The key methodologic finding in this study was that among the three tested T1-weighted MR sequences, the magnetization-prepared RAGE sequence yielded the best agreement with histologic findings in the detection and quantification of IPH. This sequence was recently optimized for IPH detection at 3.0 T (21), with the field-dependent changes in T1 in the vessel wall and blood taken into account. Magnetization-prepared RAGE imaging facilitates suppression of the signals from background tissues by means of a nonselective inversion pulse and either spectrally selective water excitation or fat suppression (2,21). Various plaque components with a relatively long T1, such as fibrous tissue and the lipid-rich necrotic core, are also suppressed owing to the inversion-recovery preparation. This results in the highest contrast percentage of IPH with magnetization-prepared RAGE MR imaging, although there appears to be a tradeoff of SNR for improved IPH contrast with this sequence. The uniform hypointense appearance of background tissue and the suppressed blood signal facilitate image interpretation on magnetization-prepared RAGE images. This resulted in better diagnostic performance in our study. Magnetization-prepared RAGE imaging was also found to enable the most accurate quantitative measurements of IPH size.
The SNR rendered with the black-blood fast spin-echo sequence was significantly lower than the SNRs rendered with the magnetization-prepared RAGE and TOF sequences. The lower SNR was inherently related to the two-dimensional acquisition mode. The CNR rendered with the fast spin-echo sequence was also lower than the CNRs rendered with the magnetization-prepared RAGE and TOF sequences. The imaging time with fast spin-echo imaging was 1.4–2.9 times longer than the imaging times with the other sequences. The longer imaging time often results in motion artifact. However, the effect of motion on image quality may be a less critical factor with fast spin-echo imaging because two-dimensional black-blood fast spin-echo images are acquired in the single-section mode, and occasional motion patterns (eg, swallowing) may result in image quality degradation on a few sections. With 3D sequences, however, motion affects the entire image set. In this study, we found no specific sequence that was more affected by motion artifacts than the others.
Although IPH contributes to plaque vulnerability (33), numerous other factors are also associated with subsequent cerebrovascular symptoms. These other factors include a thin or ruptured fibrous cap, a large lipid-rich necrotic core, and wall thickness (10). Therefore, a multicontrast protocol is necessary for comprehensive plaque evaluation (34). Although information about IPH can be obtained with the 3D TOF and precontrast T1-weighted fast spin-echo sequences typically included in a multicontrast protocol (34), our current study results indicate that the most robust sequence for IPH imaging at 3.0 T is magnetization-prepared RAGE. The addition of magnetization-prepared RAGE imaging, with a 4-minute imaging time, to a carotid plaque imaging protocol slightly increases the time of the multicontrast imaging examination, which generally takes about 30 minutes with use of a 3.0-T imager, the appropriate coils, and time-efficient sequences (19,20).
Finally, it should be noted that in this study, we did not exclude the possibility of improvements in fast spin-echo and TOF sequences to increase their sensitivity to IPH. These are multipurpose sequences, and although they have been extensively used in carotid MR imaging during the past decade, they have not been optimized for IPH imaging. Although these sequences were implemented in this study according to standard guidelines (34), their optimization for IPH detection may require heavier T1 weighting by means of a reduced repetition time and a reduced echo train in the fast spin-echo sequence and an increased flip angle in the TOF sequence. However, such optimization can become a complex problem because there are multiple conflicting requirements, such as a satisfactory SNR, a conventional imaging time, and the capability to maintain the desired blood contrast (flow enhancement in TOF imaging, flow suppression in black-blood fast spin-echo imaging). More research is needed to improve the fast spin-echo and TOF techniques. In the meantime, magnetization-prepared RAGE imaging remains a time-efficient alternative for IPH imaging, with good diagnostic performance.
Our study had a number of limitations. The first limitation was that the detection statistics were calculated on a cross-sectional rather than patient basis. This was due to the size and properties of the patient population, in which only four (20%) of 20 artery specimens did not have IPH. Therefore, a larger sample would be required to achieve statistical significance on a patient basis. Nonetheless, we believe that our method based on the examination of matched cross sections was adequate for achieving the primary goal of this study, which was to identify the best technique for IPH MR imaging at 3.0 T. The second limitation was that this study did not include the use of a multicontrast protocol in conjunction with plaque tissue segmentation. The image contrast data given in Table 5 represent values for average characteristics that were not linked to a specific plaque background tissue such as fibrous tissue, lipid-rich necrotic core, or calcification. Although this approach is relevant to the IPH definition based on high signal intensity, the variable appearance of background plaque components is reflected by large standard deviations in CNR and contrast percentage, particularly for the TOF and fast spin-echo sequences. Variations in plaque tissue signal intensity play a minor role in the magnetization-prepared RAGE sequence, with which IPH is assumed to be the only source of a strong signal because the signals of other tissues are suppressed.
The third limitation was that we did not apply the hemorrhage staging criteria established in previous studies (3,17). The distinction between acute and recent IPH is based on T2-weighted or proton-density–weighted image findings because high signal intensity is produced in both stages with T1-weighted sequences (TOF and fast spin-echo) (3,17). In this study, we selected for analysis only those areas with high signal intensity on T1-weighted images. This approach is similar to that applied in direct thrombus imaging studies (2,13–15,18,32), in which hemorrhagic lesions were identified solely on the basis of high signal intensity. An additional MR imaging–histologic analysis comparison study is needed to characterize hemorrhage stages by interpreting the signal intensity patterns with both T1-weighted (particularly magnetization-prepared RAGE) and T2-weighted sequences at 3.0 T.
In conclusion, the magnetization-prepared RAGE sequence appears to have greater diagnostic capability for the detection and quantification of relatively large IPHs compared with fast spin-echo and TOF sequences at 3.0 T. The results of this study validate magnetization-prepared RAGE as a fast and reliable hemorrhage-specific sequence for 3.0-T carotid plaque MR imaging. The potential limitations of IPH imaging at 3.0 T are related to IPH size and coexisting calcification.
Advances in Knowledge.
At 3.0-T, the magnetization-prepared rapid acquisition gradient-echo (RAGE) MR sequence has higher capability for the detection and quantification of carotid intraplaque hemorrhage (IPH) than do the T1-weighted time-of-flight (TOF) and fast spin-echo sequences currently used clinically.
TOF, fast spin-echo, and magnetization-prepared RAGE MR sequences performed at 3.0 T cannot be used reliably to detect small IPHs or IPH mixed with heavy calcification.
Implication for Patient Care.
Magnetization-prepared RAGE is a time-efficient sequence that can be used to identify relatively large IPHs with high sensitivity and specificity when small IPHs and IPHs mixed with heavy calcification are excluded from the analysis.
Received March 26, 2009; revision requested May 6; revision received June 11; accepted June 25; final version accepted July 14.
Supported by the American Heart Association Midwest Affiliate Grant-in-Aid 0855604G, Michigan State University/Office of Vice-President for Research & Graduate Studies and the Office of the Provost through the Internal Grant Program 05-IRGP-472, Bracco Diagnostics Extramural research grant I021764, and Pfizer.
See Materials and Methods for pertinent disclosures.
This research was supported by National Institutes of Health grant (HL56874).
Abbreviations:
- CNR
- contrast-to-noise ratio
- IPH
- intraplaque hemorrhage
- RAGE
- rapid acquisition gradient echo
- SNR
- signal-to-noise ratio
- 3D
- three-dimensional
- TOF
- time of flight
References
- 1.Kolodgie FD, Gold HK, Burke AP, et al. Intraplaque hemorrhage and progression of coronary atheroma. N Engl J Med 2003;349(24):2316–2325 [DOI] [PubMed] [Google Scholar]
- 2.Moody AR, Murphy RE, Morgan PS, et al. Characterization of complicated carotid plaque with magnetic resonance direct thrombus imaging in patients with cerebral ischemia. Circulation 2003;107(24):3047–3052 [DOI] [PubMed] [Google Scholar]
- 3.Chu B, Kampschulte A, Ferguson MS, et al. Hemorrhage in the atherosclerotic carotid plaque: a high-resolution MRI study. Stroke 2004;35(5):1079–1084 [DOI] [PubMed] [Google Scholar]
- 4.Saam T, Ferguson MS, Yarnykh VL, et al. Quantitative evaluation of carotid plaque composition by in vivo MRI. Arterioscler Thromb Vasc Biol 2005;25(1):234–239 [DOI] [PubMed] [Google Scholar]
- 5.Cai JM, Hatsukami TS, Ferguson MS, Small R, Polissar NL, Yuan C. Classification of human carotid atherosclerotic lesions with in vivo multicontrast magnetic resonance imaging. Circulation 2002;106(11):1368–1373 [DOI] [PubMed] [Google Scholar]
- 6.Cappendijk VC, Cleutjens KBJM, Heeneman S, et al. In vivo detection of hemorrhage in human atherosclerotic plaques with magnetic resonance imaging. J Magn Reson Imaging 2004;20(1):105–110 [DOI] [PubMed] [Google Scholar]
- 7.Toussaint JF, LaMuraglia GM, Southern JF, Fuster V, Kantor HL. Magnetic resonance images lipid, fibrous, calcified, hemorrhagic, and thrombotic components of human atherosclerosis in vivo. Circulation 1996;94(5):932–938 [DOI] [PubMed] [Google Scholar]
- 8.Yuan C, Mitsumori LM, Ferguson MS, et al. In vivo accuracy of multispectral magnetic resonance imaging for identifying lipid-rich necrotic cores and intraplaque hemorrhage in advanced human carotid plaques. Circulation 2001;104(17):2051–2056 [DOI] [PubMed] [Google Scholar]
- 9.Takaya N, Yuan C, Chu B, et al. Presence of intraplaque hemorrhage stimulates progression of carotid atherosclerotic plaques: a high-resolution magnetic resonance imaging study. Circulation 2005;111(21):2768–2775 [DOI] [PubMed] [Google Scholar]
- 10.Takaya N, Yuan C, Chu B, et al. Association between carotid plaque characteristics and subsequent ischemic cerebrovascular events: a prospective assessment with MRI–initial results. Stroke 2006;37(3):818–823 [DOI] [PubMed] [Google Scholar]
- 11.Saam T, Cai J, Ma L, et al. Comparison of symptomatic and asymptomatic atherosclerotic carotid plaque features with in vivo MR imaging. Radiology 2006;240(2):464–472 [DOI] [PMC free article] [PubMed] [Google Scholar]
- 12.Murphy RE, Moody AR, Morgan PS, et al. Prevalence of complicated carotid atheroma as detected by magnetic resonance direct thrombus imaging in patients with suspected carotid artery stenosis and previous acute cerebral ischemia. Circulation 2003;107(24):3053–3058 [DOI] [PubMed] [Google Scholar]
- 13.Altaf N, Daniels L, Morgan PS, et al. Detection of intraplaque hemorrhage by magnetic resonance imaging in symptomatic patients with mild to moderate carotid stenosis predicts recurrent neurological events. J Vasc Surg 2008;47(2):337–342 [DOI] [PubMed] [Google Scholar]
- 14.Yamada N, Higashi M, Otsubo R, et al. Association between signal hyperintensity on T1-weighted MR imaging of carotid plaques and ipsilateral ischemic events. AJNR Am J Neuroradiol 2007;28(2):287–292 [PMC free article] [PubMed] [Google Scholar]
- 15.Altaf N, MacSweeney ST, Gladman J, Auer DP. Carotid intraplaque hemorrhage predicts recurrent symptoms in patients with high-grade carotid stenosis. Stroke 2007;38(5):1633–1635 [DOI] [PubMed] [Google Scholar]
- 16.Albuquerque LC, Narvaes LB, Maciel AA, et al. Intraplaque hemorrhage assessed by high-resolution magnetic resonance imaging and C-reactive protein in carotid atherosclerosis. J Vasc Surg 2007;46(6):1130–1137 [DOI] [PubMed] [Google Scholar]
- 17.Kampschulte A, Ferguson MS, Kerwin WS, et al. Differentiation of intraplaque versus juxtaluminal hemorrhage/thrombus in advanced human carotid atherosclerotic lesions by in vivo magnetic resonance imaging. Circulation 2004;110(20):3239–3244 [DOI] [PubMed] [Google Scholar]
- 18.Altaf N, Beech A, Goode SD, et al. Carotid intraplaque hemorrhage detected by magnetic resonance imaging predicts embolization during carotid endarterectomy. J Vasc Surg 2007;46(1):31–36 [DOI] [PubMed] [Google Scholar]
- 19.Underhill HR, Yarnykh VL, Hatsukami TS, et al. Carotid plaque morphology and composition: initial comparison between 1.5- and 3.0-T magnetic field strengths. Radiology 2008;248(2):550–560 [DOI] [PMC free article] [PubMed] [Google Scholar]
- 20.Yarnykh VL, Terashima M, Hayes CE, et al. Multicontrast black-blood MRI of carotid arteries: comparison between 1.5 and 3 tesla magnetic field strengths. J Magn Reson Imaging 2006;23(5):691–698 [DOI] [PubMed] [Google Scholar]
- 21.Zhu DC, Ferguson MS, DeMarco JK. An optimized 3D inversion recovery prepared fast spoiled gradient recalled sequence for carotid plaque hemorrhage imaging at 3.0 T. Magn Reson Imaging 2008;26(10):1360–1366 [DOI] [PubMed] [Google Scholar]
- 22.Mani V, Itskovich VV, Aguiar SH, et al. Comparison of gated and nongated fast multislice black-blood carotid imaging using rapid extended coverage and inflow/outflow saturation techniques. J Magn Reson Imaging 2005;22(5):628–633 [DOI] [PubMed] [Google Scholar]
- 23.Yarnykh VL, Yuan C. T1-insensitive flow suppression using quadruple inversion-recovery. Magn Reson Med 2002;48(5):899–905 [DOI] [PubMed] [Google Scholar]
- 24.Kerwin W, Xu D, Liu F, et al. Magnetic resonance imaging of carotid atherosclerosis: plaque analysis. Top Magn Reson Imaging 2007;18(5):371–378 [DOI] [PubMed] [Google Scholar]
- 25.Constantinides CD, Atalar E, McVeigh ER. Signal-to-noise measurements in magnitude images from NMR phased arrays. Magn Reson Med 1997;38(5):852–857 [DOI] [PMC free article] [PubMed] [Google Scholar]
- 26.Virmani R, Kolodgie FD, Burke AP, Farb A, Schwartz SM. Lessons from sudden coronary death: a comprehensive morphological classification scheme for atherosclerotic lesions. Arterioscler Thromb Vasc Biol 2000;20(5):1262–1275 [DOI] [PubMed] [Google Scholar]
- 27.Gotlieb AI, Havenith MG. Atherosclerosis: lesions and pathogenesis. In: Robbins S, Cotran R. eds. Robbins pathologic basis of disease Philadelphia, Pa: Saunders, 1979; 225–265 [Google Scholar]
- 28.Stary HC, Chandler AB, Dinsmore RE, et al. A definition of advanced types of atherosclerotic lesions and a histological classification of atherosclerosis: a report from the Committee on Vascular Lesions of the Council on Arteriosclerosis, American Heart Association. Circulation 1995;92(5):1355–1374 [DOI] [PubMed] [Google Scholar]
- 29.Lusby RJ, Ferrell LD, Ehrenfeld WK, Stoney RJ, Wylie EJ. Carotid plaque hemorrhage: its role in production of cerebral ischemia. Arch Surg 1982;117(11):1479–1488 [DOI] [PubMed] [Google Scholar]
- 30.Okada M, Mimura T, Ishida T, Matsumoto S. The hematoxylin-stainability of decalcified dentin and the calcification. Proc Jpn Acad 1959;35(1):47–52 [Google Scholar]
- 31.Efron B, Tibshirani RJ. An introduction to the bootstrap New York, NY: Chapman & Hall, 1993 [Google Scholar]
- 32.Bitar R, Moody AR, Leung G, et al. In vivo 3D high-spatial-resolution MR imaging of intraplaque hemorrhage. Radiology 2008;249(1):259–267 [DOI] [PubMed] [Google Scholar]
- 33.Naghavi M, Libby P, Falk E, et al. From vulnerable plaque to vulnerable patient: a call for new definitions and risk assessment strategies—part I. Circulation 2003;108(14):1664–1672 [DOI] [PubMed] [Google Scholar]
- 34.Yuan C, Kerwin WS, Yarnykh VL, et al. MRI of atherosclerosis in clinical trials. NMR Biomed 2006;19(6):636–654 [DOI] [PubMed] [Google Scholar]


