

A combined dual-source CT protocol for assessment of myocardial perfusion and coronary anatomy is feasible, with acceptable contrast material and radiation doses; moreover, the addition of myocardial stress perfusion CT improves the diagnostic accuracy of cardiac CT angiography and enables simultaneous assessment of anatomy and perfusion in a single examination.
Abstract
Purpose:
First, to assess the feasibility of a protocol involving stress-induced perfusion evaluated at computed tomography (CT) combined with cardiac CT angiography in a single examination and second, to assess the incremental value of perfusion imaging over cardiac CT angiography in a dual-source technique for the detection of obstructive coronary artery disease (CAD) in a high-risk population.
Materials and Methods:
Institutional review board approval and informed patient consent were obtained before patient enrollment in the study. The study was HIPAA compliant. Thirty-five patients at high risk for CAD were prospectively enrolled for evaluation of the feasibility of CT perfusion imaging. All patients underwent retrospectively electrocardiographically gated (helical) adenosine stress CT perfusion imaging followed by prospectively electrocardiographically gated (axial) rest myocardial CT perfusion imaging. Analysis was performed in three steps: (a)Coronary arterial stenoses were scored for severity and reader confidence at cardiac CT angiography, (b)myocardial perfusion defects were identified and scored for severity and reversibility at CT perfusion imaging, and (c)coronary stenosis severity was reclassified according to perfusion findings at combined cardiac CT angiography and CT perfusion imaging. The sensitivity, specificity, negative predictive value (NPV), and positive predictive value (PPV) of cardiac CT angiography before and after CT perfusion analysis were calculated.
Results:
With use of a reference standard of greater than 50% stenosis at invasive angiography, all parameters of diagnostic accuracy increased after CT perfusion analysis: Sensitivity increased from 83% to 91%; specificity, from 71% to 91%; PPV, from 66% to 86%; and NPV, from 87% to 93%. The area under the receiver operating characteristic curve increased significantly, from 0.77 to 0.90 (P < .005).
Conclusion:
A combination protocol involving adenosine perfusion CT imaging and cardiac CT angiography in a dual-source technique is feasible, and CT perfusion adds incremental value to cardiac CT angiography in the detection of significant CAD.
© RSNA, 2010
Introduction
The diagnostic accuracy of cardiac computed tomographic (CT) angiography for the detection and exclusion of coronary artery disease (CAD) (1–9) has been demonstrated in several studies, including three recent multicenter trials (2,5,6). According to American Heart Association recommendations, symptomatic patients with intermediate risk for CAD gain the greatest benefit from cardiac CT angiography (10). Currently, cardiac CT angiography is not recommended for high-risk patients, for whom initial examination with either combination single photon emission CT (SPECT) and myocardial perfusion imaging, or invasive angiography might be preferred (10,11). The main reasons cardiac CT angiography is not recommended for this group are that it yields anatomic information only and it leads to overestimation of CAD severity—because of the presence of calcified plaques (12) and stents (13,14)—which is a frequent challenge in these patients.
Combined assessment of coronary anatomy and myocardial perfusion at cardiac CT angiography and SPECT–myocardial perfusion imaging has revealed the complementary value of these examinations in the detection of obstructive CAD (15–17). Moreover, the results of recent studies have shown that assessment of adenosine-mediated stress perfusion at CT (ie, CT perfusion imaging) is feasible, with results comparable to those of SPECT–myocardial perfusion imaging for the detection of perfusion abnormalities (18–21). In this context, a single cardiac CT angiographic examination at which coronary anatomy and myocardial perfusion information is combined is an attractive concept. Thus, the aims of our study were twofold: first, to assess the feasibility of a combined CT perfusion imaging and cardiac CT angiographic protocol in a single examination and second, to assess the incremental value of perfusion imaging over cardiac CT angiography in a dual-source technique for the detection of obstructive CAD in a high-risk population.
Materials and Methods
Astellas Pharma (Deerfield, Ill) provided partial support for this trial, supplying the adenosine administered and providing a research grant to one author (R.C.C.). The authors had full control of the data obtained in this trial.
Study Subjects
In this study, a cohort of patients was prospectively enrolled at Massachusetts General Hospital for assessment of the feasibility of CT perfusion imaging. Patients who underwent SPECT–myocardial perfusion imaging with a high clinical likelihood of undergoing subsequent invasive angiography and patients who underwent SPECT–myocardial perfusion imaging and subsequent invasive angiography without coronary intervention were contacted with the permission of their referring physician. Inclusion criteria were age older than 40 years, recent (within 3 months) SPECT–myocardial perfusion imaging examination, and high clinical likelihood of being referred for invasive angiography. Exclusion criteria were acute clinical instability, contraindication to adenosine (eg, advanced heart blockage, asthma, critical aortic stenosis, or systolic blood pressure < 90 mm Hg), and contraindication to iodinated contrast material (eg, known allergy or serum creatinine level > 1.5 mg/dL). We also excluded pregnant patients, patients who previously had undergone coronary artery bypass graft placement, and patients with atrial fibrillation. Of 768 subjects who met the inclusion criteria, 356 refused to participate, 137 had a serum creatinine level higher than 1.5 mg/dL, 77 had undergone coronary artery bypass graft placement, 59 were in atrial fibrillation, 44 had asthma, 18 were allergic to iodinated contrast material, 18 were taking metformin, 10 were clinically unstable, seven had critical aortic stenosis, and one had advanced heart blockage. An additional six subjects did not undergo invasive angiography. The recruitment period was from March 2008 to May 2009. Our institutional review board approved the study protocol, and all patients signed an informed consent form prior to their enrollment in the study.
Stress Myocardial CT Perfusion Protocol
CT perfusion imaging was performed by using a Somatom Definition dual-source CT scanner (Siemens Medical Solutions, Forchheim, Germany). Intravenous catheters were placed in the antecubital veins bilaterally: A 20-gauge catheter was used for adenosine (Astellas Pharma) infusion on the right, and an 18-gauge catheter was used for contrast material delivery on the left. After obtaining scout images, we used a test bolus technique to determine the optimal timing of contrast material delivery: 10 mL of contrast material (370 mg of iopamidol per milliliter, Isovue 370; Bracco Diagnostics, Princeton, NJ) was injected at 4 mL/sec and followed by a 20-mL saline flush. We then started the infusion of adenosine, which was administered at 140 µg/kg/min for 3 minutes. Near the end of the infusion, stress scanning was performed from the level of the carina to the diaphragm with helical-mode retrospective electrocardiographic (ECG) gating.
CT perfusion images were acquired by using a dual-source CT scanner at 2 (source of x-ray beam)×32 (rows of detectors)×0.6 mm (width of detector) with a gantry rotation time of 330 msec with a half-scan reconstruction algorithm and a dual-source technique, which resulted in a temporal resolution of 83 msec without use of β-blockers or a vasodilator. The tube voltage was selected according to the body mass index (BMI): 100 kV was used if the BMI was lower than 30 kg/m2, and 120 kV was used if the BMI was equal to or higher than 30 kg/m2. The tube current varied from 330 to 370 mAs according to the patient’s size. ECG-based tube current modulation was used with a pulsing window of 60%–70% of the R-R interval to minimize radiation exposure. Automatic heart rate–based adaptive pitch selection (0.2–0.4) was enabled, and 65 mL of iopamidol was injected at a rate of 4–5 mL/sec according to the scanning duration. Throughout the adenosine infusion, the patient’s symptoms, heart rate, blood pressure, ECG readings, and rhythm strips were registered and monitored by an Advanced Cardiac Life Support–certified radiologist or cardiologist (R.C.C., L.D.S., R.B., B.G.).
Immediately after the stress images were acquired, the adenosine infusion was discontinued. At least 5 minutes were allotted after the infusion to allow the heart rate to return to baseline and to ensure the resolution of any symptoms before cardiac CT angiographic rest images were obtained. To reduce radiation exposure, an axial-mode prospectively ECG-gated (22) (Siemens Sequential Scanning) acquisition centered at 65% of the R-R interval was performed by using a tube current varying from 150 to 258 mA and a section thickness of 0.75 mm (collimation, 32 × 0.75 mm). The same tube voltage (100 or 120 kV) and approximately the same contrast material volumes (65–70 mL) were used for the stress and rest image acquisitions. In some cases, during rest scanning, we used 70 mL of contrast material due to a longer scanning time for the axial (prospectively ECG-gated) mode, which is sometimes increased because the scan acquisition only takes place on every second heartbeat to allow for the table movement and ECG synchronization.
Data Analysis
Two level-three fellowship-trained cardiac CT image readers, a radiologist with 3 years experience (J.A.R.) and a cardiologist with 2 years experience (L.D.S.), both of whom were blinded to all patient identifiers and clinical data, independently analyzed the cardiac CT angiographic and CT perfusion images in a three-step fashion:
Step 1: cardiac CT angiographic image interpretation.—Raw data from the stress CT image acquisition were used to reconstruct images with a section thickness of 0.75 mm and an overlap of 0.4 mm at every 10% of the cardiac cycle. The resulting multiple-phase data set was used for cardiac CT angiographic analysis of axial images, multiplanar reformatted images, and thin-slab reformatted maximum intensity projection images. When the retrospectively ECG-gated (helical) stress scanning data set did not yield diagnostic information for coronary analysis, we also used the prospectively ECG-triggered (axial) rest images obtained in five (14%) of the 35 patients. Plaques were classified according to severity of luminal narrowing as mild (<50%), moderate (50%–69%), and severe (>70%). Reader confidence in the stenosis severity assigned for each vessel was graded by using a four-point scale: A score of 1 meant not confident; 2, low confidence; 3, intermediate confidence; and 4, high confidence.
Step 2: CT perfusion image interpretation.—Stress and rest CT images were reconstructed at 65% of the R-R interval by using a B10f kernel. To ensure consistent analyses, the stress and rest images were coregistered in the same spatial location at a Leonardo workstation (Siemens Medical Solutions) by using the mitral annulus as a proximal reference and the left ventricular apex as a distal reference. The stress and rest images were read side by side in the short-axis view at a 10-mm section thickness. We used a user-defined narrow window width and window level setting to better evaluate subtle myocardial attenuation differences, as described previously (23). Perfusion defects were graded for extent and reversibility (fixed, partial reversibility, or complete reversibility) and were classified as transmural if they involved 50% or more of the myocardial wall thickness and as subendocardial if they involved less than 50% of the myocardial wall thickness. We also assessed the multiple-phase data set to confirm that the suspected perfusion defect persisted throughout all phases of the cardiac cycle and thus differentiate true defects from artifacts (24). The standard American College of Cardiology–American Heart Association 17-segment model for standardized myocardial segmentation was used for the perfusion image readings (25).
Step 3: cardiac CT angiographic stenosis reclassification.—Readers were allowed to reclassify the stenosis severity and their confidence in the determined stenosis severity on the basis of perfusion image readings. The distribution of perfusion defects in the left ventricular myocardium was assigned on the basis of the coronary anatomy previously observed during the cardiac CT angiographic image interpretations. During this reclassification process, careful attention was given to correlate the coronary anatomy with the respective myocardial territory supplied by each coronary vessel. We also assessed interobserver variability according to three categories: noninterpretable, presence of significant stenosis, and absence of significant stenosis.
Reference Standard and Radiation Dose
Quantitative coronary angiography (QCA) was considered the reference standard and was performed offsite, at an independent core laboratory (Harrington McLaughlin Heart and Vascular Institute, Case Western Reserve University, Cleveland, Ohio). The percentage diameter of stenosis was calculated by using an automated contour detection algorithm (CAAS II Analysis System; Pie Medical, Maastricht, the Netherlands) in at least two orthogonal angiographic views. The effective radiation dose for both stress and rest scanning was calculated as the product of the dose-length product times a conversion coefficient for the chest (k = 0.017 mSv/[mGy · cm]) (26).
Statistical Analyses
Continuous variable data are reported as means ± standard deviations, and categorical variable data are presented as percentages. The diagnostic accuracy of cardiac CT angiography for the detection of significant stenosis both before and after the CT perfusion image interpretations, with QCA as the reference standard, was expressed as sensitivity, specificity, positive predictive value (PPV), and negative predictive value (NPV); 95% confidence intervals were provided for each estimate. Calculations were performed on both a per-vessel (left anterior descending, left circumflex, and right coronary arteries) basis and a per-patient basis, with two thresholds for significant stenosis considered: greater than 50% luminal narrowing and greater than 70% luminal narrowing. Noninterpretable vessels were assumed to represent significant stenosis before CT perfusion analysis. After CT perfusion analysis, noninterpretable vessels were considered to be positive for stenosis only if they corresponded to a perfusion defect in the same vascular distribution. All reported diagnostic accuracy results are based on a consensus between the two readers. P= .05 at two-tailed probability analysis was considered to indicate statistical significance.
For assessment of interobserver variability, agreement between the readers regarding the stenosis severity determined before and after CT perfusion analysis was evaluated by using κ statistics. Sensitivity and specificity were compared by using McNemar testing, and areas under the receiver operating characteristic curve were compared by using the ROCCOMP command (Stata 10; StataCorp, College Station, Tex). All statistical analyses were performed by using Stata IC, version 10.0, software (StataCorp).
Results
Patient Characteristics
Patient characteristics are summarized in Table 1. Of the 35 study participants (mean age, 61.2 years ± 10.7 [standard deviation]), 83% were men, 31% had diabetes mellitus, 43% were obese (BMI ≥ 30.0 kg/m2), 66% were former or current smokers, 63% had experienced angina pectoris previously, and 37% had experienced a myocardial infarction previously. In all patients, invasive angiography was performed within 30 days of the cardiac CT angiographic examination.
Table 1.
Baseline Characteristics of 35 Study Patients
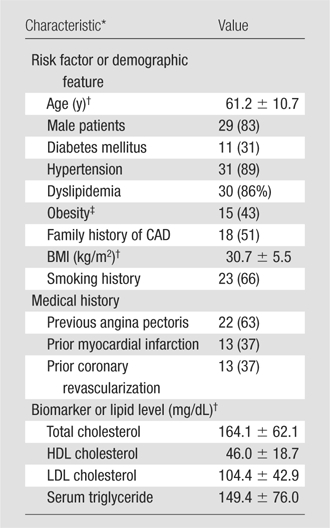
Note.—Unless otherwise noted, data are numbers of patients (of total of 35 patients), with percentages in parentheses. Family history, diabetes, and dyslipidemia were classified according to documentation in the cardiologist’s notes.
CABG = coronary artery bypass graft placement, CVA = cerebrovascular accident, HDL = high-density lipoprotein, LDL = low-density lipoprotein, PCI = percutaneous coronary intervention.
Mean value ± standard deviation.
Obesity was defined as a BMI greater than or equal to 30 kg/m2.
CT Imaging Parameters
Imaging parameters are summarized in Table 2. During image acquisition, the mean heart rate was 78.0 beats per minute ± 12.7 at stress and 68.7 beats per minute ± 11.5 at rest (P < .001). The mean total image acquisition time was 8.5 minutes ± 2.3. Mean effective radiation doses for the stress and rest acquisitions were 9.8 mSv ± 4.5 and 2.0 mSv ± 0.7, respectively. The mean total effective radiation exposure was 11.8 mSv ± 4.5.
Table 2.
Myocardial CT Perfusion Imaging Parameters
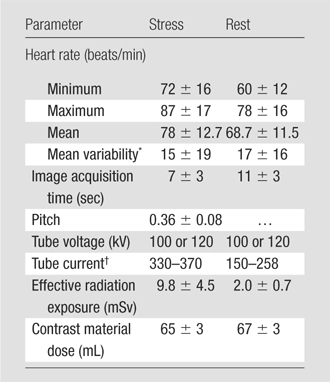
Note.—Unless otherwise noted, data are mean values ± standard deviations.
Mean variability is the maximal heart rate value minus the minimal heart rate value.
Data are ranges. For retrospective triggering (helical scanning) at stress imaging, tube current is cited as the total tube current times the gantry rotation time (∼0.33 sec), in milliampere seconds. For prospective triggering (sequential scanning) at rest imaging, tube current is cited as the total tube current times the exposure time (∼0.2 sec), in milliamperes.
Diagnostic Accuracy
Values of the diagnostic accuracy of the consensus reading of cardiac CT angiographic findings for the detection of obstructive CAD before and after perfusion analysis (Figs 1–3), with significant stenosis defined as greater than 50% luminal narrowing and as greater than 70% luminal narrowing at QCA, are summarized in Table 3. With a threshold of greater than 50% luminal narrowing used to define significant stenosis, the stenosis severity for 26 (25%) of the 105 vessels analyzed was reclassified, and the stenosis severity for 79 (75%) vessels was not. The stenosis reclassification of 21 (81%) of the 26 vessels was ultimately in agreement with QCA findings, and the reclassification of five (19%) vessels was not. The stenosis severity of 64 (81%) of the 79 vessels that were not reclassified was ultimately in agreement with that rendered at QCA, and the stenosis severity of 15 (19%) vessels was not. Mean values of the diagnostic accuracy of pre–perfusion analysis cardiac CT angiography were as follows: sensitivity, 83% (range, 68.6%–93.0%); specificity, 71% (range, 58.7%–82.1%); PPV, 66% (range, 51.7%–78.5%); and NPV, 87% (range, 74.2%–94.4%). Mean post–perfusion analysis diagnostic accuracy values were as follows: sensitivity, 91% (range, 77.4%–97.3%); specificity, 91% (range, 80.4%–96.4%); PPV, 86% (range, 72.6%–94.8%); and NPV, 93% (range, 84.1%–98.2%). The area under the receiver operating characteristic curve increased significantly, from 0.77 to 0.90, according to perfusion analysis findings (P = .003).
Figure 1a:
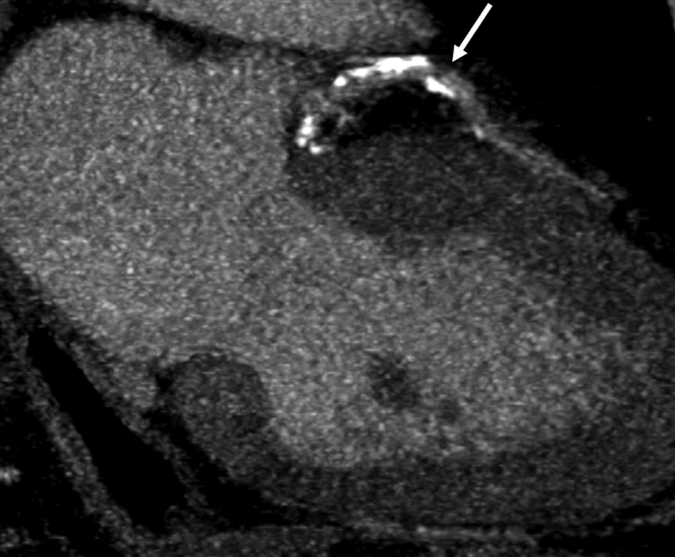
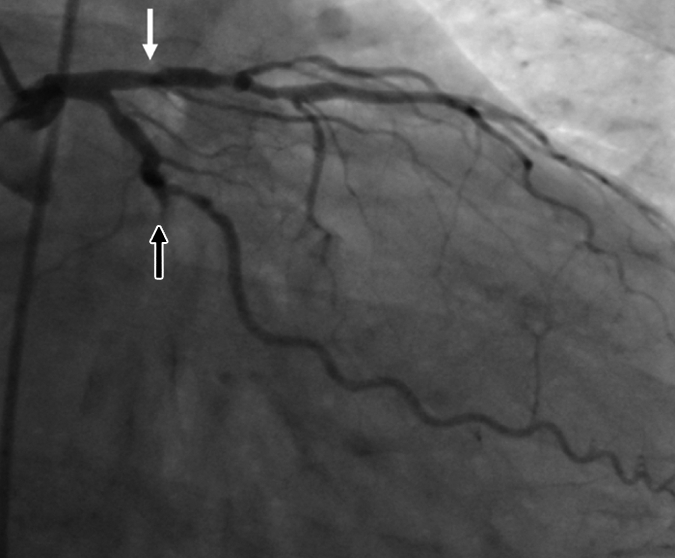
Images in 63-year-old man with history of CAD and single episode of neurocardiogenic syncope. (a, d) Curved multiplanar reformatted cardiac CT angiographic images read before the perfusion image reading show (a) mixed proximal left anterior descending arterial lesion (arrow) deemed to be significant stenosis and (d) heavily calcified right coronary artery that was considered noninterpretable. (b, e) Thick short-axis CT perfusion images obtained at midventricular level show inferolateral perfusion defect during stress CT perfusion (arrows in b) that is completely reversible on rest CT perfusion image (arrows in e). (c, f) Reference-standard QCA images show mild disease in left anterior descending (white arrow) and right coronary arteries and subtotal occlusion of left circumflex artery (black arrow) causing a perfusion defect. The left circumflex arterial lesion is also appreciated at cardiac CT angiography (d).
Figure 1b:
Images in 63-year-old man with history of CAD and single episode of neurocardiogenic syncope. (a, d) Curved multiplanar reformatted cardiac CT angiographic images read before the perfusion image reading show (a) mixed proximal left anterior descending arterial lesion (arrow) deemed to be significant stenosis and (d) heavily calcified right coronary artery that was considered noninterpretable. (b, e) Thick short-axis CT perfusion images obtained at midventricular level show inferolateral perfusion defect during stress CT perfusion (arrows in b) that is completely reversible on rest CT perfusion image (arrows in e). (c, f) Reference-standard QCA images show mild disease in left anterior descending (white arrow) and right coronary arteries and subtotal occlusion of left circumflex artery (black arrow) causing a perfusion defect. The left circumflex arterial lesion is also appreciated at cardiac CT angiography (d).
Figure 1c:
Images in 63-year-old man with history of CAD and single episode of neurocardiogenic syncope. (a, d) Curved multiplanar reformatted cardiac CT angiographic images read before the perfusion image reading show (a) mixed proximal left anterior descending arterial lesion (arrow) deemed to be significant stenosis and (d) heavily calcified right coronary artery that was considered noninterpretable. (b, e) Thick short-axis CT perfusion images obtained at midventricular level show inferolateral perfusion defect during stress CT perfusion (arrows in b) that is completely reversible on rest CT perfusion image (arrows in e). (c, f) Reference-standard QCA images show mild disease in left anterior descending (white arrow) and right coronary arteries and subtotal occlusion of left circumflex artery (black arrow) causing a perfusion defect. The left circumflex arterial lesion is also appreciated at cardiac CT angiography (d).
Figure 1d:
Images in 63-year-old man with history of CAD and single episode of neurocardiogenic syncope. (a, d) Curved multiplanar reformatted cardiac CT angiographic images read before the perfusion image reading show (a) mixed proximal left anterior descending arterial lesion (arrow) deemed to be significant stenosis and (d) heavily calcified right coronary artery that was considered noninterpretable. (b, e) Thick short-axis CT perfusion images obtained at midventricular level show inferolateral perfusion defect during stress CT perfusion (arrows in b) that is completely reversible on rest CT perfusion image (arrows in e). (c, f) Reference-standard QCA images show mild disease in left anterior descending (white arrow) and right coronary arteries and subtotal occlusion of left circumflex artery (black arrow) causing a perfusion defect. The left circumflex arterial lesion is also appreciated at cardiac CT angiography (d).
Figure 1e:
Images in 63-year-old man with history of CAD and single episode of neurocardiogenic syncope. (a, d) Curved multiplanar reformatted cardiac CT angiographic images read before the perfusion image reading show (a) mixed proximal left anterior descending arterial lesion (arrow) deemed to be significant stenosis and (d) heavily calcified right coronary artery that was considered noninterpretable. (b, e) Thick short-axis CT perfusion images obtained at midventricular level show inferolateral perfusion defect during stress CT perfusion (arrows in b) that is completely reversible on rest CT perfusion image (arrows in e). (c, f) Reference-standard QCA images show mild disease in left anterior descending (white arrow) and right coronary arteries and subtotal occlusion of left circumflex artery (black arrow) causing a perfusion defect. The left circumflex arterial lesion is also appreciated at cardiac CT angiography (d).
Figure 1f:
Images in 63-year-old man with history of CAD and single episode of neurocardiogenic syncope. (a, d) Curved multiplanar reformatted cardiac CT angiographic images read before the perfusion image reading show (a) mixed proximal left anterior descending arterial lesion (arrow) deemed to be significant stenosis and (d) heavily calcified right coronary artery that was considered noninterpretable. (b, e) Thick short-axis CT perfusion images obtained at midventricular level show inferolateral perfusion defect during stress CT perfusion (arrows in b) that is completely reversible on rest CT perfusion image (arrows in e). (c, f) Reference-standard QCA images show mild disease in left anterior descending (white arrow) and right coronary arteries and subtotal occlusion of left circumflex artery (black arrow) causing a perfusion defect. The left circumflex arterial lesion is also appreciated at cardiac CT angiography (d).
Figure 3a:
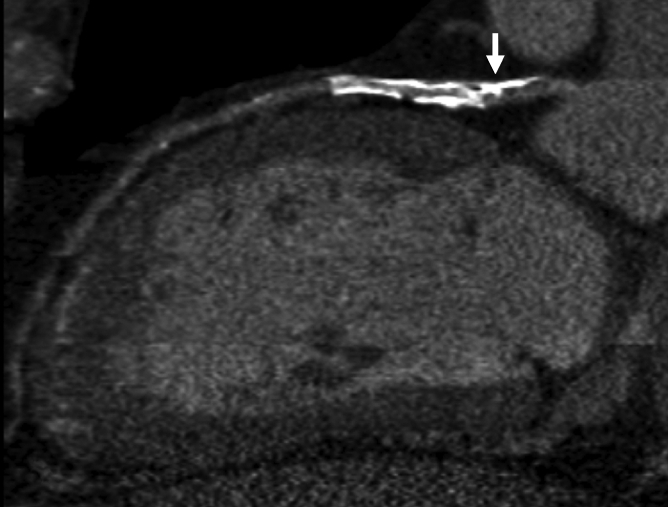
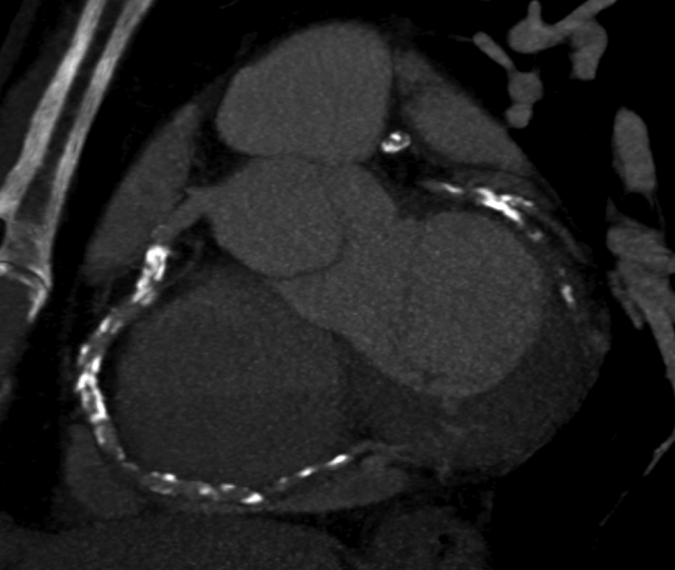
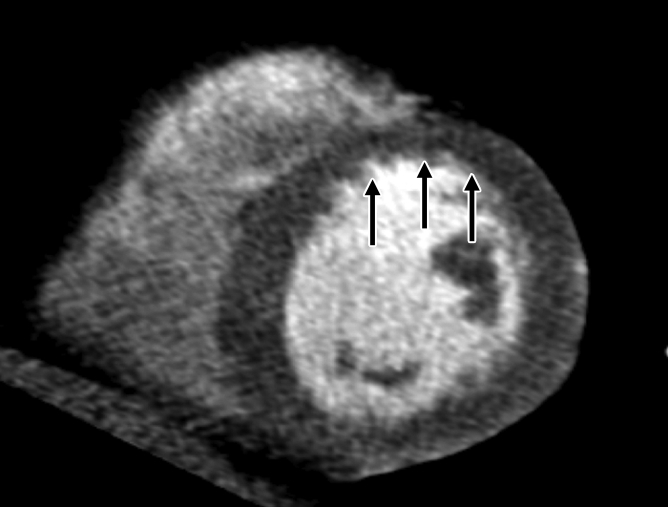
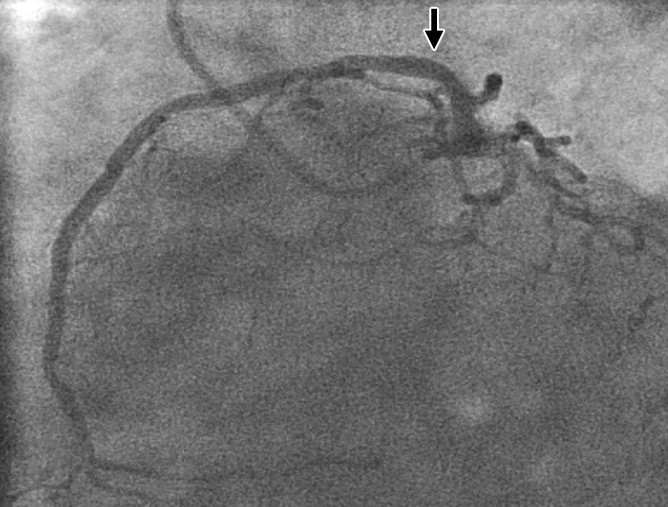
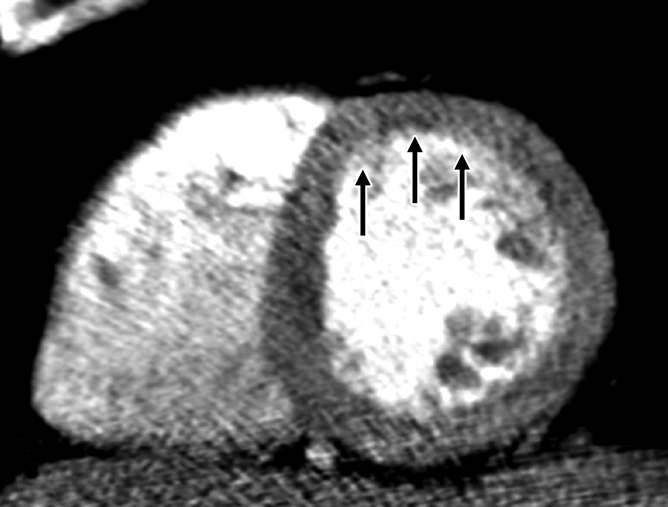
Images in 70-year-old man with history of diabetes mellitus and CAD. (a) Curved multiplanar reformatted cardiac CT angiographic image read before perfusion image reading shows stent in proximal left anterior descending artery, with proximal calcified plaque that was deemed to be significant disease (arrow). (b, d) Thick short-axis CT perfusion images obtained at midventricular level show no perfusion defect on (b) stress CT perfusion (arrows) or (d) rest CT perfusion (arrows) images in the left anterior descending distribution. (c)Reference-standard invasive angiogram findings confirm the absence of significant disease in left anterior descending distribution (arrow) determined at postperfusion cardiac CT angiographic image reading.
Figure 3b:
Images in 70-year-old man with history of diabetes mellitus and CAD. (a) Curved multiplanar reformatted cardiac CT angiographic image read before perfusion image reading shows stent in proximal left anterior descending artery, with proximal calcified plaque that was deemed to be significant disease (arrow). (b, d) Thick short-axis CT perfusion images obtained at midventricular level show no perfusion defect on (b) stress CT perfusion (arrows) or (d) rest CT perfusion (arrows) images in the left anterior descending distribution. (c)Reference-standard invasive angiogram findings confirm the absence of significant disease in left anterior descending distribution (arrow) determined at postperfusion cardiac CT angiographic image reading.
Figure 3c:
Images in 70-year-old man with history of diabetes mellitus and CAD. (a) Curved multiplanar reformatted cardiac CT angiographic image read before perfusion image reading shows stent in proximal left anterior descending artery, with proximal calcified plaque that was deemed to be significant disease (arrow). (b, d) Thick short-axis CT perfusion images obtained at midventricular level show no perfusion defect on (b) stress CT perfusion (arrows) or (d) rest CT perfusion (arrows) images in the left anterior descending distribution. (c)Reference-standard invasive angiogram findings confirm the absence of significant disease in left anterior descending distribution (arrow) determined at postperfusion cardiac CT angiographic image reading.
Figure 3d:
Images in 70-year-old man with history of diabetes mellitus and CAD. (a) Curved multiplanar reformatted cardiac CT angiographic image read before perfusion image reading shows stent in proximal left anterior descending artery, with proximal calcified plaque that was deemed to be significant disease (arrow). (b, d) Thick short-axis CT perfusion images obtained at midventricular level show no perfusion defect on (b) stress CT perfusion (arrows) or (d) rest CT perfusion (arrows) images in the left anterior descending distribution. (c)Reference-standard invasive angiogram findings confirm the absence of significant disease in left anterior descending distribution (arrow) determined at postperfusion cardiac CT angiographic image reading.
Table 3.
Diagnostic Accuracy of Cardiac CT Angiography for Detection of Significant Stenosis before and after Perfusion Analysis
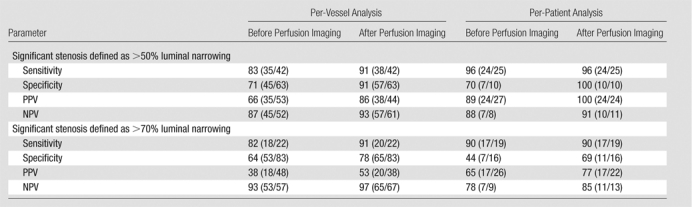
Note.—All data are percentages. The absolute numbers used to calculate the percentages are in parentheses. Per-vessel analysis was based on data from a total of 105 vessels. Per-patient analysis was based on data from a total of 35 patients.
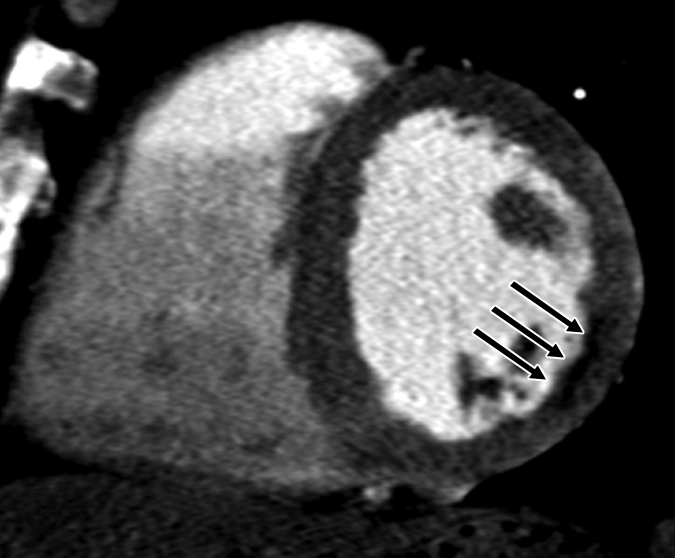
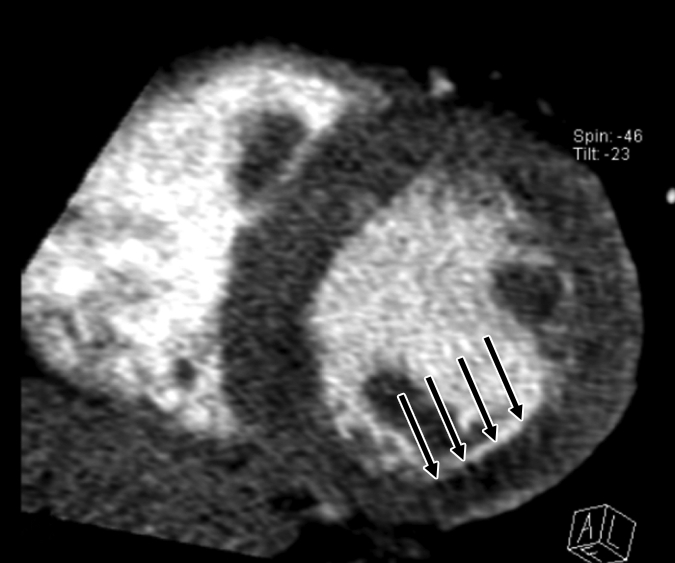
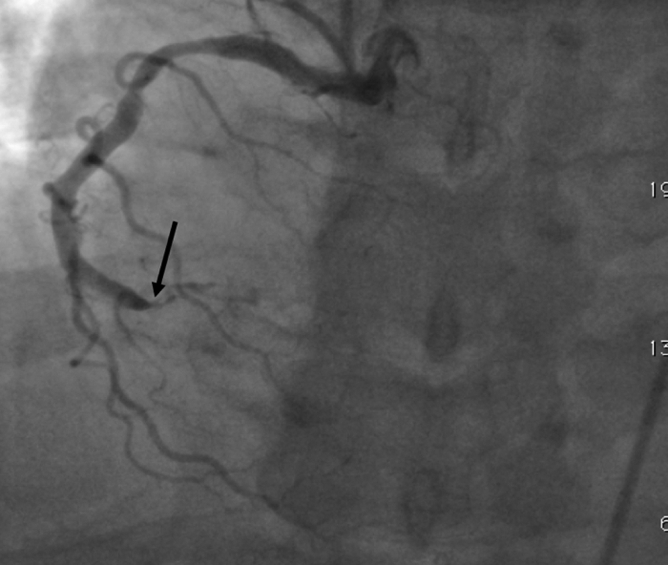
Figure 2a:
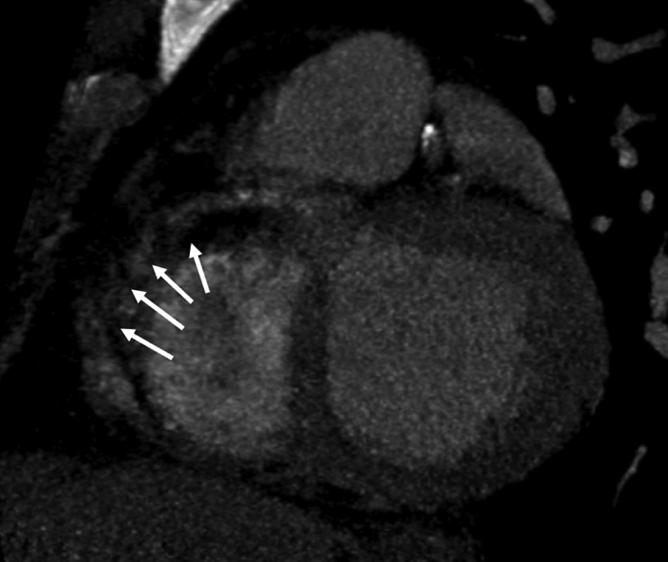
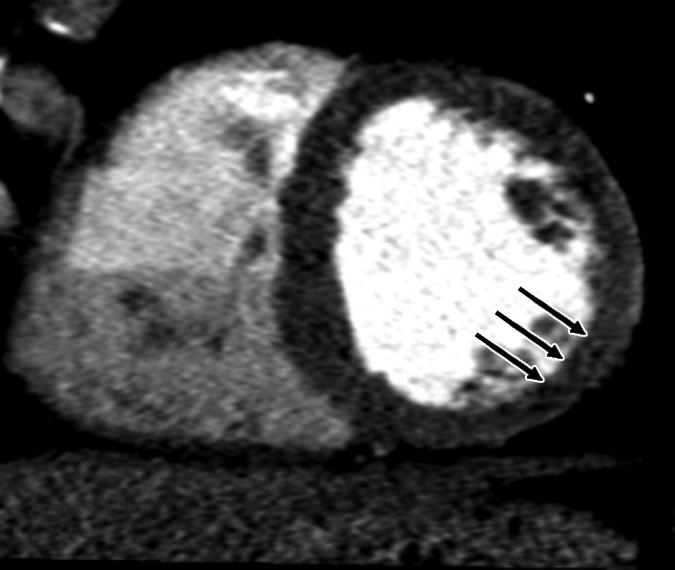
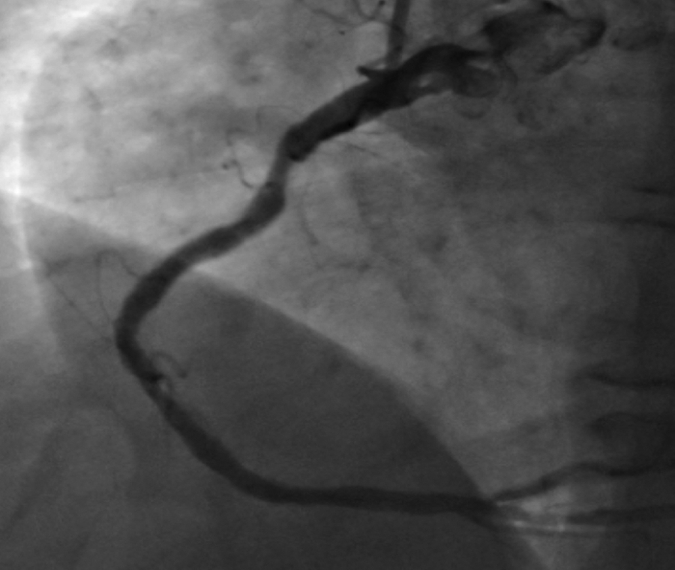
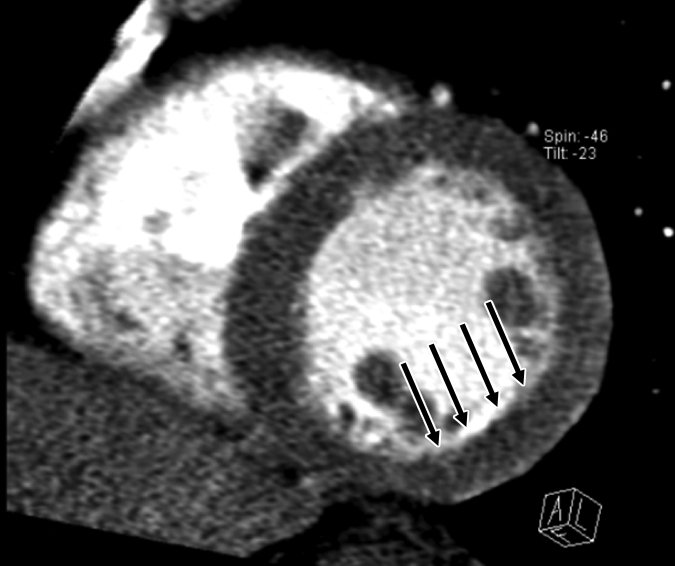
Images in 51-year-old man with history of diabetes mellitus who presented with typical angina. (a) Curved multiplanar reformatted cardiac CT angiographic image read before perfusion image reading shows prominent motion artifact in right coronary artery (arrows) that persisted through all cardiac phases. (b, d) Thick short-axis CT perfusion images obtained at midventricular levels show perfusion defect (arrows in b) during stress CT perfusion in the inferior and inferolateral segments that is partially reversible during rest CT perfusion (arrows in d). (c)Reference-standard invasive angiogram findings confirm the presence of severely stenotic lesion in right coronary artery (arrow) that was seen at postperfusion cardiac CT angiographic image reading.
Figure 2b:
Images in 51-year-old man with history of diabetes mellitus who presented with typical angina. (a) Curved multiplanar reformatted cardiac CT angiographic image read before perfusion image reading shows prominent motion artifact in right coronary artery (arrows) that persisted through all cardiac phases. (b, d) Thick short-axis CT perfusion images obtained at midventricular levels show perfusion defect (arrows in b) during stress CT perfusion in the inferior and inferolateral segments that is partially reversible during rest CT perfusion (arrows in d). (c)Reference-standard invasive angiogram findings confirm the presence of severely stenotic lesion in right coronary artery (arrow) that was seen at postperfusion cardiac CT angiographic image reading.
Figure 2c:
Images in 51-year-old man with history of diabetes mellitus who presented with typical angina. (a) Curved multiplanar reformatted cardiac CT angiographic image read before perfusion image reading shows prominent motion artifact in right coronary artery (arrows) that persisted through all cardiac phases. (b, d) Thick short-axis CT perfusion images obtained at midventricular levels show perfusion defect (arrows in b) during stress CT perfusion in the inferior and inferolateral segments that is partially reversible during rest CT perfusion (arrows in d). (c)Reference-standard invasive angiogram findings confirm the presence of severely stenotic lesion in right coronary artery (arrow) that was seen at postperfusion cardiac CT angiographic image reading.
Figure 2d:
Images in 51-year-old man with history of diabetes mellitus who presented with typical angina. (a) Curved multiplanar reformatted cardiac CT angiographic image read before perfusion image reading shows prominent motion artifact in right coronary artery (arrows) that persisted through all cardiac phases. (b, d) Thick short-axis CT perfusion images obtained at midventricular levels show perfusion defect (arrows in b) during stress CT perfusion in the inferior and inferolateral segments that is partially reversible during rest CT perfusion (arrows in d). (c)Reference-standard invasive angiogram findings confirm the presence of severely stenotic lesion in right coronary artery (arrow) that was seen at postperfusion cardiac CT angiographic image reading.
With a cutoff value of 70% luminal narrowing at QCA used to define significant stenosis, the stenosis severity of 19 (18%) of the 105 vessels was reclassified and the stenosis severity of 86 (82%) vessels was not. The stenosis reclassification for 18 (95%) of 19 vessels was in agreement with that rendered at invasive angiography, and the reclassification of one (5%) vessel was not. The stenosis severity of 77 (90%) of the 86 vessels that were not reclassified was in agreement with that rendered at invasive angiography, and the stenosis severity for nine (11%) vessels was not. Mean values of the diagnostic accuracy of pre–perfusion analysis cardiac CT angiography for the detection of significant CAD lesions were as follows: sensitivity, 82% (range, 59.7%–94.8%); specificity, 64% (range, 52.6%–74.1%); PPV, 38% (range, 24.0%–52.6%); and NPV, 93% (range, 83.0%–98.1%). Mean post–perfusion analysis diagnostic accuracy values were as follows: sensitivity, 91% (range, 70.8%–98.9%); specificity, 78% (range, 67.9%–86.6%); PPV, 53% (range, 35.8%–69.0%); and NPV, 97% (range, 89.6%–99.6%). The area under the receiver operating characteristic curve increased significantly, from 0.72 to 0.84, according to perfusion analysis findings (P = .049).
CT Perfusion Analysis
A total of 595 segments were assessed for perfusion analysis: 145 (24%) segments had perfusion abnormalities, and 451 (76%) did not. Of the segments with perfusion abnormalities, 53 (37%) had transmural perfusion defects and 92 (63%) had subendocardial defects. Nine (17%) of the 53 transmural defects were completely reversible, 24 (45%) were partially reversible, eight (15%) were minimally reversible, and 12 (23%) were not reversible. Among the 92 subendocardial defects, 43 (47%) were completely reversible, 39 (42%) were partially reversible, seven (8%) were minimally reversible, and three (3%) were not reversible.
Image Quality, Reader Confidence, and Interobserver Variability
Reader confidence in the stenosis classifications determined on a per-vessel basis at the cardiac CT angiographic examinations, both before and after perfusion analysis, are summarized in Table 4. On a per-vessel basis, 39 of the 105 vessels analyzed were considered noninterpretable. Of these 39 noninterpretable vessels, 35 (85%) were reclassified correctly. The mean score for confidence in the cardiac CT angiography–derived classification improved significantly, from 2.8 before perfusion analysis to 3.8 after perfusion analysis (P < .05).
Table 4.
Reader Confidence before and after Perfusion Analysis
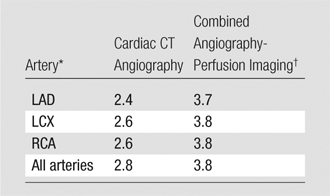
Note.—Data are scores for reader confidence in classifying stenosis severity in the given arteries. P < .05 for all comparisons of confidence scores between cardiac CT angiography and combined cardiac CT angiography–CT perfusion imaging.
LAD = left anterior descending artery, LCX = left circumflex artery, RCA = right coronary artery.
Combined angiography-perfusion imaging refers to cardiac CT angiography combined with CT perfusion imaging.
The main reason for the nondiagnostic image quality for the 105 vessels was blooming artifact caused by heavily calcified plaque in 32 (30%) vessels, followed by motion artifact in 16 (15%) vessels, the presence of stents in 11 (10%) vessels, poor contrast opacification in 10 (10%) vessels, and low contrast-to-noise ratio in seven (7%) vessels. In some cases, more than one factor contributed to suboptimal image quality. After CT perfusion analysis, agreement between the blinded independent readers regarding cardiac CT angiographic findings improved from 87% to 94% and κ values improved from 0.82 to 0.91.
Discussion
In this analysis of findings in a patient cohort at high risk for CAD who were enrolled for assessment of the feasibility of adenosine-mediated stress myocardial perfusion imaging with dual-source CT, we found CT perfusion to have incremental value at cardiac CT angiography for the detection of hemodynamically significant CAD, defined as greater than 50% luminal narrowing or greater than 70% luminal narrowing at QCA. All parameters of diagnostic accuracy were observed to increase after perfusion analysis. Moreover, specificity and area under the receiver operating characteristic curve improved significantly (P < .005) after the perfusion image readings. We, thus, found that the combination of cardiac CT angiography and CT perfusion imaging in a single examination was feasible and facilitated improved diagnostic accuracy, a higher level of reader confidence, and better interobserver variability. Initial data from the same cohort of patients (20) indicated that the diagnostic accuracy of CT perfusion imaging for the detection of myocardial perfusion defects (79% sensitivity, 80% specificity) was comparable to that of combination SPECT–myocardial perfusion imaging (67% sensitivity, 83% specificity) when stenosis involving greater than 50% luminal narrowing at QCA served as the reference standard on a per-vessel basis.
In the current study, we demonstrated the utility of a combined protocol involving cardiac CT angiography and CT perfusion imaging for the classification of stenosis significance in cases of obstructive CAD, especially since the PPV was observed to increase by more than 20% after the incorporation of CT perfusion analysis. Such a protocol may be particularly valuable in the examination of patients with a high pretest probability of CAD, since they are usually found at presentation to have a large calcific plaque burden that leads to lower overall image quality and diagnostic accuracy. Moreover, a previous study of single-source 64-detector CT revealed that, given a high pretest probability, a negative cardiac CT angiographic result still corresponds to an estimated posttest probability of CAD of 17% and thus an important fraction of patients with disease not being identified (11). Therefore, at present, cardiac CT angiography is not indicated for the assessment of CAD in high-risk patients, who are usually referred for myocardial perfusion imaging and/or invasive angiography (10).
Our study results showed the diagnostic performance of dual-source CT in the detection of hemodynamically significant lesions (luminal narrowing > 50%) in a high-risk patient cohort to be comparable to previously reported results (7–9). These studies revealed sensitivities ranging from 91.0% to 98.3%, specificities of 84.0%–97.1%, PPVs of 70.0%–89.4%, and NPVs of 96.0%–99.6% (7–9). The reported performance of single-source multidetector CT is slightly poorer in the same population, with sensitivities ranging from 75.0% to 91.7%, specificities of 81%–93%, PPVs of 81.1%–95.0%, and NPVs of 82%–89% (3,6). Achenbach and co-workers (1) compared multidetector CT and dual-source CT in a group of randomly selected patients and observed the performance of dual-source CT to be superior to that of 64-detector CT. However, unlike the protocols used in these prior studies, our imaging protocol was optimized for CT perfusion imaging rather than cardiac CT angiography. We did not use β-blockers for heart rate control or nitroglycerin for coronary vasodilation; the use of either of these agents probably would have improved image quality and diagnostic accuracy at cardiac CT angiography. Furthermore, although all vessels smaller than a cutoff diameter of 1.5 mm were excluded in these prior studies, we included all vessels in our analysis.
Our study results are consistent with reported data on the diagnostic accuracy of combined protocols involving PET–myocardial perfusion imaging fused with cardiac CT angiography and SPECT–myocardial perfusion imaging fused with cardiac CT angiography, which, respectively, had sensitivities of 90% and 96%, specificities of 98% and 95%, PPVs of 82% and 77%, and NPVs of 99% and 99% (16,17).
At clinical cardiac CT angiography, borderline and intermediate stenotic lesions (50%–69% luminal narrowing) whose severity and hemodynamic significance are difficult to establish are often seen. Furthermore, artifacts from calcium, stents, and coronary motion frequently result in noninterpretable segments. Thus, the incorporation of CT perfusion imaging in a standard clinical cardiac CT angiographic protocol would substantially improve diagnostic confidence and diagnostic accuracy in these difficult situations.
Information on myocardial ischemia in addition to coronary anatomy may help to guide clinical management and to determine the need for coronary revascularization. A recent COURAGE (Clinical Outcomes Utilizing Revascularization and Aggressive Drug Evaluation) Trial substudy revealed that myocardial perfusion imaging combined with SPECT can enable the identification of patients who will benefit most from invasive angiography and coronary revascularization in addition to medical therapy versus those who should receive medical therapy alone (27). Moreover, the use of fractional flow reserve during invasive angiography has been shown to be superior to the use of invasive angiography alone, yielding better outcomes and reduced costs (28). Thus, there is a growing body of evidence demonstrating the importance of combining anatomy and physiologic information to optimize patient care. Results of the present study further support this assertion by demonstrating the feasibility and additional value of perfusion imaging, relative to anatomic imaging performed by using a single modality, with high diagnostic accuracy and acceptable radiation dose.
Our study had some limitations. The small sample size resulted in a wide range of confidence intervals for diagnostic accuracy values. Also, we did not adjust the data for clustering of segments within patients, even using the McNemar test, as this could have caused our results to have slightly lower diagnostic accuracy. Nevertheless, we observed a significant increase in C-statistic and specificity values after perfusion analysis compared with these values before perfusion analysis.
Our imaging protocol was optimized for myocardial perfusion analysis, with a slightly decreased contrast material infusion rate. Additional studies and further protocol developments with different postprocessing data algorithms and/or optimized contrast material infusion rates may reveal a way to optimize a protocol for both CT perfusion imaging and cardiac CT angiography without facilitating detriments to either component of the examination. The use of new-generation scanners with larger z-axis coverage, better spatial resolution, and faster temporal resolution may also lead to better image quality. The described protocol requires double the contrast material dose required for conventional CT angiography and therefore should be avoided in patients with renal dysfunction. Although performing axial (prospective ECG triggered) examinations has been shown in recent studies (22) to substantially decrease the radiation dose, we chose not to use axial scanning for the stress image acquisitions because of the chronotropic effects of adenosine: The use of this agent would have increased the heart rate beyond the low rates known to be most suitable for axial scanning. If future scanners enable reliable prospectively ECG-gated axial scanning at high heart rates, further decreases in radiation dose may be achieved. Finally, there was a potential for referral bias in our study design. However, patients with normal SPECT findings were also included if there was a high clinical likelihood that they would be referred for invasive angiography. Nevertheless, the risk of referral bias in this high-risk population could not be completely avoided.
In conclusion, the results of this preliminary study show that use of a combined dual-source CT protocol for the assessment of myocardial perfusion and coronary anatomy is feasible and involves acceptable contrast material and radiation doses. Moreover, the addition of CT perfusion imaging improves the diagnostic accuracy of cardiac CT angiography and provides an opportunity for simultaneous assessment of anatomy and perfusion in a single examination. This protocol may be particularly useful for facilitating the accurate classification of stenosis significance in high-risk patients with a large calcified plaque burden or stents and could help to guide clinicians in assessing the need for invasive angiography and revascularization.
Advance in Knowledge.
CT assessment of myocardial stress perfusion combined with cardiac CT angiography in a dual-source protocol is feasible and improves the diagnostic accuracy of cardiac CT angiography in the detection of hemodynamically significant stenosis—facilitating a significant increase in the area under the receiver operating characteristic curve (from 0.77 to 0.90 [P < .005])—and can be performed with a reasonable mean radiation dose of 11.8 mSv ± 4.5.
Implication for Patient Care.
Use of myocardial stress perfusion CT combined with cardiac CT angiography in a single examination might lead to better detection of hemodynamically significant stenosis and could guide clinicians’ assessment of the need for invasive angiography and revascularization.
Received June 9, 2009; revision requested July 27; revision received August 26; accepted September 16; final version accepted October 1.
Supported in part by a grant from Astellas Pharma and the New York Cardiac Center. R.C.C. supported by Astellas Pharma. R.B., L.D.S., I.S.R., and B.G. supported by National Institutes of Health grant 1T32 HL076136.
Funding: This research was supported by National Institutes of Health (grant 1T32 HL076136).
See Materials and Methods for pertinent disclosures.
See also the editorial by de Roos in this issue.
Abbreviations:
- BMI
- body mass index
- CAD
- coronary artery disease
- ECG
- electrocardiography
- NPV
- negative predictive value
- PPV
- positive predictive value
- QCA
- quantitative coronary angiography
References
- 1.Achenbach S, Ropers U, Kuettner A, et al. Randomized comparison of 64-slice single- and dual-source computed tomography coronary angiography for the detection of coronary artery disease. JACC Cardiovasc Imaging 2008;1:177–186 [DOI] [PubMed] [Google Scholar]
- 2.Budoff MJ, Dowe D, Jollis JG, et al. Diagnostic performance of 64-multidetector row coronary computed tomographic angiography for evaluation of coronary artery stenosis in individuals without known coronary artery disease: results from the prospective multicenter ACCURACY (Assessment by Coronary Computed Tomographic Angiography of Individuals Undergoing Invasive Coronary Angiography) Trial. J Am Coll Cardiol 2008;52:1724–1732 [DOI] [PubMed] [Google Scholar]
- 3.Husmann L, Schepis T, Scheffel H, et al. Comparison of diagnostic accuracy of 64-slice computed tomography coronary angiography in patients with low, intermediate, and high cardiovascular risk. Acad Radiol 2008;15:452–461 [DOI] [PubMed] [Google Scholar]
- 4.Johnson TR, Nikolaou K, Busch S, et al. Diagnostic accuracy of dual-source computed tomography in the diagnosis of coronary artery disease. Invest Radiol 2007;42:684–691 [DOI] [PubMed] [Google Scholar]
- 5.Meijboom WB, Meijs MF, Schuijf JD, et al. Diagnostic accuracy of 64-slice computed tomography coronary angiography: a prospective, multicenter, multivendor study. J Am Coll Cardiol 2008;52:2135–2144 [DOI] [PubMed] [Google Scholar]
- 6.Miller JM, Rochitte CE, Dewey M, et al. Diagnostic performance of coronary angiography by 64-row CT. N Engl J Med 2008;359:2324–2336 [DOI] [PubMed] [Google Scholar]
- 7.Rixe J, Rolf A, Conradi G, et al. Detection of relevant coronary artery disease using dual-source computed tomography in a high probability patient series: comparison with invasive angiography. Circ J 2009;73:316–322 [DOI] [PubMed] [Google Scholar]
- 8.Scheffel H, Alkadhi H, Plass A, et al. Accuracy of dual-source CT coronary angiography: first experience in a high pre-test probability population without heart rate control. Eur Radiol 2006;16:2739–2747 [DOI] [PMC free article] [PubMed] [Google Scholar]
- 9.Tsiflikas I, Brodoefel H, Reimann AJ, et al. Coronary CT angiography with dual source computed tomography in 170 patients. Eur J Radiol 2009Mar 2 [Epub ahead of print] [DOI] [PubMed] [Google Scholar]
- 10.Bluemke DA, Achenbach S, Budoff M, et al. Noninvasive coronary artery imaging: magnetic resonance angiography and multidetector computed tomography angiography: a scientific statement from the American Heart Association Committee on Cardiovascular Imaging and Intervention of the Council on Cardiovascular Radiology and Intervention, and the councils on clinical cardiology and cardiovascular disease in the young. Circulation 2008;118:586–606 [DOI] [PubMed] [Google Scholar]
- 11.Meijboom WB, van Mieghem CA, Mollet NR, et al. 64-slice computed tomography coronary angiography in patients with high, intermediate, or low pretest probability of significant coronary artery disease. J Am Coll Cardiol 2007;50:1469–1475 [DOI] [PubMed] [Google Scholar]
- 12.Ong TK, Chin SP, Liew CK, et al. Accuracy of 64-row multidetector computed tomography in detecting coronary artery disease in 134 symptomatic patients: influence of calcification. Am Heart J 2006;151:1323.e1–1323.e6 [DOI] [PubMed] [Google Scholar]
- 13.Pugliese F, Weustink AC, Van Mieghem C, et al. Dual source coronary computed tomography angiography for detecting in-stent restenosis. Heart 2008;94:848–854 [DOI] [PubMed] [Google Scholar]
- 14.Rist C, von Ziegler F, Nikolaou K, et al. Assessment of coronary artery stent patency and restenosis using 64-slice computed tomography. Acad Radiol 2006;13:1465–1473 [DOI] [PubMed] [Google Scholar]
- 15.Husmann L, Herzog BA, Gaemperli O, et al. Diagnostic accuracy of computed tomography coronary angiography and evaluation of stress-only single-photon emission computed tomography/computed tomography hybrid imaging: comparison of prospective electrocardiogram-triggering vs. retrospective gating. Eur Heart J 2009;30:600–607 [DOI] [PubMed] [Google Scholar]
- 16.Namdar M, Hany TF, Koepfli P, et al. Integrated PET/CT for the assessment of coronary artery disease: a feasibility study. J Nucl Med 2005;46:930–935 [PubMed] [Google Scholar]
- 17.Rispler S, Keidar Z, Ghersin E, et al. Integrated single-photon emission computed tomography and computed tomography coronary angiography for the assessment of hemodynamically significant coronary artery lesions. J Am Coll Cardiol 2007;49:1059–1067 [DOI] [PubMed] [Google Scholar]
- 18.Kurata A, Mochizuki T, Koyama Y, et al. Myocardial perfusion imaging using adenosine triphosphate stress multi-slice spiral computed tomography: alternative to stress myocardial perfusion scintigraphy. Circ J 2005;69:550–557 [DOI] [PubMed] [Google Scholar]
- 19.George RT, Arbab-Zadeh A, Miller JM, et al. Adenosine stress 64- and 256-row detector computed tomography angiography and perfusion imaging: a pilot study evaluating the transmural extent of perfusion abnormalities to predict atherosclerosis causing myocardial ischemia. Circ Cardiovasc Imaging 2009;2:174–182 [DOI] [PMC free article] [PubMed] [Google Scholar]
- 20.Blankstein R, Shturman LD, Rogers IS, et al. Adenosine-induced stress myocardial perfusion imaging using dual-source cardiac computed tomography. J Am Coll Cardiol 2009;54:1072–1084 [DOI] [PubMed] [Google Scholar]
- 21.Blankstein R, Okada DR, Rocha-Filho JA, Rybicki FJ, Brady TJ, Cury RC. Cardiac myocardial perfusion imaging using dual source computed tomography. Int J Cardiovasc Imaging (in press).
- 22.Blankstein R, Shah A, Pale R, et al. Radiation dose and image quality of prospective triggering with dual-source cardiac computed tomography. Am J Cardiol 2009;103:1168–1173 [DOI] [PubMed] [Google Scholar]
- 23.Cury RC, Nieman K, Shapiro MD, et al. Comprehensive assessment of myocardial perfusion defects, regional wall motion, and left ventricular function by using 64-section multidetector CT. Radiology 2008;248:466–475 [DOI] [PMC free article] [PubMed] [Google Scholar]
- 24.Blankstein R, Rogers IS, Cury RC. Practical tips and tricks in cardiovascular computed tomography: diagnosis of myocardial infarction. J Cardiovasc Comput Tomogr 2009;3:104–111 [DOI] [PubMed] [Google Scholar]
- 25.Cerqueira MD, Weissman NJ, Dilsizian V, et al. Standardized myocardial segmentation and nomenclature for tomographic imaging of the heart: a statement for healthcare professionals from the Cardiac Imaging Committee of the Council on Clinical Cardiology of the American Heart Association. Circulation 2002;105:539–542 [DOI] [PubMed] [Google Scholar]
- 26.Einstein AJ, Moser KW, Thompson RC, Cerqueira MD, Henzlova MJ. Radiation dose to patients from cardiac diagnostic imaging. Circulation 2007;116:1290–1305 [DOI] [PubMed] [Google Scholar]
- 27.Shaw LJ, Berman DS, Maron DJ, et al. Optimal medical therapy with or without percutaneous coronary intervention to reduce ischemic burden: results from the Clinical Outcomes Utilizing Revascularization and Aggressive Drug Evaluation (COURAGE) Trial nuclear substudy. Circulation 2008;117:1283–1291 [DOI] [PubMed] [Google Scholar]
- 28.Tonino PA, De Bruyne B, Pijls NH, et al. Fractional flow reserve versus angiography for guiding percutaneous coronary intervention. N Engl J Med 2009;360:213–224 [DOI] [PubMed] [Google Scholar]