Abstract
OBJECTIVE
Increased activity of the innate immune system has been implicated in the pathogenesis of the dyslipidemia and insulin resistance associated with obesity and type 2 diabetes. In this study, we addressed the potential role of Kupffer cells (liver-specific macrophages, KCs) in these metabolic abnormalities.
RESEARCH DESIGN AND METHODS
Rats were depleted of KCs by administration of gadolinium chloride, after which all animals were exposed to a 2-week high-fat or high-sucrose diet. Subsequently, the effects of these interventions on the development of hepatic insulin resistance and steatosis were assessed. In further studies, the effects of M1-polarized KCs on hepatocyte lipid metabolism and insulin sensitivity were addressed.
RESULTS
As expected, a high-fat or high-sucrose diet induced steatosis and hepatic insulin resistance. However, these metabolic abnormalities were prevented when liver was depleted of KCs. In vitro, KCs recapitulated the in vivo effects of diet by increasing hepatocyte triglyceride accumulation and fatty acid esterification, and decreasing fatty acid oxidation and insulin responsiveness. To address the mechanisms(s) of KC action, we inhibited a panel of cytokines using neutralizing antibodies. Only neutralizing antibodies against tumor necrosis factor-α (TNFα) attenuated KC-induced alterations in hepatocyte fatty acid oxidation, triglyceride accumulation, and insulin responsiveness. Importantly, KC TNFα levels were increased by diet in vivo and in isolated M1-polarized KCs in vitro.
CONCLUSIONS
These data demonstrate a role for liver macrophages in diet-induced alterations in hepatic lipid metabolism and insulin sensitivity, and suggest a role for these cells in the etiology of the metabolic abnormalities of obesity/type 2 diabetes.
The physiological purpose of inflammation, which is an adaptive response to infection, injury, or exposure to toxic substances, is to reestablish a homeostatic state that entails removal of the source of infection, tissue repair, or resolution of toxin-induced stress. Upon the reestablishment of homeostasis, the necessity for the inflammatory response is removed, allowing immune system function to return to the basal state. However, under pathological conditions, a state of chronic inflammation is established, and the consequences of this inappropriate condition are the development of diseases of autoimmunity, sepsis, fibrosis, and cellular stress. Most recently, it has become apparent that the major metabolic diseases of this generation, namely obesity, type 2 diabetes, nonalcoholic fatty liver disease, nonalcoholic steatohepatitis, and atherosclerosis, are states of chronic inflammation, and a series of studies have demonstrated a role for inflammation in the pathophysiology of the metabolic abnormalities associated with a number of these conditions (1–5).
Macrophages are a heterogeneous population of myeloid-derived mononuclear cells that are a critical component of the innate immune response (6,7). They are resident in practically all tissues of the body, are recruited to tissues in response to infection or tissue damage, and are particularly enriched in tissues that are frequently exposed to exogenous and endogenous antigens and toxins, such as the lungs and liver. In all tissues, they act as the first responders to pathogens, toxins, and tissue damage by producing a panel of M1 (Th-1) proinflammatory cytokines, the prototypical ones being tumor necrosis factor-α (TNFα), γ-interferon (IFN-γ), and interleukin (IL)-1β. In states of overnutrition such as obesity, the number and activity of macrophages in adipose tissue are increased in rodents (8,9) and humans (10,11). Furthermore, interventions that inhibit macrophage recruitment to adipose tissue (12,13) or decrease proinflammatory activity (14–16) of macrophages improve the insulin resistance associated with obesity, whereas interventions that induce macrophage recruitment exacerbate insulin resistance (12,17). However, although these studies demonstrate a pathophysiological role for adipose macrophages in the metabolic abnormalities of overnutrition, the role of macrophages in other tissues and the mechanisms of their effects are largely unknown. In this regard, the potential role of liver macrophages (Kupffer cells [KCs]) in the development of hepatic dyslipidemia (steatosis) and insulin resistance is largely unknown. Furthermore, recent studies (15,16) demonstrate that blocking the anti-inflammatory or alternative (M2 or Th-2) activation program of KCs exacerbates obesity-induced insulin resistance and decreases hepatocyte fatty acid oxidation. However, although suggestive, these studies do not directly address the contribution of KCs to the development of diet-induced steatosis and insulin resistance, or the mechanisms of these effects. The current study addressed these issues. The data demonstrate that the depletion of KCs protects against the development of diet-induced steatosis and insulin resistance, and that M1 activation of KCs induces changes in hepatocyte lipid metabolic pathways and insulin action that are consistent with the effects of diet in vivo. Finally, data are presented suggesting that KC–derived TNFα plays a role in mediating the detrimental effects of KCs on hepatocyte lipid metabolism and insulin action.
RESEARCH DESIGN AND METHODS
Animal care and maintenance.
Male Wister rats were purchased from Charles River (Madison, WI). After arrival, rats were maintained on a constant 12-h light/12-h dark cycle with free access to water and ad libitum fed with a standard chow diet and allowed to acclimate for at least a week. All procedures were approved by the Institutional Animal Care and Use Committee (IACUC) of the University of Pittsburgh, and were in accordance with the National Research Council's Guide for the Care and Use of Laboratory Animals.
In vivo experimental design.
Chronic indwelling catheters were implanted in the left common carotid artery and the right jugular vein (18). Three dietary groups were established 1) standard chow 2) high fat (HF; TD 96001, 45% of calories from fat; Harlan Teklad, Madison WI), and 3) high sucrose (HS; 68% of calories from sucrose and 11% of calories from fat; Research Diet). Each of the three dietary groups was further divided into two subgroups; one subgroup was injected via the carotid artery with gadolinium chloride (GdCl3; Sigma, St. Louis, MO) and the other was injected with saline. GdCl3 is a selective toxicant for KCs and is commonly used to deplete the liver of these cells (19–21). In the current study, depletion of KCs was evaluated by quantification of CD68 (a macrophage marker)-positive cells by immunohistochemistry (19,20) and measurements of CD68 and F4/80 mRNA levels using quantitative (q)RT-PCR (supplemental Table 1, available in an online appendix at http://diabetes.diabetesjournals.org/cgi/content/full/db09-0016/DC1). One week prior to the beginning of diet exposures, all animals received two injections of a sterile filtered GdCl3 (10 mg/kg) or saline solution into the carotid artery cannula (at days −7 and −4). Four further injections were administered during dietary exposures (at days 0, +3, +7, and +10). At day +14 (i.e., after 2 weeks of dietary exposure), animals were fasted overnight. Subsequently, animals were killed and tissues (blood, liver, adipose tissue) were isolated or animals underwent a hyperinsulinemic-euglycemic clamp (see below) and were then killed and tissues isolated. For all experiments, caloric intake, weight gain during diet exposures, and adiposity were assessed.
Isolation and plating of primary hepatocytes and KCs.
The method for simultaneous isolation of hepatocytes and KCs from the same rat was adapted from Smedsrød et al. (22,23). Briefly, livers were perfused through the portal vein in situ with an oxygenenated modified (no Ca2+, and KH4PO4 was substituted with NaH2PO4) Krebs-Henseleit buffer plus 2.5 mmol/l EGTA at 37°C at a rate of 18 ml/min for 10 min (24). Subsequently, 100 ml of Krebs-Henseleit buffer in the presence of Ca2+ (2.5 mmol/l) and containing 0.04% collagenase (type IV; Sigma) was recirculated through the liver for ∼10 min. The resulting cell suspension was filtered through a sterile 150-mesh nylon screen and centrifuged three times at 50g at 4°C for 2 min, and the cell pellet containing hepatocytes was further purified in a 30% Percoll/Dulbecco's modified Eagle's medium (DMEM) solution (GE Healthcare Bioscience AB, Uppsala, Sweden) by centrifugation at 50g for 10 min. The hepatocytes were plated at a density of 1.5 × 10⁶ cells/well in collagen-coated (Sigma) 6-well plates with complete DMEM containing 10% FBS, 25 mmol/l glucose, 10 mmol/l HEPES, 250 units/ml penicillin, and 250 μg/ml streptomycin and incubated for 2 h at 37°C in 5% CO2. Nonattached cells were removed by washing with PBS after 1 h. For isolation of KCs, the combined supernatant from the non-Percoll centrifugations above was centrifuged at 50g for 2 min, and the resulting supernatant (enriched in nonparenchymal cells) was centrifuged at 350g for 5 min. The cell pellet containing nonparenchymal cells was resuspended in 4 ml complete DMEM medium and mixed with 6 ml 30% (wt/vol) histodenz (Sigma) in PBS. The resulting suspension was layered under 10 ml DMEM containing 10% FBS and centrifuged at 1300g for 20 min at 22°C with the brake off. The KC-enriched fraction was obtained and washed with 4°C culture medium. Subsequently, the cell pellet was suspended in DMEM at a density of ∼1.0 × 10⁶ cells per milliliter. Approximately 1.0 × 10⁶ cells were then plated on transwell inserts (0.4-μm pore size membrane; Corning, Lowell, MA) in 2 ml to allow attachment of KCs. After 1 h, the medium containing non-KCs was replaced with fresh medium. Cell viability as assessed by trypan blue exclusion was greater than 95% for KCs and greater than 90% for hepatocytes. In preliminary experiments (supplemental Fig. 4), KC attachment was assessed by CD68 immunofluorescence (AbD Serotec, Killington, Oxford, U.K.).
In vitro experimental design.
Hepatocytes were incubated in the absence or presence of KCs, and/or lipopolysaccharide (LPS; 500 ng/ml), and/or 0.4 mmol/l [3H]-palmitate (5 μCi/ml) for the measurement of fatty acid oxidation and esterification and triglyceride accumulation. All fatty acid incubations were for 24 h, except for the measurement of fatty acid esterification where labeled palmitate was present for only 2 h after the 24-h coculture period. At the end of incubations, media were collected and cells were washed two times in an excess volume of ice-cold PBS, briefly treated with 12.5% trypsin-EDTA, and collected by scraping into 2 ml of PBS, centrifugation, and retention of the pellet for analysis of lipids and proteins. For all conditions, triplicate (3-well) measurements were made in each experiment. For neutralizing antibody experiments, anti-TNFα, anti–IL-12, anti–IL-1β, anti–IL-1α, and IL-6 were present at 1 μg/ml; anti–IL-18, at 10 μg/ml; and anti–IFN-γ and anti–IFN-β, at 5 μg/ml. All antibodies were from R&D Systems (Minneapolis, MN). For analysis of insulin signaling pathways, cells were serum deprived for 2 h after 24-h coculture, and were subsequently stimulated with 100 nm insulin for 10 min. After 2× washes with PBS containing 2 mmol/l protease inhibitors and phosphatase inhibitors, cells were scraped into phosphatidylinositol 3 kinase (PI 3-kinase) assay buffer or cell lysis buffer for subsequent analysis.
Hyperinsulinemic-euglycemic clamps.
Hyperinsulinemic-euglycemic clamps were performed as previously described (18). For the assessment of basal hepatic glucose output (HGO), a 10-μCi [3-3H]-glucose bolus was administered intravenously followed by a 120-min infusion at a rate of 0.1 μCi/min. Arterial blood samples were taken at 60, 90, and 120 min for the determination of plasma glucose–specific activity. To assess insulin suppression of HGO, a constant rate insulin (Humulin; Eli Lilly) infusion (4 mU · kg−1 · min−1) and a variable rate glucose infusion commenced at +120 min, and the [3-3H]-glucose infusion continued at a rate of 0.18 μCi/min for another 90 min. Blood glucose concentration was monitored at 10-min intervals to determine the exogenous glucose infusion rate necessary to maintain euglycemia. Blood samples taken during the final 30 min of the clamp were used to assess plasma radioactivity for the determination of HGO and the glucose disposal rate (GDR) (25,26).
Immunohistochemistry and immunofluorescence.
For immunohistochemistry, tissues (liver and epididymal fat) were fixed overnight in a 4% paraformaldehyde solution, and subsequently embedded in paraffin. Sections were obtained and stained using standard techniques. CD68-positive cells were detected using α-CD68 (AbD Serotec) and were quantified on 8–9 fields of ×40 sections using an Olympus (New York, NY) light microscope. For immunofluorescence, CD68 and TNFα were detected in liver sections after antigen retrieval by heating sections in 1.6 mmol/l EDTA in a high-pressure cooker for 7 min. Subsequently, sections were immunostained with α-CD68 (1:200) and α-TNFα (1:100; MBL, Woburn, MA) followed by incubation with Alexa 488–conjugated or cyanin 3–conjugated secondary antibodies, respectively. Images were visualized using an Olympus Provis fluorescence microscope and modified with Magnafire software (Olympus, Melville, NY).
Tissue, cell, and plasma measurements.
Triglycerides, diacylglycerol (DAG), ceramide, fatty acid oxidation, and fatty acid esterification were determined as described previously (27,28). Cholesterol was assessed using the Infinity Cholesterol kit (Thermo, Rockford, IL). Insulin receptor substrate 1 (IRS-1)–associated PI 3-kinase activity, and IRS-1, insulin receptor β (IRβ), acetyl-CoA carboxylase (ACC), AMP-activated protein kinase (AMPK), and Akt phosphorylation were determined as previously described (24,29). TNFα (by ELISA; R&D Systems), LPS (limulus amebocyte lysate assay; Lonza Bioscience, Walkersville, MD), insulin (by ELISA; ALPCO, Salem, NH), and free fatty acids (Roche, Indianapolis, IN) were measured using commercial kits according to the protocols provided by the manufacturer. Gene expression was measured using quantitative real-time PCR (supplemental Table 1) as previously described (30).
Statistics.
Data are expressed as means ± SE. Statistical significance was determined by t test and, where appropriate, one-way ANOVA (Bonferroni post hoc test) was performed using the Systat statistical program (Evanston, IL). Statistical significance was assumed at P < 0.05.
RESULTS
Depletion of liver KCs protects against liver steatosis and insulin resistance induced by high-fat and high-sucrose diets.
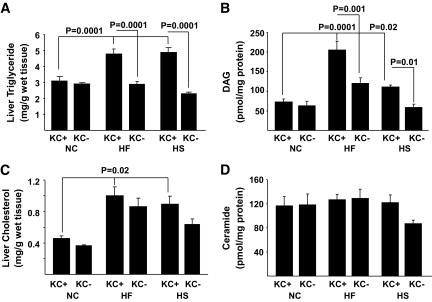
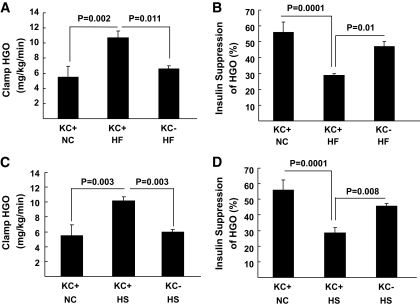
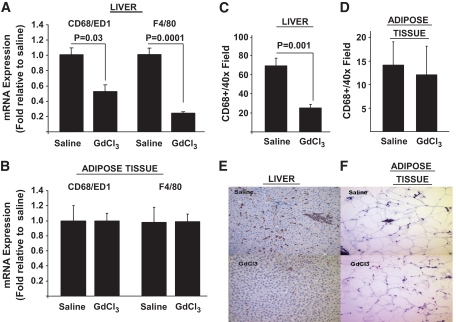
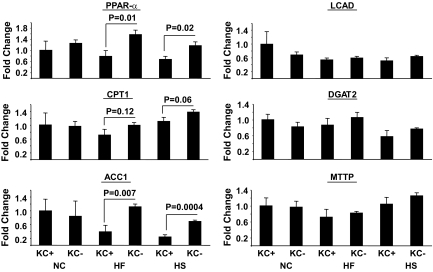
To begin to address the role of KCs in dysregulated hepatic metabolism, we first determined the metabolic effects of 2 weeks of HF or HS feeding in rats in the absence and presence of KCs. Two weeks of HF or HS feeding induced hepatic steatosis (Fig. 1A), increased liver cholesterol and DAG, but not ceramide levels (Fig. 1B–D), and induced systemic hypertriglyceridemia (Table 1) without increasing adiposity or body weight gain (Table 1), compared with standard chow (SC)–fed controls. There was a trend toward an increase in systemic TNFα levels on the HF diet, but this increase did not attain statistical significance (Table 1). Finally, although fasting plasma insulin and glucose concentrations were similar in all diet groups, HF and HS induced hepatic insulin resistance as measured by the glucose clamp (Fig. 2). Thus, HGO during the glucose clamp was elevated ∼40% in HS- and HF-fed animals compared with controls (Fig. 2A and C). This corresponded to a decrease in the capacity of insulin to suppress HGO of ∼29 in HF- and ∼28% in HS-fed animals compared with ∼58% in controls (Fig. 2B and D). Basal HGO and clamp GDR were similar in SC-, HF-, and HS-fed animals (supplemental Fig. 1). Depletion of KCs by GdCl3 decreased liver mRNA levels of the KC-specific markers CD68/ED1 and F4/80 by ∼50 and ∼80%, respectively (Fig. 3A). Histochemical analysis of liver confirmed an ∼70% decrease in CD68/ED1-positive cells (Fig. 3C and E). Interestingly, adipose tissues levels of the same markers were unaltered by GdCl3 (Fig. 3B, D, and F). Furthermore, the effects of GdCl3 were independent of diet, whereas a HF or HS diet had no effects on liver KCs or adipose tissue macrophage (ATM) numbers in control (saline-treated) animals (supplemental Fig. 2). Although the depletion of KCs had no effects on liver triglyceride levels in SC-fed animals, the development of hepatic steatosis was prevented in HF- and HS-fed animals (Fig. 1A). Notably, KC depletion also attenuated the increases in DAG (Fig. 1B), but did not prevent the increase in liver cholesterol (Fig. 1C and D). However, plasma hypertriglyceridemia was not resolved by KC depletion (Table 1), and indeed, there was a trend toward increased triglycerides (TGs) in KC-depleted HS- and HF-fed, but not SC-fed, animals. Liver peroxisome proliferator–activated receptor-α (PPARα) and ACC1 gene expression were increased in KC-depleted HF and HS, and CPT1 expression trended upward, with no changes in MTTP, LCAD, or DGAT2 expression (Fig. 4). Similar to hepatic dyslipidemia, hepatic insulin resistance induced by HF and HS diets was prevented in KC-depleted animals (Fig. 2), and there were no effects on fasting glucose or insulin concentrations (Table 1), or basal HGO and clamp GDR (supplemental Fig. 1).
FIG. 1.
The effects of KC depletion on liver triglycerides, DAG, ceramide, and cholesterol in response to a high-fat or high-sucrose diet. Male Wistar rats depleted of KCs or control rats were exposed to a high-fat or high-sucrose diet for 2 weeks as described in research design and methods. Subsequently, animals were killed after an overnight fast, livers were isolated, and triglyceride (A), DAG (B), cholesterol (C), and ceramide (D) content of the liver was determined. Data are presented as means ± SE. Statistical significance is indicated. n = a minimum of six in each group.
TABLE 1.
Body weight, epididymal fat, and plasma measurements in the saline- or GdCl3-treated rats exposed to NC, HF, or HS diets for 2 weeks
| NC saline | NC GdCl3 | HF saline | HF GdCl3 | HS saline | HS GdCl3 | |
|---|---|---|---|---|---|---|
| Body wt (g), day 0 | 279 ± 3 | 278 ± 8 | 289 ± 3 | 288 ± 7 | 254 ± 14 | 270 ± 9 |
| Body wt (g), day 21 | 375 ± 12 | 351 ± 9 | 371 ± 3 | 382 ± 7 | 352 ± 14 | 346 ± 9 |
| Food intake (Kcal/day) | 100 ± 2 | 96 ± 3 | 110 ± 3 | 104 ± 3 | 95 ± 3 | 89 ± 5 |
| Epididymal fat (g) | 6.2 ± 0.3 | 5.4 ± 0.3 | 6.6 ± 0.2 | 6.3 ± 0.8 | 5.2 ± 0.5 | 5.3 ± 0.5 |
| Glucose (mg/dl) | ||||||
| Before clamp | 88 ± 5 | NA | 96 ± 7 | 89 ± 5 | 92 ± 5 | 88 ± 7 |
| After clamp | 87 ± 7 | NA | 101 ± 5 | 97 ± 3 | 98 ± 8 | 93 ± 4 |
| Insulin (ng/ml) | ||||||
| Before clamp | 0.5 ± 0.2 | 0.6 ± 0.1 | 0.8 ± 0.5 | 0.8 ± 0.3 | 0.5 ± 0.2 | 0.6 ± 0.1 |
| After clamp | 4.5 ± 1 | NA | 5.5 ± 0.9 | 4.0 ± 1.2 | 5.1 ± 0.8 | 4.5 ± 1.3 |
| Plasma TGs (mg/dl) | 51.2 ± 0.8 | 46.7 ± 6.2 | 63.4 ± 5.7* | 76.2 ± 8.6* | 91.6 ± 8.0* | 109.9 ± 9.0* |
| Plasma FFAs (mM) | 0.6 ± 0.1 | 0.4 ± 0.1 | 0.7 ± 0.1 | 0.5 ± 0.1 | 0.7 ± 0.1 | 0.5 ± 0.1 |
| Plasma TNFα (pg/ml) | 36.1 ± 3.4 | 34.2 ± 0.8 | 42.8 ± 10.4 | 54.6 ± 17.9 | 34.0 ± 0.4 | 39.8 ± 2.2 |
| Plasma LPS (EU/ml) | 8.3 ± 0.3 | 7.4 ± 0.3 | 8.5 ± 1.1 | 9.1 ± 1.5 | 15.0 ± 1.7 | 16.2 ± 4.0 |
Data are means ± SE; n = minimum 5/group except post-clamp SC insulin where n = 3. Values for TGs, FFAs, TNFα, and LPS are from overnight-fasted, preclamp blood samples.
*Significantly different from NC saline. FFA, free fatty acids; NA, not applicable.
FIG. 2.
The effects of KC depletion on the development of liver insulin resistance on a high-fat or high-sucrose diet. Male Wistar rats depleted of KCs or control rats were exposed to a high-fat (A and B) or high-sucrose (C and D) diet for 2 weeks. Subsequently, animals were fasted overnight and then underwent 4 mU · kg−1 · min−1 euglycemic-hyperinsulinemic clamp in the presence of [3-H3]-glucose for the measurement of hepatic insulin sensitivity as described in research design and methods. Hepatic glucose output (A and C) and insulin suppression of hepatic glucose output (B and D) were assessed. Data are presented as means ± SE. Statistical significance is indicated. n = a minimum of four in each group.
FIG. 3.
KC depletion by GdCl3 in liver and adipose tissue. Male Wistar rats were depleted of KCs by administration of GdCl3 as described in research design and methods. Subsequently, liver and adipose tissue were isolated and the presence of macrophages was determined by qRT-PCR assessment of CD68/ED1 and F4/80 mRNA levels (A and B) and counting of CD68/ED1-positive cells after immunohistochemical staining of liver and adipose tissue sections (C–F) as described in research design and methods. Statistical significance is indicated. n = a minimum of six in each group for qRT-PCR and n = 3 for immunohistochemical analysis of CD68/ED1-positive cells. (A high-quality digital representation of this figure is available in the online issue.)
FIG. 4.
Expression of lipid metabolism genes in the liver of SC-, HF-, and HS-fed rats with or without GdCl3 administration. Male Wistar rats were depleted of KCs by administration of GdCl3 as described in research design and methods. Subsequently, liver was isolated, RNA was extracted, and the expression of a number of lipid metabolism genes was determined by qRT-PCR. Statistical significance is indicated. n = a minimum of four in each group.
M1-polarized KCs alter hepatocyte lipid metabolism and insulin responsiveness in vitro.
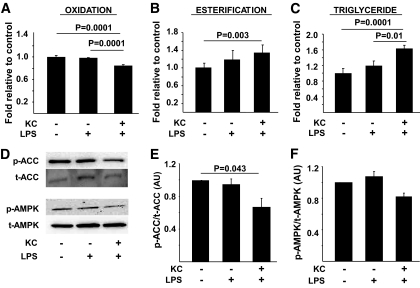
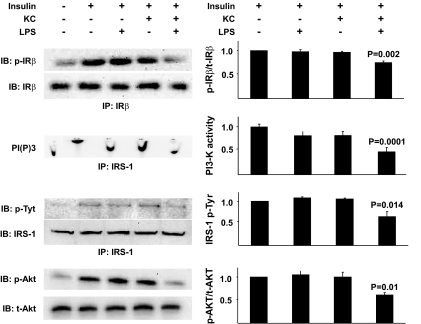
The demonstration that a liver depleted of KCs is protected against diet-induced steatosis and insulin resistance implicates a mechanistic role for these cells in the determination of hepatic insulin sensitivity and the regulation of lipid metabolism. However, this in vivo study does not directly assess the effects of KCs on hepatocyte metabolism and insulin action. Studies provide supportive evidence in this regard, demonstrating that LPS injection rapidly induces steatosis (31), whereas mice with macrophages lacking the ability to M2 polarize have decreased hepatocyte oxidative metabolism and steatosis (15,16). Again, however, these data implicate, rather then demonstrate, a role for KCs in hepatocyte metabolic abnormalities. To more directly address this issue, a coculture system composed of KCs and hepatocytes isolated from the same rat liver was used. Isolated KCs (supplemental Fig. 4) were incubated in the presence of LPS and free fatty acids to induce M1 polarization and, subsequently, readouts of lipid metabolism and insulin action in hepatocytes were assessed. Importantly, LPS alone had no effect on hepatocyte triglyceride, fatty acid esterification, or fatty acid oxidation (Fig. 5A–C). However, when KCs were present, hepatocyte triglycerides and fatty acid esterification were increased, and fatty acid oxidation was decreased. Furthermore, phospho-ACC was decreased, with a trend toward decreased phospho-AMPK (Fig. 5D–F). Lipogenesis (as measured by C14-acetate incorporation into total lipids), was not increased by KCs (supplemental Fig. 3C). A similar pattern was observed for insulin responsiveness. Thus, M1 activation of KCs resulted in a marked decrease in insulin's capacity to stimulate phosphorylation of the insulin receptor and IRS-1, PI 3-kinase activity, and Akt phosphorylation (Fig. 6). Notably, saturated fatty acids alone in the presence of KCs induced decreases in hepatocyte fatty acid oxidation, and increases in fatty acid esterification, but did not alter triglyceride levels (supplemental Fig. 6).
FIG. 5.
The effects of M1-polarized KCs on hepatocyte fatty acid oxidation and esterification and triglyceride accumulation. Hepatocytes and KCs were isolated from rat livers, plated, and cultured as described in research design and methods. Subsequently, the effects of the indicated exposures on fatty acid oxidation, fatty acid esterification, and triglyceride levels (A–C) and ACC and AMPK phosphorylation (D–F) were assessed as described in research design and methods. Data are presented as means ± SE. Statistical significance is indicated. n = a minimum of six in triplicate for each metabolic measurement. n = a minimum of four for ACC and AMPK analysis.
FIG. 6.
The effects of M1-polarized KCs on hepatocyte insulin responsiveness. Hepatocytes and KCs were isolated from rat livers, plated, and cultured as described in research design and methods. After the indicated exposures, hepatocytes were incubated with 100 nmol/l insulin for 10 min, and protein extracts were prepared and insulin receptor (IR) phosphorylation, IRS-1 phosphorylation, IRS-1–associated PI 3-kinase activity, and Akt phosphorylation were assessed as described in research design and methods. Data are presented as means ± SE. Statistical significance is indicated. n = a minimum of four for each experimental condition.
Inhibition of TNFα attenuates the detrimental effects of KCs on hepatocyte lipid metabolism and insulin sensitivity.
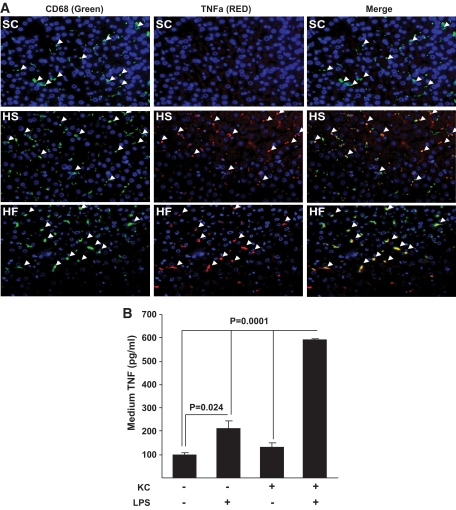
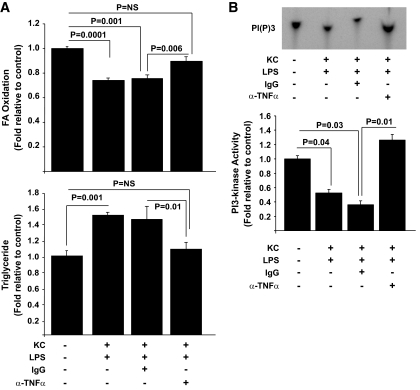
The data presented above demonstrate metabolic cross talk between KCs and hepatocytes, which results in altered lipid metabolism and insulin sensitivity, but do not address the biochemical mechanisms of these effects. An obvious candidate mechanism is TNFα, because it has a well-described role in the pathogenesis of insulin resistance, has been implicated in the development of dyslipidemia and steatosis, and is a prototypical M1 cytokine produced by macrophages when they are activated (32–39). To address this possibility, we first evaluated the effects of overnutrition on TNFα production by KCs in our model systems. Importantly, in both HS- and HF-fed animals KCs had increased TNFα, and this increase was not present in KCs of SC-fed animals as assessed by immunofluorescence (Fig. 7A). We next directly evaluated the potential role of this cytokine in the adverse effects of KCs on hepatocyte lipid metabolism and insulin responsiveness, using fatty acid oxidation, triglyceride accumulation, and PI 3-kinase activity as readouts, respectively. In response to LPS exposure, KCs increased production of TNFα, an effect that was substantially greater than that observed when hepatocytes were exposed to LPS alone (Fig. 7B). Importantly, blocking of TNFα activity using a TNFα-neutralizing antibody resulted in an improvement of the adverse effects of KCs on hepatocyte fatty acid oxidation and accumulation of TGs (Fig. 8A) and insulin-stimulated PI 3-kinase activity (Fig. 8B). Notably, neutralizing antibodies against a panel of other M1-associated cytokines (IL-1α, IL-1β, IL-6, IFN-β, IFN-γ, IL-12, IL-18) were unable to prevent the effects of M1-polarized KCs on hepatocyte lipid metabolism (supplemental Fig. 7).
FIG. 7.
TNFα expression in KCs in liver in response to standard chow, high-fat, and high-sucrose diets and TNFα secretion from isolated M1-polarized KCs. Male Wistar rats were exposed to a high-fat or high-sucrose diet for 2 weeks. Subsequently, the livers were isolated, sections were prepared, and immunofluorescent staining for KCs and TNFα was performed (A), as described in research design and methods. The left panel shows CD68/ED1-positive cells (green), the center panels show TNFα-positive cells (red), and the right panels show the merged images. In all panels, Hoechst staining was used to visualize cell nuclei (blue). n = a minimum of three. For in vitro experiments (B), hepatocytes and KCs were isolated from rat livers, plated, and cultured as shown. After the indicated exposures, media were taken and TNFα was quantified by enzyme-linked immunosorbent assay (ELISA). Data are presented as means ± SE. Statistical significance is indicated. n = a minimum of three in each group. (A high-quality digital representation of this figure is available in the online issue.)
FIG. 8.
The effects of TNFα depletion on hepatocyte lipid metabolism and insulin-stimulated PI 3-kinase activity. Hepatocytes and KCs were isolated from rat livers, plated, and cultured as described in research design and methods. Subsequently, the effects of the indicated exposures on fatty acid oxidation and triglycerides in the absence or presence of a TNFα-neutralizing antibody were assessed as described in research design and methods (A). In separate experiments, hepatocytes were incubated with 100 nmol/l insulin for 10 min after similar exposures to those in (A), proteins extracts were then prepared, and IRS-1–associated PI 3-kinase activity was assessed as described in research design and methods (B). Data are presented as means ± SE. Statistical significance is indicated. n = a minimum of six for each experimental condition, except for triglycerides (n = 3).
DISCUSSION
The purpose of the current study was to address the potential role of KCs in the pathogenesis of two of the liver metabolic abnormalities associated with states of overnutrition, specifically hepatic steatosis and insulin resistance. A number of novel observations are presented. The data demonstrate that 1) KCs are M1 activated in states of overnutrition; 2) depletion of KCs protects against the development of diet-induced steatosis, increased DAG, and insulin resistance; 3) M1 activation of KCs in vitro induces changes in hepatocyte lipid metabolic pathways and insulin sensitivity that are consistent with the effects of diet in vivo, and 4) TNFα plays a role in mediating the detrimental effects of KCs on hepatocyte lipid metabolism and insulin responsiveness.
The number and activity of adipose tissue macrophages are increased in obesity in mice and humans (8–11). However, to date it has been unclear whether there is a similar effect of obesity on the activity and/or number of macrophages in other metabolic tissues of relevance to obesity and type 2 diabetes. In the case of liver, resident KCs comprise ∼5% of the total cell mass and their anatomical position in the sinusoidal spaces of the liver permits them to act as immune sentinels for the portal (gut) and systemic circulations. As such, they are most likely to see potential mediators of macrophage activation in obesity. Furthermore, their proximity to parenchymal cells presents opportunities both to influence glucose and lipid metabolism and potentially to respond to parenchymal cell–derived signals. Data presented in the current study clearly demonstrate activation of KCs (as measured by increased TNFα expression) in response to overnutrition, whether a high-fat diet or a high-sucrose diet. One issue that arises from these observations is the nature of the dietary signal responsible for the activation of the KCs. Based on known activators of the M1 response in macrophages and a number of other recent studies, an increase in LPS derived from gut bacteria may mediate the effects of overnutrition (40–46). Indeed, raising LPS to levels found in obese mice induces hepatic steatosis and insulin resistance (40), whereas the treatment of obese mice with antibiotics reduces LPS levels and improves steatosis and insulin resistance (41). Furthermore, it is now well established that obesity alters the composition of the gut bacterial population (43–46), that there is increased permeability of the gut to LPS in obesity (41), and that populating the gut of a lean mouse with bacteria derived from an obese mouse results in increased body fat (45). However, a note of caution should be introduced regarding this discussion. Although increases in systemic LPS have previously been reported in obese mice (40,41), significant increases in plasma LPS were not observed in the current study, although a distinct trend was clear in sucrose-fed animals (Table 1). It is possible that factors such as the diet length/sampling time point (after 2 weeks of diet), the sampling site (systemic arterial), the nutritional status of the animals (fasted), or diurnal alterations may have masked changes. However, an alternative explanation is that the activation of KCs is mediated by other signals. In this regard, saturated fatty acids have been implicated in the activation of macrophages. Specifically, saturated fatty acids activate Toll-like receptor 4 (TLR-4), the LPS receptor, in macrophages (47), obese TLR-4–null mice have improved insulin sensitivity and lipid profiles (48), TLR-4–null mice are protected against lipid-induced insulin resistance (30), and diabetes-induced obesity is a state of dyslipidemia. Notably, we demonstrate (supplemental Fig. 7) that saturated free fatty acids can recapitulate the effect of KC-mediated alterations in hepatocyte fatty acid oxidation and esterification, but not triglyceride accumulation. Therefore, it is possible that a combination of bacterial-derived LPS and elevated free fatty acids may together be important mechanisms of activation of KCs in states of overnutrition.
The current study builds on recent reports that have indirectly implicated a role for KCs in altering hepatic metabolism (15,16). Thus, myeloid deletion of PPARδ, which plays an important role in mediating the alternative activation (the Th-2 or M2 anti-inflammatory response) of macrophages, increases susceptibility to insulin resistance, liver steatosis, and reduced hepatocyte oxidative metabolism in obesity. An implied, although indirect, implication of these data is that conditions that favor a proinflammatory M1/Th-1 polarization (the “classic” activation) of KCs, such as states of overnutrition, play a role in the development of liver metabolic abnormalities. This hypothesis is addressed directly in the present study. Thus, overnutrition results in increased TNFα production by KCs, and the rapid development of steatosis and insulin resistance. When KCs are depleted, the effects of diet on liver steatosis and insulin resistance are prevented. Furthermore, the M1 polarization of KCs in vitro induces changes in hepatocyte lipid metabolic pathways (fatty acid oxidation, esterification, and triglyceride accumulation) that would be expected to promote the development of steatosis. Taken together with the studies discussed above (15,16) and other studies that have demonstrated hepatic metabolic alterations in response to the altered myeloid activity (12,14), these data suggest that cross talk between KCs and parenchymal cells plays an important role in the regulation of hepatic metabolism.
The current study implies a role for TNFα in the pathogenesis of hepatic insulin resistance and dysregulated lipid metabolism induced by overnutrition. The source of TNFα is most likely the KCs because high-fat and high-sucrose diets did not increase systemic TNFα levels but did increase KC TNFα levels in vivo, LPS profoundly increased TNFα production from KCs in vitro but far less so in hepatocytes, and blocking of TNFα activity attenuated the effects of KCs on hepatocyte fatty acid oxidation, TG accumulation, and insulin activation of PI 3-kinase. TNFα is the prototypical M1 cytokine and is rapidly produced by macrophages in response to proinflammatory signals. Importantly, in the context of the current study, numerous studies have implicated TNFα in the pathogenesis of insulin resistance and dyslipidemia. Thus, obese TNFα-null and TNF receptor–null mice have improved insulin sensitivity compared with obese controls (37), and the induction of insulin resistance by TNFα is well established (35,36,39). In the context of lipid metabolism, the inhibition of TNFα activity with infliximab decreases liver steatosis and improves insulin signaling in liver of high-fat–fed rats (32), TNFα+/+ bone marrow introduction into TNFα−/− mice induces hepatic steatosis on a high-fat diet (33), and TNFα injection induces hepatic steatosis in mice (34). Finally, LPS injections in mice produce hepatic steatosis within hours, possibly by decreasing fatty acid oxidation (31), and it is possible that the in vivo effects of LPS are mediated by KC-derived TNFα, although the contribution of other factors cannot, and should not, be ruled out.
An implication of our work and that of others (15,16) is that interventions that decrease M1 activity of KCs in the liver may have beneficial metabolic effects on insulin action, dyslipidemia, and elevated hepatic glucose output in situations of overnutrition. However, the removal of KCs has substantial effects on the innate immune response in liver (49,50). Thus, a more likely approach may be to target the activity of the specific pathways that are activated in KCs in response to overnutrition, while maintaining the other vital immune functions of KCs. Furthermore, the long-term deletion of KCs from liver may lead to “off-target” effects, which could present as effects on liver function, or effects on peripheral tissue metabolism. Again, however, it should be emphasized that complete removal of KCs from liver is most likely not a viable therapeutic intervention for the treatment or prevention of the metabolic abnormalities of obesity/type 2 diabetes.
In conclusion, we have demonstrated a critical role for KCs in the pathogenesis of liver steatosis and insulin resistance in states of overnutrition and identified TNFα as one potential mediator of these effects. The most important implications of these observations, taken with other studies in this area, is that the activity of components of the immune system such as macrophages, and potentially other immune cells type, is altered by dietary composition and/or excess nutrients and, furthermore, that cross-talk between immune cells and cells/tissues that are intimately involved in the regulation of systemic metabolism, such as adipose tissue and liver, have profound effects on systemic metabolic homeostasis.
Supplementary Material
ACKNOWLEDGMENTS
This work was supported by National Institutes of Health (NIH) Grant RO1-DK-058855 and NIH Grant RO1-DK-072162 (both to R.M.O.) an American Diabetes Association Research Award (1–05-RA-89, to R.M.O.), and NIH Grant RO1-DK-065149 (to D.K.S.).
No potential conflicts of interest relevant to this article were reported.
We thank the laboratories of Drs. Timothy Billiar, Chandrashekhar Gandhi, and Angus Thomson, and Dr. Tina Sumpter at the University of Pittsburgh for their invaluable advice on the isolation and culturing of KCs. The University of Pittsburgh Department of Medicine Histopathology/Immunohistochemistry Core Laboratory and the Center for Biologic Imaging assisted in immunohistochemical analysis.
Footnotes
The costs of publication of this article were defrayed in part by the payment of page charges. This article must therefore be hereby marked “advertisement” in accordance with 18 U.S.C. Section 1734 solely to indicate this fact.
REFERENCES
- 1.Hotamisligil GS, Erbay E: Nutrient sensing and inflammation in metabolic diseases. Nat Rev Immunol 2008;8:923–934 [DOI] [PMC free article] [PubMed] [Google Scholar]
- 2.Schenk S, Saberi M, Olefsky JM: Insulin sensitivity: modulation by nutrients and inflammation. J Clin Invest 2008;118:2992–3002 [DOI] [PMC free article] [PubMed] [Google Scholar]
- 3.Shoelson SE: Banking on ATM as a new target in metabolic syndrome. Cell Metab 2006;4:337–338 [DOI] [PubMed] [Google Scholar]
- 4.Shoelson SE, Lee J, Goldfine AB: Inflammation and insulin resistance. J Clin Invest 2006;116:1793–1801 [DOI] [PMC free article] [PubMed] [Google Scholar]
- 5.Medzhitov R: Origin and physiological roles of inflammation. Nature 2008;454:428–435 [DOI] [PubMed] [Google Scholar]
- 6.Gordon S, Taylor PR: Monocyte and macrophage heterogeneity. Nat Rev Immunol 2005;5:953–964 [DOI] [PubMed] [Google Scholar]
- 7.Taylor PR, Martinez-Pomares L, Stacey M, Lin HH, Brown GD, Gordon S: Macrophage receptors and immune recognition. Annu Rev Immunol 2005;23:901–944 [DOI] [PubMed] [Google Scholar]
- 8.Weisberg SP, McCann D, Desai M, Rosenbaum M, Leibel RL, Ferrante AW, Jr: Obesity is associated with macrophage accumulation in adipose tissue. J Clin Invest 2003;112:1796–1808 [DOI] [PMC free article] [PubMed] [Google Scholar]
- 9.Xu H, Barnes GT, Yang Q, Tan G, Yang D, Chou CJ, Sole J, Nichols A, Ross JS, Tartaglia LA, Chen H: Chronic inflammation in fat plays a crucial role in the development of obesity-related insulin resistance. J Clin Invest 2003;112:1821–1830 [DOI] [PMC free article] [PubMed] [Google Scholar]
- 10.Cancello R, Tordjman J, Poitou C, Guilhem G, Bouillot JL, Hugol D, Coussieu C, Basdevant A, Bar Hen A, Bedossa P, Guerre-Millo M, Clément K: Increased infiltration of macrophages in omental adipose tissue is associated with marked hepatic lesions in morbid human obesity. Diabetes 2006;55:1554–1561 [DOI] [PubMed] [Google Scholar]
- 11.Cancello R, Henegar C, Viguerie N, Taleb S, Poitou C, Rouault C, Coupaye M, Pelloux V, Hugol D, Bouillot JL, Bouloumié A, Barbatelli G, Cinti S, Svensson PA, Barsh GS, Zucker JD, Basdevant A, Langin D, Clément K: Reduction of macrophage infiltration and chemoattractant gene expression changes in white adipose tissue of morbidly obese subjects after surgery-induced weight loss. Diabetes 2005;54:2277–2286 [DOI] [PubMed] [Google Scholar]
- 12.Kanda H, Tateya S, Tamori Y, Kotani K, Hiasa K, Kitazawa R, Kitazawa S, Miyachi H, Maeda S, Egashira K, Kasuga M: MCP-1 contributes to macrophage infiltration into adipose tissue, insulin resistance, and hepatic steatosis in obesity. J Clin Invest 2006;116:1494–1505 [DOI] [PMC free article] [PubMed] [Google Scholar]
- 13.Weisberg SP, Hunter D, Huber R, Lemieux J, Slaymaker S, Vaddi K, Charo I, Leibel RL, Ferrante AW, Jr: CCR2 modulates inflammatory and metabolic effects of high-fat feeding. J Clin Invest 2006;116:115–124 [DOI] [PMC free article] [PubMed] [Google Scholar]
- 14.Arkan MC, Hevener AL, Greten FR, Maeda S, Li ZW, Long JM, Wynshaw-Boris A, Poli G, Olefsky J, Karin M: IKK-beta links inflammation to obesity-induced insulin resistance. Nat Med 2005;11:191–198 [DOI] [PubMed] [Google Scholar]
- 15.Kang K, Reilly SM, Karabacak V, Gangl MR, Fitzgerald K, Hatano B, Lee CH: Adipocyte-derived Th2 cytokines and myeloid PPARdelta regulate macrophage polarization and insulin sensitivity. Cell Metab 2008;7:485–495 [DOI] [PMC free article] [PubMed] [Google Scholar]
- 16.Odegaard JI, Ricardo-Gonzalez RR, Red Eagle A, Vats D, Morel CR, Goforth MH, Subramanian V, Mukundan L, Ferrante AW, Chawla A: Alternative M2 activation of Kupffer cells by PPARdelta ameliorates obesity-induced insulin resistance. Cell Metab 2008;7:496–507 [DOI] [PMC free article] [PubMed] [Google Scholar]
- 17.Kamei N, Tobe K, Suzuki R, Ohsugi M, Watanabe T, Kubota N, Ohtsuka-Kowatari N, Kumagai K, Sakamoto K, Kobayashi M, Yamauchi T, Ueki K, Oishi Y, Nishimura S, Manabe I, Hashimoto H, Ohnishi Y, Ogata H, Tokuyama K, Tsunoda M, Ide T, Murakami K, Nagai R, Kadowaki T: Overexpression of monocyte chemoattractant protein-1 in adipose tissues causes macrophage recruitment and insulin resistance. J Biol Chem 2006;281:26602–26614 [DOI] [PubMed] [Google Scholar]
- 18.Commerford SR, Peng L, Dubé JJ, O'Doherty RM: In vivo regulation of SREBP-1c in skeletal muscle: effects of nutritional status, glucose, insulin, and leptin. Am J Physiol Regul Integr Comp Physiol 2004;287:R218–R227 [DOI] [PubMed] [Google Scholar]
- 19.Rivera CA, Bradford BU, Hunt KJ, Adachi Y, Schrum LW, Koop DR, Burchardt ER, Rippe RA, Thurman RG: Attenuation of CCl(4)-induced hepatic fibrosis by GdCl(3) treatment or dietary glycine. Am J Physiol Gastrointest Liver Physiol 2001;281:G200–G207 [DOI] [PubMed] [Google Scholar]
- 20.Hardonk MJ, Dijkhuis FW, Hulstaert CE, Koudstaal J: Heterogeneity of rat liver and spleen macrophages in gadolinium chloride-induced elimination and repopulation. J Leukoc Biol 1992;52:296–302 [DOI] [PubMed] [Google Scholar]
- 21.Hoyle GW, Hill RL: Molecular cloning and sequencing of a cDNA for a carbohydrate binding receptor unique to rat Kupffer cells. J Biol Chem 1988;263:7487–7492 [PubMed] [Google Scholar]
- 22.Smedsrød B, Pertoft H: Preparation of pure hepatocytes and reticuloendothelial cells in high yield from a single rat liver by means of Percoll centrifugation and selective adherence. J Leukoc Biol 1985;38:213–230 [DOI] [PubMed] [Google Scholar]
- 23.Smedsrød B, Pertoft H, Eggertsen G, Sundström C: Functional and morphological characterization of cultures of Kupffer cells and liver endothelial cells prepared by means of density separation in Percoll, and selective substrate adherence. Cell Tissue Res 1985;241:639–649 [DOI] [PubMed] [Google Scholar]
- 24.Huang W, Dedousis N, Bhatt BA, O'Doherty RM: Impaired activation of phosphatidylinositol 3-kinase by leptin is a novel mechanism of hepatic leptin resistance in diet-induced obesity. J Biol Chem 2004;279:21695–21700 [DOI] [PubMed] [Google Scholar]
- 25.Commerford SR, Bizeau ME, McRae H, Jampolis A, Thresher JS, Pagliassotti MJ: Hyperglycemia compensates for diet-induced insulin resistance in liver and skeletal muscle of rats. Am J Physiol Regul Integr Comp Physiol 2001;281:R1380–R1389 [DOI] [PubMed] [Google Scholar]
- 26.Liu L, Karkanias GB, Morales JC, Hawkins M, Barzilai N, Wang J, Rossetti L: Intracerebroventricular leptin regulates hepatic but not peripheral glucose fluxes. J Biol Chem 1998;273:31160–31167 [DOI] [PubMed] [Google Scholar]
- 27.Stefanovic-Racic M, Perdomo G, Mantell BS, Sipula IJ, Brown NF, O'Doherty RM: A moderate increase in carnitine palmitoyltransferase 1a activity is sufficient to substantially reduce hepatic triglyceride levels. Am J Physiol Endocrinol Metab 2008;294:E969–E977 [DOI] [PubMed] [Google Scholar]
- 28.Dube JJ, Bhatt BA, Dedousis N, Bonen A, O'Doherty RM: Leptin, skeletal muscle lipids, and lipid-induced insulin resistance. Am J Physiol Regul Integr Comp Physiol 2007;293:R642–R650 [DOI] [PubMed] [Google Scholar]
- 29.Huang W, Dedousis N, Bandi A, Lopaschuk GD, O'Doherty RM: Liver triglyceride secretion and lipid oxidative metabolism are rapidly altered by leptin in vivo. Endocrinology 2006;147:1480–1487 [DOI] [PubMed] [Google Scholar]
- 30.Radin MS, Sinha S, Bhatt BA, Dedousis N, O'Doherty RM: Inhibition or deletion of the lipopolysaccharide receptor Toll-like receptor-4 confers partial protection against lipid-induced insulin resistance in rodent skeletal muscle. Diabetologia 2008;51:336–346 [DOI] [PubMed] [Google Scholar]
- 31.Ohhira M, Motomura W, Fukuda M, Yoshizaki T, Takahashi N, Tanno S, Wakamiya N, Kohgo Y, Kumei S, Okumura T: Lipopolysaccharide induces adipose differentiation-related protein expression and lipid accumulation in the liver through inhibition of fatty acid oxidation in mice. J Gastroenterol 2007;42:969–978 [DOI] [PubMed] [Google Scholar]
- 32.Barbuio R, Milanski M, Bertolo MB, Saad MJ, Velloso LA: Infliximab reverses steatosis and improves insulin signal transduction in liver of rats fed a high-fat diet. J Endocrinol 2007;194:539–550 [DOI] [PubMed] [Google Scholar]
- 33.De Taeye BM, Novitskaya T, McGuinness OP, Gleaves L, Medda M, Covington JW, Vaughan DE: Macrophage TNF-alpha contributes to insulin resistance and hepatic steatosis in diet-induced obesity. Am J Physiol Endocrinol Metab 2007;293:E713–E725 [DOI] [PubMed] [Google Scholar]
- 34.Endo M, Masaki T, Seike M, Yoshimatsu H: TNF-alpha induces hepatic steatosis in mice by enhancing gene expression of sterol regulatory element binding protein-1c (SREBP-1c). Exp Biol Med (Maywood) 2007;232:614–621 [PubMed] [Google Scholar]
- 35.Moller DE: Potential role of TNF-alpha in the pathogenesis of insulin resistance and type 2 diabetes. Trends Endocrinol Metab 2000;11:212–217 [DOI] [PubMed] [Google Scholar]
- 36.Ruan H, Lodish HF: Insulin resistance in adipose tissue: direct and indirect effects of tumor necrosis factor-alpha. Cytokine Growth Factor Rev 2003;14:447–455 [DOI] [PubMed] [Google Scholar]
- 37.Uysal KT, Wiesbrock SM, Marino MW, Hotamisligil GS: Protection from obesity-induced insulin resistance in mice lacking TNF-alpha function. Nature 1997;389:610–614 [DOI] [PubMed] [Google Scholar]
- 38.Hotamisligil GS, Shargill NS, Spiegelman BM: Adipose expression of tumor necrosis factor-alpha: direct role in obesity-linked insulin resistance. Science 1993;259:87–91 [DOI] [PubMed] [Google Scholar]
- 39.Hotamisligil GS: Mechanisms of TNF-alpha-induced insulin resistance. Exp Clin Endocrinol Diabetes 1999;107:119–125 [DOI] [PubMed] [Google Scholar]
- 40.Cani PD, Amar J, Iglesias MA, Poggi M, Knauf C, Bastelica D, Neyrinck AM, Fava F, Tuohy KM, Chabo C, Waget A, Delmée E, Cousin B, Sulpice T, Chamontin B, Ferrières J, Tanti JF, Gibson GR, Casteilla L, Delzenne NM, Alessi MC, Burcelin R: Metabolic endotoxemia initiates obesity and insulin resistance. Diabetes 2007;56:1761–1772 [DOI] [PubMed] [Google Scholar]
- 41.Cani PD, Bibiloni R, Knauf C, Waget A, Neyrinck AM, Delzenne NM, Burcelin R: Changes in gut microbiota control metabolic endotoxemia-induced inflammation in high-fat diet-induced obesity and diabetes in mice. Diabetes 2008;57:1470–1481 [DOI] [PubMed] [Google Scholar]
- 42.Bäckhed F, Ding H, Wang T, Hooper LV, Koh GY, Nagy A, Semenkovich CF, Gordon JI: The gut microbiota as an environmental factor that regulates fat storage. Proc Natl Acad Sci U S A 2004;101:15718–15723 [DOI] [PMC free article] [PubMed] [Google Scholar]
- 43.Ley RE, Bäckhed F, Turnbaugh P, Lozupone CA, Knight RD, Gordon JI: Obesity alters gut microbial ecology. Proc Natl Acad Sci U S A 2005;102:11070–11075 [DOI] [PMC free article] [PubMed] [Google Scholar]
- 44.Ley RE, Turnbaugh PJ, Klein S, Gordon JI: Microbial ecology: human gut microbes associated with obesity. Nature 2006;444:1022–1023 [DOI] [PubMed] [Google Scholar]
- 45.Turnbaugh PJ, Ley RE, Mahowald MA, Magrini V, Mardis ER, Gordon JI: An obesity-associated gut microbiome with increased capacity for energy harvest. Nature 2006;444:1027–1031 [DOI] [PubMed] [Google Scholar]
- 46.Dumas ME, Barton RH, Toye A, Cloarec O, Blancher C, Rothwell A, Fearnside J, Tatoud R, Blanc V, Lindon JC, Mitchell SC, Holmes E, McCarthy MI, Scott J, Gauguier D, Nicholson JK: Metabolic profiling reveals a contribution of gut microbiota to fatty liver phenotype in insulin-resistant mice. Proc Natl Acad Sci U S A 2006;103:12511–12516 [DOI] [PMC free article] [PubMed] [Google Scholar]
- 47.Lee JY, Sohn KH, Rhee SH, Hwang D: Saturated fatty acids, but not unsaturated fatty acids, induce the expression of cyclooxygenase-2 mediated through Toll-like receptor 4. J Biol Chem 2001;276:16683–16689 [DOI] [PubMed] [Google Scholar]
- 48.Shi H, Kokoeva MV, Inouye K, Tzameli I, Yin H, Flier JS: TLR4 links innate immunity and fatty acid-induced insulin resistance. J Clin Invest 2006;116:3015–3025 [DOI] [PMC free article] [PubMed] [Google Scholar]
- 49.Vollmar B, Rüttinger D, Wanner GA, Leiderer R, Menger MD: Modulation of kupffer cell activity by gadolinium chloride in endotoxemic rats. Shock 1996;6:434–441 [DOI] [PubMed] [Google Scholar]
- 50.Pearson JM, Brown AP, Schultze AE, Ganey PE, Roth RA: Gadolinium chloride treatment attenuates hepatic platelet accumulation after lipopolysaccharide administration. Shock 1996;5:408–415 [DOI] [PubMed] [Google Scholar]
Associated Data
This section collects any data citations, data availability statements, or supplementary materials included in this article.


