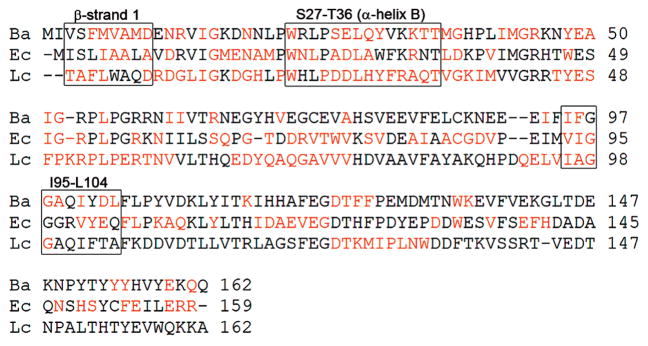
Figure 6.

Structural alignment of BaDHFR, EcDHFR, and LcDHFR. Regions of difference between binary and ternary complexes are colored in red. For BaDHFR, differences were interpreted from the titration HSQC data shown in Figure 4. For EcDHFR, differences were taken from refs 4 and 5. For LcDHFR, differences were interpreted from comparisons between the reported binary and ternary structures.
