Abstract
A TROSY-selected ZZ-exchange experiment is described for measuring slow chemical exchange rates by monitoring the TROSY component of 15N longitudinal magnetization. Application of the proposed pulse sequence to the cadherin 8 N-terminal extracelluar domain demonstrates that enhanced sensitivity is obtained, compared to a previously described TROSY-detected ZZ-exchange sequence (Sahu et al. (2007) J Am Chem Soc 129: 13232–13237), by preserving the TROSY effect during the mixing period as well as the frequency encoding periods.
Keywords: ZZ-exchange, TROSY, chemical exchange, kinetic rates, cadherin
ZZ-exchange experiments (Montelione and Wagner 1989; Wider et al. 1991; Farrow et al. 1994; Hwang and Kay 2005) have been used extensively to study slow chemical exchange processes in 15N-labeled biological macromolecules. For large molecular weight systems, significant gain in resolution and sensitivity can be obtained by utilizing the slowly relaxing component or the TROSY component for measuring dynamic parameters, as previously demonstrated by TROSY-selected (TS) Carr-Purcell-Meiboom-Gill (Loria et al. 1999; Korzhnev et al. 2004), TS Hahn Echo (Wang et al. 2003) and TS R1ρ experiments (Igumenova and Palmer 2006). In these experiments, to take full advantage of the TROSY effect, the narrow component of the 15N magnetization is maintained during both the frequency encoding periods and the spin relaxation period. In contrast, TROSY-detected (TD) experiments record evolution of “classical” longitudinal and transverse magnetizations during relaxation periods and monitor the narrow TROSY magnetization component only during frequency encoding periods (Zhu et al. 2000; Kempf et al. 2003). A recent study (Sahu et al. 2007) presented a TD 15N ZZ-exchange experiment, in which the narrow magnetization component is detected, but the TROSY effect is eliminated during the mixing period by interconverting the narrow and broad components of the longitudinal magnetization. Here, we present a TS ZZ-exchange experiment that obtains enhanced sensitivity by preserving the narrow magnetization component throughout the mixing period.
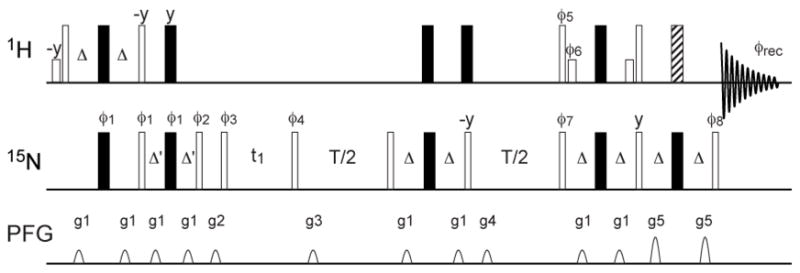
Figure 1 shows the pulse sequence of the TS ZZ-exchange experiment. The sequence includes an S3E element (Meissner et al. 1997) before the mixing period to selectively excite the SzIβ spin operator (I = 1H and S = 15N) and to dephase the SzIα spin operator and an S3CT element (Sorensen et al. 1997) in the middle of the mixing period to selectively invert the β spin state. The S3E element creates a favorable initial condition by dephasing the unwanted coherence and the S3CT element eliminates the cross relaxation between α and β spin states to first order (Kroenke et al. 1998; Igumenova and Palmer 2006). As shown in the Supplementary Information, in the absence of chemical exchange, the evolution of the spin system during the mixing period can be described by the following equations, to a first-order approximation,
Figure 1.

Pulse sequence diagram for the TS ZZ-exchange experiment. Open and filled bars represent 90° and 180° pulses, respectively. The shorter bars represent water-selective 90° pulses (~ 1.5 ms) with a rectangular shape. The hatched bar represents a 3-9-19 pulse (Sklenar et al. 1993). All pulse phases are x unless indicated otherwise. The delays are Δ = 2.7 ms and Δ′= 1.35 ms. The phase cycle is φ1 = 4 (x, −x, −y, y), φ2 = 2 (135°, 315°, 45°, 225°), 2 (315°, 135°, 225°, 45°), φ3 = 4 (x, −x, −y, y), φ4 = 4 (x, −x, y, −y), φ5 = 2 (y, y, y, y, −y, −y, −y, −y), φ6 = 2 (−y, −y, −y, −y, y, y, y, y), φ7 = 4 (−x, x, −y, y), φ8= 2 (x, x, x, x, −x, −x, −x, −x), φrec = (x, −x, y, −y, x, −x, −y, y, −x, x, −y, y, −x, x, y, −y). The phase cycle is for Bruker spectrometers. For Varian spectrometers, y and y phases should be swapped. Quadrature detection in the indirect dimension is achieved by incrementing φ4 using States-TPPI. Gradients along the z-axis have sine amplitude profile, with peak strengths and durations as follows: G1 = 7.5 G/cm, 1.5 ms; G2 = 10 G/cm, 0.5 ms; G3 = 10 G/cm, 1.5 ms; G4 = 10 G/cm, 0.5 ms; G5 = 22.5 G/cm, 1.0 ms.
| (1) |
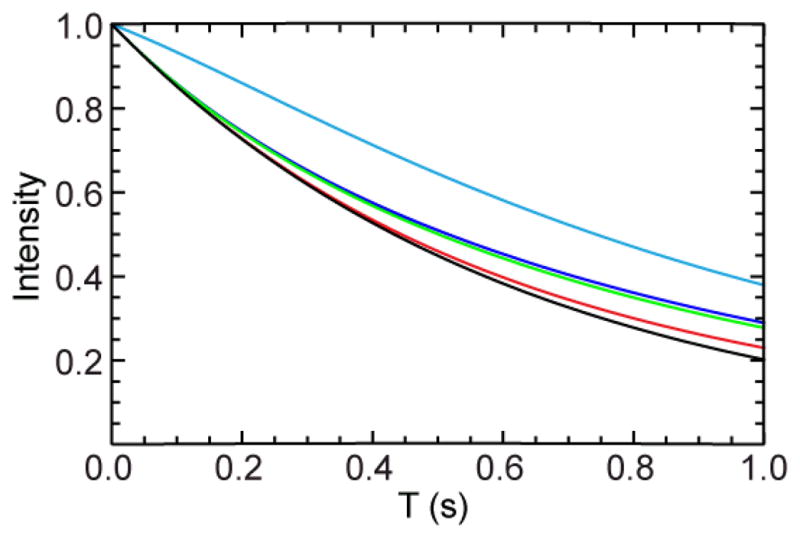
in which R1H is the 1H longitudinal relaxation rate, R̄1 = (R1N + R1HN)/2 is the average of the relaxation rates of 15N longitudinal magnetization and two-spin order, σ is the 1H-15N heteronuclear cross relaxation rate, ηz is the longitudinal 15N-1H dipole/15N CSA cross-correlated relaxation rate, ηH is the longitudinal 15N-1H dipole/1H CSA cross-correlated relaxation rate. The phase of the last 15N 90° pulse in the S3CT element should be set to invert the β spin state, which ensures that the effects of 1H-15N heteronuclear cross relaxation and 15N-1H dipole/1H CSA cross-correlated relaxation are eliminated to first order. The presence of both S3E and S3CT elements ensures that the evolution of the selected TROSY component is nearly mono-exponential during the mixing period in the absence of population exchange, which allows the same data analysis procedure to be used as for the conventional ZZ-exchange experiment (Farrow et al. 1994), in which the longitudinal 15N magnetization is utilized for monitoring exchange rates and the magnetization is subsequently transferred back to 1H for detection by an INEPT scheme. Numerical simulations (Figure 2) show that omitting either element results in appreciable deviation from the ideal mono-exponential decay profile for the SzIβ spin operator.
Figure 2.

Simulated trajectories of SzIβ operator during the mixing period when only the S3E element (green), only the S3CT (blue), both S3E and S3CT elements (red), and no S3E or S3CT elements (cyan) are included in the pulse sequence of Figure 1. The black line represents a mono-exponential function with the decay rate equal to R̄1−η z. The relaxation parameters used for the simulations are the following: R1H = 2.5 s−1; R1N = 1.8 s−1; R1HN = 3.8 s−1; ηz = 1.2 s−1; η H = 1.0 s−1; σ = 0.03 s−1. A rotational correlation time of 10 ns was used to estimate the relaxation parameters.
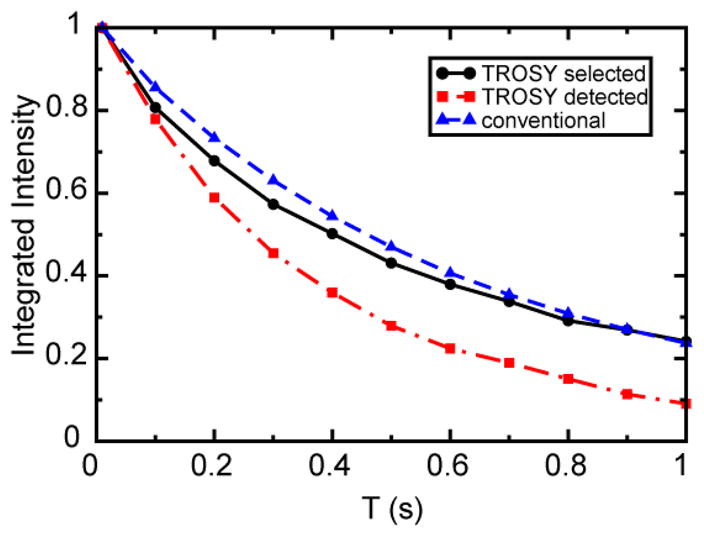
The advantage of the TS ZZ-exchange experiment over the TD ZZ-exchange experiment (Sahu et al. 2007) is the slower decay of the selected coherence during the mixing period. We compared the performance of these two experiments, as well as the conventional ZZ-exchange experiment (Farrow et al. 1994), using a sample of 15N, 2H-labeled cadherin 8 N-terminal extracellular (EC1) domain, whose dynamic properties have been characterized previously (Miloushev et al. 2008). The NMR sample contains 0.9 mM protein in 50 mM D13-morpholino-ethane-sulfonate (MES), 500 mM D5–Gly at pH 6.0 and 10% D2O. The cadherin 8 EC1 domain has a molecular weight of 10 kDa and forms dimers with affinity in the μM to mM range, depending on solution pH and ionic strength. The kinetic rates for exchange between monomeric and dimeric species under equilibrium conditions are in the slow-exchange regime suitable for ZZ-exchange experiments. NMR experiments were performed on a Bruker DRX spectrometer operating at 600 MHz 1H frequency and equipped with a triple-resonance z-axis gradient CryoProbe. The sample temperature was 306.6 K, which was calibrated using 99.8% D4-methanol (Findeisen et al. 2007). We recorded the first row of each 2D experiment at 10 mixing times and compared the decay of total integrated intensity of signals in the amide 1H region. As shown in Figure 3, under current sample and experimental conditions, the decay is significantly slower in the TS ZZ-exchange experiment than in the TD experiment and is comparable to the conventional experiment. The additional loss in sensitivity resulting from the S3E element in the TS experiment compared to the TD experiment was estimated from the total integrated signal intensities at 10 ms mixing time to be ~ 10 %. Overall, the TS experiment gave approximately a factor of 2 enhancement in sensitivity at the longest mixing time (1 s). While both TS and TD experiments enhance spectral resolution to the same extent, the TS experiment is particularly beneficial for measuring relatively slow exchange rates, which requires utilization of long mixing times. The superior performance of the TS experiment over the TD experiment results solely from the effect of longitudinal 15N-1H dipole/15N CSA cross-correlated relaxation during the mixing period. Both the TD and TS experiments are affected identically by the increased apparent relaxation rate R̄1, compared with R1N, caused by 1H-1H dipolar interactions with remote spins (eq. 1). The resolution and sensitivity enhancement of both TD and TS experiments over the conventional experiment relies on the deuteration of nonexchangeable sites in the protein, which attenuates the dipolar interactions between amide and remote 1H spins. The enhanced resolution is important particularly for resolving exchange cross peaks when the resonance frequencies of exchanging spins are close (Sahu et al. 2007).
Figure 3.

Decay curves of the total integrated intensity of signals in the amide 1H region during the mixing periods of TS ZZ-exchange (black, circle), TD ZZ-exchange (red, square) and conventional ZZ-exchange (blue, triangle) experiments performed on 15N, 2H-labeled cadherin 8 EC1 domain at 306.6 K. The lines connecting data points only serve as guide for the eye and do not represent fits to the data.
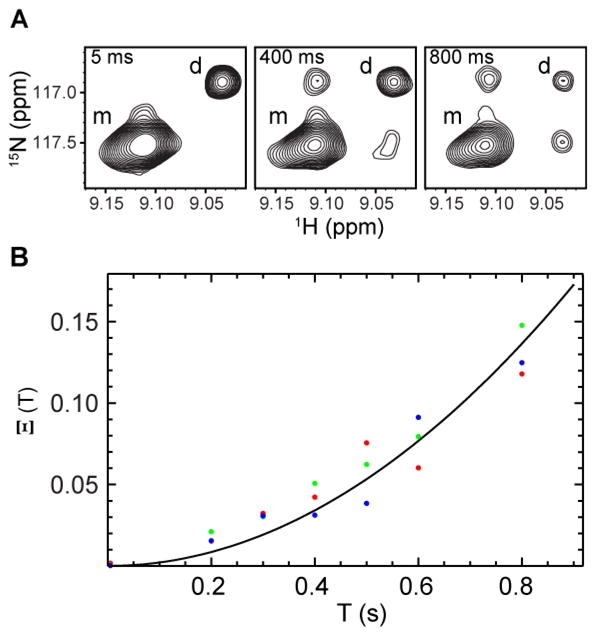
To measure kinetic rate constants, a set of 2D data was recorded at seven mixing times (5, 200, 300, 400, 500, 600, 800 ms) using the TS ZZ-exchange sequence. A composite ratio of auto- and cross-peak intensities, which has quadratic time dependence, was employed to extract kinetic on- and off-rate constants as described previously (Miloushev et al. 2008). The expression is given below
| (2) |
where Iij is the auto- or cross-peak intensity with i and j standing for initial and final states, respectively, monomers and dimers are denoted by M and D, respectively, [M] represents the equilibrium concentration of monomers, and the factor of 4 arises from the dimerization reaction. The main benefit of using the composite ratio is to cancel the effects of differences in R1 relaxation rates of monomeric and dimeric species, as well as differences in the transfer efficiencies during the preparation period and linewidths during the detection period. Figure 4 shows the composite ratio of peak intensities as a function of the mixing time for three residues (G41, Q49 and A69), which give well-resolved auto- and cross-peaks. The data were globally fit to eq. 2 using the nonlinear least-squares fitting procedure implemented in Mathematica (Wolfram Research, Inc.). The best-fit value for 4koff kon [M] is 0.21 ± 0.01 s−1. Uncertainties in the fitting parameter were determined by the jackknife procedure (Mosteller and Tukey 1977) and reflect the grouping of data on a residue basis. Values of KD and [M] were calculated from the relative equilibrium populations of monomers and dimers determined from a 1H-15N TROSY spectrum with a pulse delay of 6 s, which is long enough for both monomeric and dimeric species to be fully relaxed, and the total protein concentration determined from absorbance at 280 nm. Using these results, the measured off-rate constant was 0.79 ± 0.08 s−1 and the bimolecular on-rate constant was 86 ± 8 s−1 M−1 at 306.6 K. The differences between these rate constants and values reported previously (Miloushev et al. 2008) arise primarily from the larger monomer-dimer equilibrium dissociation constant for the present sample, evident in Figure 4a.
Figure 4.

(A) Typical ZZ-exchange spectra of 15N, 2H-labelled cadherin 8 EC1 domain, showing the buildup of cross-peaks. Monomers and dimers are denoted by m and d, respectively. (B) Buildup curve of the composite ratio of auto- and cross-peak intensities of residues G41 (green), Q49 (red) and A69 (blue). The solid line indicates the fit of the data to eq. 2.
In summary, we have presented a TS ZZ-exchange experiment with sensitivity enhanced by preserving the slowly relaxing TROSY 15N magnetization component in the mixing period. The performance of this experiment has been demonstrated on a cadherin 8 EC1 domain that is in slow exchange, on the chemical shift time scale, between monomeric and dimeric states. The TS ZZ-exchange experiment is useful both for application to larger proteins and for situations in which exchange cross peaks must be detected between nearly degenerate resonances.
Supplementary Material
Acknowledgments
This work was supported by National Institutes of Health (NIH) grant GM59273 (A. G. P.). We thank Fabiana Bahna and Prof. Lawrence Shapiro for assistance in sample preparation.
References
- Farrow NA, Zhang O, Forman-Kay JD, Kay LE. A heteronuclear correlation experiment for simultaneous determination of 15N longitudinal decay and chemical exchange rates of systems in slow equilibrium. J Biomol NMR. 1994;4:727–734. doi: 10.1007/BF00404280. [DOI] [PubMed] [Google Scholar]
- Findeisen M, Brand T, Berger S. A 1H-NMR thermometer suitable for cryoprobes. Magn Reson Chem. 2007;45:175–178. doi: 10.1002/mrc.1941. [DOI] [PubMed] [Google Scholar]
- Hwang PM, Kay LE. Solution structure and dynamics of integral membrane proteins by NMR: a case study involving the enzyme PagP. Methods Enzymol. 2005;394:335–350. doi: 10.1016/S0076-6879(05)94013-5. [DOI] [PubMed] [Google Scholar]
- Igumenova TI, Palmer AG. Off-resonance TROSY-selected R1ρ experiment with improved sensitivity for medium- and high-molecular-weight proteins. J Am Chem Soc. 2006;128:8110–8111. doi: 10.1021/ja061692f. [DOI] [PubMed] [Google Scholar]
- Kempf JG, Jung JY, Sampson NS, Loria JP. Off-resonance TROSY (R1ρ − R1) for quantitation of fast exchange processes in large proteins. J Am Chem Soc. 2003;125:12064–12065. doi: 10.1021/ja037101s. [DOI] [PubMed] [Google Scholar]
- Korzhnev DM, Kloiber K, Kanelis V, Tugarinov V, Kay LE. Probing slow dynamics in high molecular weight proteins by methyl-TROSY NMR spectroscopy: application to a 723-residue enzyme. J Am Chem Soc. 2004;126:3964–3973. doi: 10.1021/ja039587i. [DOI] [PubMed] [Google Scholar]
- Kroenke CD, Loria JP, Lee LK, Rance M, Palmer AG. Longitudinal and transverse 1H-15N dipolar 15N/chemical shift anisotropy relaxation interference: Unambiguous determination of rotational diffusion tensors and chemical exchange effects in biological macromolecules. J Am Chem Soc. 1998;120:7905–7915. [Google Scholar]
- Loria JP, Rance M, Palmer AG. A TROSY CPMG sequence for characterizing chemical exchange in large proteins. J Biomol NMR. 1999;15:151–155. doi: 10.1023/a:1008355631073. [DOI] [PubMed] [Google Scholar]
- Meissner A, Duus JO, Sørensen OW. Spin-state-selective excitation. Application for E.COSY-type measurement of JHH coupling constants. J Magn Reson. 1997;128:92–97. [Google Scholar]
- Miloushev VZ, Bahna F, Ciatto C, Ahlsen G, Honig B, Shapiro L, Palmer AG. Dynamic properties of a type II cadherin adhesive domain: implications for the mechanism of strand-swapping of classical cadherins. Structure. 2008;16:1195–1205. doi: 10.1016/j.str.2008.05.009. [DOI] [PMC free article] [PubMed] [Google Scholar]
- Montelione GT, Wagner G. 2D chemical exchange NMR spectroscopy by proton-detected heteronuclear correlation. J Am Chem Soc. 1989;111:3096–3098. [Google Scholar]
- Mosteller F, Tukey JW. Data Analysis and Regression. A Second Course in Statistics. Addison-Wesley; Reading, MA: 1977. [Google Scholar]
- Sahu D, Clore GM, Iwahara J. TROSY-based z-exchange spectroscopy: application to the determination of the activation energy for intermolecular protein translocation between specific sites on different DNA molecules. J Am Chem Soc. 2007;129:13232–13237. doi: 10.1021/ja074604f. [DOI] [PubMed] [Google Scholar]
- Sklenar V, Piotto M, Leppik R, Saudek V. Gradient-tailored water suppression for 1H-15N HSQC experiments optimized to retain full sensitivity. J Magn Reson A. 1993;102:241–245. [Google Scholar]
- Sørensen MD, Meissner A, Sørensen OW. Spin-state-selective coherence transfer via intermediate states of two-spin coherence in IS spin systems: Application to E.COSY-type measurement of J coupling constants. J Biomol NMR. 1997;10:181–186. [Google Scholar]
- Wang C, Rance M, Palmer AG. Mapping chemical exchange in proteins with MW > 50 kD. J Am Chem Soc. 2003;125:8968–8969. doi: 10.1021/ja035139z. [DOI] [PubMed] [Google Scholar]
- Wider G, Neri D, Wuthrich K. Studies of slow conformational equilibria in macromolecules by exchange of heteronuclear longitudinal 2-spin-order in a 2d difference correlation experiment. J Biomol NMR. 1991;1:93–98. [Google Scholar]
- Zhu G, Xia Y, Nicholson LK, Sze KH. Protein dynamics measurements by TROSY-based NMR experiments. J Magn Reson. 2000;143:423–426. doi: 10.1006/jmre.2000.2022. [DOI] [PubMed] [Google Scholar]
Associated Data
This section collects any data citations, data availability statements, or supplementary materials included in this article.


