

Abstract
Slow firing septal neurons modulate hippocampal and neocortical functions. Electrophysiologically, it is unclear whether slow firing neurons belong to a homogeneous neuronal population. To address this issue, whole-cell patch recordings and neuronal reconstructions were performed on rat brain slices containing the medial septum/diagonal band complex (MS/DB). Slow firing neurons were identified by their low firing rate at threshold (< 5Hz) and lack of time-dependent inward rectification (Ih). Unsupervised cluster analysis was used to investigate whether slow firing neurons could be further classified into different subtypes. The parameters used for the cluster analysis included latency for first spike, slow afterhyperpolarizing potential, maximal frequency and action potential (AP) decay slope. Neurons were grouped into three major subtypes. The majority of neurons (55%) were grouped as cluster I. Cluster II (17% of neurons) exhibited longer latency for generation of the first action potential (246.5±20.1 ms). Cluster III (28% of neurons) exhibited higher maximal firing frequency (25.3±1.7 Hz) when compared to cluster I (12.3±0.9 Hz) and cluster II (11.8±1.1 Hz) neurons. Additionally, cluster III neurons exhibited faster action potentials at suprathreshold. Interestingly, cluster II neurons were frequently located in the medial septum whereas neurons in cluster I and III appeared scattered throughout all MS/DB regions. Sholl’s analysis revealed a more complex dendritic arborization in cluster III neurons. Cluster I and II neurons exhibited characteristics of “true” slow firing neurons whereas cluster III neurons exhibited higher frequency firing patterns. Several neurons were labeled with a cholinergic marker, Cy3-conjugated 192 IgG (p75NTR), and cholinergic neurons were found to be distributed among the three clusters. Our findings indicate that slow firing medial septal neurons are heterogeneous and that soma location is an important determinant of their electrophysiological properties. Thus, slow firing neurons from different septal regions have distinct functional properties, most likely related to their diverse connectivity.
Keywords: basal forebrain, cholinergic, brain slices, intrinsic properties, rat
Medial septum/diagonal band of Broca neurons (MS/DB) are primarily classified by electrophysiological properties and associated neurochemical content. Although slight variations may appear among different classifications, researchers, in general, have reported that these neurons may exhibit slow firing, regular firing, fast spiking, cluster firing and burst generating capabilities (Griffith et al., 1991, Matthews and Lee, 1991, Jones et al., 1999, Morris et al., 1999, Knapp et al., 2000, Henderson et al., 2001, Sotty et al., 2003). Slow firing neurons are characterized by slow firing rates and pronounced slow post-spike afterhyperpolarization potentials (sAHP) (Griffith, 1988). Also, slow firing neurons have been identified as cholinergic by post-recording immunohistochemistry using anti-acetylcholinesterase antibody (Griffith and Matthews, 1986). Another strategy used to identify slow firing neurons as cholinergic is the use of Cy3-conjugated 192 IgG, which targets the low affinity nerve growth factor receptor (p75NTR), thus, selectively labeling basal forebrain cholinergic neurons (Hartig et al., 1998, Wu et al., 2000).
Classification of electrophysiological, neurochemical and morphological phenotypes in MS/DB neurons is relevant to understanding the physiological roles of several types of neurons in septum-related activity. For instance, in vivo recordings using the sharp-microelectrode technique demonstrated that a group of MS/DB cells displaying long-duration action potential and long-duration AHP usually fire at slow rates and have been included in the slow firing category (Brazhnik and Fox, 1997). These membrane properties were consistent with putative magnocellular cholinergic neurons previously identified in vitro (Griffith and Matthews, 1986, Markram and Segal, 1990). In vivo rhythmic firing of these slow firing neurons were associated mainly with the positive peak of the dentate gyrus theta rhythm (Brazhnik and Fox, 1997). Previous studies led to a general notion that cholinergic MS/DB are homogeneous, exhibiting similar firing behavior as described above (Griffith and Matthews, 1986, Griffith, 1988, Markram and Segal, 1990, Griffith et al., 1991, Brazhnik and Fox, 1997, Brazhnik and Fox, 1999). However, more recent work revealed that some basal forebrain cholinergic neurons do show bursting capabilities (Lee et al., 2005). This diversity in firing properties among basal forebrain cholinergic neurons may be related to connectivity. In this case, neurochemically identified medial septal cholinergic neurons may be more electrophysiologically diverse than formerly proposed due to specific connectivity patterns present in each medial septal subregion (Colom, 2006).
Our initial analysis of current-clamp recordings from MS/DB neurons revealed that the firing properties of medial septal neurons exhibited great variability. Heterogeneity of firing characteristics was evident in all of the classically-described electrophysiological phenotypes including regular firing, fast spiking and burst-firing neurons. Indeed, several recorded neurons were nearly impossible to classify according to the classical subtypes (Sotty et al., 2003, Manseau et al., 2005). This manuscript focuses on the diversity of slow firing neurons of the MS/DB region. Analysis of the firing properties of other medial septal neuronal groups will follow in subsequent work.
One major obstacle in categorizing neurons is determining whether a subjectively defined category can be assigned to a distinct subgroup or if a continuous spectrum of physiological properties exists in a larger population (for review see Nowak et al., 2003). In order to address this problem, we used cluster analysis on patch-clamp data recorded in vitro from adult rat MS/DB neurons to identify subgroups of slow firing neurons. Several electrophysiological properties served as clustering variables. Once the different cell classes and subclasses of slow firing neurons were determined via cluster analysis, we examined relevant morphological properties and location in the MS/DB. Our data indicate that slow firing neurons are heterogeneous in their electrophysiological properties.
Experimental procedures
Animals and medial septum/diagonal band slices
Experimental protocols were approved by the Institutional Animal Care and Use Committee (IACUC) and experiments were carried out in accordance with the National Institute of Health Guide for the Care and Use of Laboratory Animals (NIH Publications No. 80-23). Briefly, slices containing MS/DB were prepared from 15 to 25 day old male Sprague Dawley rats. Animals were deeply anesthetized with ketamine (10 mg/kg i.p) and sacrificed by rapid decapitation. The brain was then quickly removed and immersed in ice-cold dissecting artificial cerebrospinal fluid (ACSF) (in mM): 200 sucrose, 3 KCl, 1 CaCl2, 5 MgSO4, 25 NaHCO3, 25 NaH2PO4 and 10 dextrose, gassed with 95% O2 and 5% CO2 to equilibrate the pH at 7.3–7.4. The brain was mounted on a plastic tray with cyanoacrylate glue. Then, 350μm-thick coronal slices containing MS/DB were prepared using vibratome (OTS-4000, EMS, PA). The MS/DB and surrounding structures of basal forebrain was carefully dissected using 25-gauge needles. The MD/DB slices were transferred to a holding chamber at room temperature (22–24°C) and bathed for at least 60 minutes in a solution of standard ACSF (in mM): 120 NaCl, 3 KCl, 2 CaCl2, 1.3 MgSO4, 25 NaHCO3, 25 NaH2PO4 and 10 dextrose.
Electrophysiology
Slices were individually transferred to a glass-bottom recording chamber (~1.5 ml volume) on a fixed stage of an upright Axioscope FS microscope (Zeiss, Oberkochen, Germany). The slices were kept submerged and stabilized using a fine nylon grid glued on a U-shaped platinum holder while being perfused via gravity-driven sewer pipe system with rapidly flowing (1.3–1.5 ml/min) oxygenated ACSF. Individual neurons located in medial septum, vertical and horizontal limb of the diagonal band of Broca were obtained well below the surface of the slice (~ 50–150 μm) and visualized using water-immersion objectives (40x) and infrared differential interference contrast optic (DIC-IR) illumination. Recordings were performed at a set temperature of 24 ± 0.3°C. Patch electrodes were pulled from borosilicate thin-walled glass (1.5 mm OD; 150F-4, World Precision Instruments, Sarasota, FL) in four steps on a horizontal micropipette puller (model P-87, Sutter Instrument, Novato, CA). The internal recording pipette solution contained (in mM): 120 potassium gluconate, 2.5 KCl, 10 HEPES, 2 MgCl2, 2 Na-ATP, 2 Na2-GTP, 0.3 Tris; pH adjusted to 7.3 with 1M KOH (resistance of 4–6 MΩ). In order to characterize morphological aspects of recorded neurons 0.5% Neurobiotin (Vector Labs, Burlingame, CA, USA) was included in the patch pipette. Whole-cell recordings were obtained in voltage-clamp configuration and then shifted to a current-clamp mode by means of the “bridge” circuit of Axopatch 200B amplifier (Axon Instruments, Foster City, CA). Signals were digitized at 10 KHz (Digidata 1322A) and stored using data acquisition software PCLAMP 9 (Axon instruments). After a giga-seal was formed (usually >2 GΩ), the electrode capacitance was cautiously diminished before rupturing the patch to allow for the electronic compensation of pipette charging during subsequent current-clamp recordings. After balancing the off-set, membrane potential was measured relative to a reference electrode. Reported membrane potential values were adjusted off-line for liquid-junction potentials (usually ≤5 mV). Series resistance (range accepted was 10–20 MΩ) was monitored on-line using pClamp9.0 software (Axon Instruments). The average series resistance was 12.5 ± 2 MΩ and data were uncorrected for this error. Recordings were discarded if series resistance changed by >20% or was unstable. In order to have a representative sample of the MS/DB neuronal population, only stable and healthy neurons were considered in further analysis of membrane properties. Our criteria for selection included resting membrane potential negative to −55 mV; a minimum holding current (less than 50 pA) was accepted during the whole experiment to “retain” resting membrane potential if current does not interfere with firing behavior; overshooting action potentials (>75 mV) and/or input resistance > 60 MΩ. In order to allow stabilization of internal solution and recover from patching procedures (membrane rupture by suction), 5 minutes were allowed to pass before assessing membrane properties. Trials included in our analysis were selected from recordings made after this period.
Analysis of membrane property variables
The study of electrophysiological properties and further statistical analysis was restricted to neurons exhibiting characteristics of slow firing neurons. Neurons were considered slow firing cells if they met the following criteria: (1) absent time-dependent inward rectification corresponding to hyperpolarization-activated cation current (Ih) and (2) prominent slow afterhyperpolarization (sAHP) (> 5 mV) and (3) slow firing rate <5 Hz at threshold depolarizing current injection. Although a classical principle of recognizing slow firing neurons is their slow firing frequency at threshold depolarization, we found that many neurons exhibiting slow firing characteristics also fired at high frequencies in response to suprathreshold depolarizing current steps. Once stable recordings were obtained, several passive and active electrophysiological variables were analyzed in recorded neurons using different injection current protocols (Figure 1). Square current pulses (0.4 s duration) were injected to characterize electrophysiological properties of neurons. Intrinsic membrane properties were measured following described procedures (Henderson et al., 2001, Sanabria et al., 2001). Passive intrinsic properties included resting membrane potential (RMP), input membrane resistance (Rm), and membrane time constant (τm). Action potential parameters were measured from the first action potential evoked by the supra-threshold 0.4 s depolarizing current pulse step. Spike amplitude was determined by measuring the difference between RMP and the peak of the action potential. Spike threshold was determined by finding the potential at which the second derivative of the voltage waveform trace (period preceding action potential onset) exceeded three times its standard deviation. Action potential half-width, rise and decay slope (mV/ms) were obtained using event detection and statistics analysis in software Clampfit 9 (PCLAMP9). The latency for the first action potential in a train was assessed from the beginning of the threshold depolarizing pulse. Some slow firing neurons fired a maximum of one or two action potentials even at high depolarizing currents. However, following action potential a pronounced long-lasting AHP was commonly observed. This slow apamin-sensitive hyperpolarizing potential is considered a post-spike form of sAHP (Griffith, 1988, Gorelova and Reiner, 1996). Therefore, sAHP amplitude was measured at the point of maximum hyperpolarized voltage deflection relative to the RMP. sAHP amplitude strongly correlated with its duration, therefore, we only include sAHP amplitude in our analysis. Repetitive firing properties were investigated following injection of 0.4 s depolarizing pulses of increasing amplitude. Maximum firing frequency (F Max) was determined as the mean instant frequency computed during the first 0.4 s at suprathreshold intensity of current necessary for evoking repetitive firing (during last or second to last depolarizing step, whichever is greater). Steady-state firing rate was computed as the average of instantaneous frequency for the last 0.4 s of a train. To assess Ih, the membrane potential of each cell was first held at −75 mV and a series of 0.4 s hyperpolarizing pulses (0–400 pA, step= −50 pA) were applied reaching < −150 mV for maximum hyperpolarization of membrane potential as previously described (Thinschmidt et al., 2005).
Figure 1.
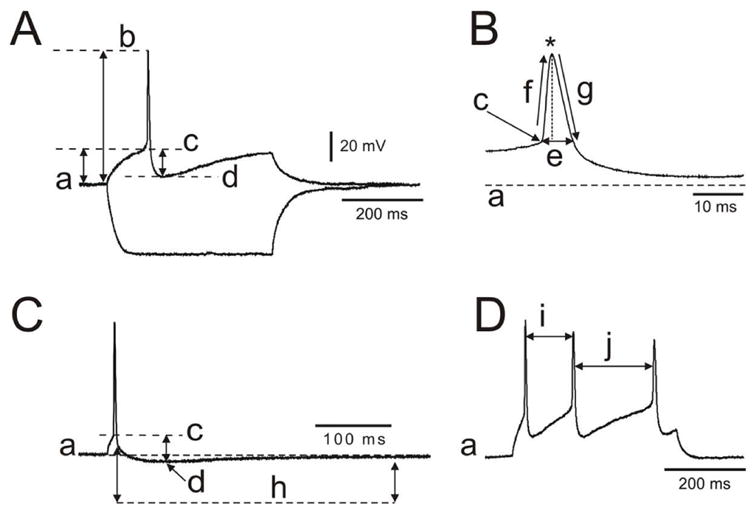
Intrinsic membrane properties were measured following described procedures. Using current clamp configuration, square current pulses (0.4 s duration) were injected to assess passive and active intrinsic properties of neurons. A. Membrane parameters: a, resting membrane potential, RMP; a–b, action potential amplitude, AP(mV); a–c, AP threshold; c–d, afterhyperpolarization potential amplitude, AHP(mV). B. Spike parameters: c, spike threshold; e, width; f, rise slope; g, decay slope; *spike peak. C. Brief current parameters: h, duration of afterhyperpolarizing potential, AHP (ms). D. i, j, interspike interval used to calculate F Max at higher depolarizing step.
Cluster analysis of neuronal subtypes
In order to sort slow firing MS/DB neurons without a priori knowledge of a number of subgroups, we used multivariate statistical analysis and hierarchical clustering techniques on several electrophysiological measurements (Statistica, Statsoft, Tulsa, OK). The cluster analysis was used to test the null hypothesis that slow firing neurons constitute a homogeneous population. The firing behavior of the neuron was first inspected visually for heterogeneity and later analyzed via unsupervised clustering analysis. This technique can assist in uncovering data structure and providing a scheme for classifying neuronal subtypes (Pennartz et al., 1998, Nowak et al., 2003, Halabisky et al., 2004). This method consists of plotting individual objects (neurons) in multidimensional space according to similarities or dissimilarities of input variables (electrophysiological parameters). The neurons spatially closest to each other are grouped together as a cluster. The analysis was performed using Ward’s method which is based on the sum of squares between the clusters (Euclidean distances, summed over all variables) (Anderson et al., 1998) allowing an objective segregation of cell groups as previously reported (Pennartz et al., 1998, Cauli et al., 2000, Nowak et al., 2003). Electrophysiological variables were normalized to a common range (0–1) before performing the multidimentional analysis. Normalization was performed by computing the range normalization scores (RN) for variable data as follows: RN = (x − xmin)/(xmax − xmin), where x is data values, and xmin and xmax are the minimal and maximum values respectively (Halabisky et al., 2006). For cluster analysis, variables were selected based on their lack of linear correlation with each other and the presence of multimodality (non-normal distribution) (Nowak et al., 2003). Additionally, several variables were excluded as follows: (1) action potential amplitude which could be influenced by the quality of the capacitance compensation which, in turn, depends on the depth of the patch pipette in the slice; (2) the input resistance and membrane time constant which could also be transiently affected by levels of spontaneous ongoing activity when present (Bernander et al., 1991, Schaap et al., 1999). If two variables were strongly correlated (for instance: spike width and decay slope of action potential) only one of these variables was included in the analysis to avoid redundancy. Multiple discriminate analyses were performed to assess the most valuable variables in predicting cluster membership (Halabisky et al., 2006). Ultimately, AP latency, AP decay slope, AHP, and F Max were selected for cluster analysis. Joining trees were constructed using Ward’s method of amalgamation available in Statistica. The results of this classification were plotted as a hierarchical tree or dendrogram in which the horizontal axis denotes the linkage distance calculated as Euclidean distance. The result of the cluster analysis indicates the degree of similarity among neurons but does not assign statistical significance to the grouping procedure. ANOVA tests were used to determine whether the resulting clusters of neurons exhibit statistically different properties. Tukey’s post-hoc analysis was then applied, when necessary, to compare means. Statistical significance was set at p<0.05. All data values are presented as means ± SEM. The n value represents the number of MS/DB neurons exhibiting an identified firing phenotype.
Neuronal Morphology
Thirty-five neurons were successfully stained to explore morphological features. These neurons were labeled with neurobiotin during current injection protocols used at the end of recording sections by passing approximately 6 minutes of hyperpolarizing current pulses (0.4–0.6 nA) of 0.4 s duration, 50% duty cycle. Recording sessions lasted approximately 25–30 minutes. The position of each neuron was marked in a sketch of the MS/DB slice in order to assist in a posteriori identification of the labeled neuron. The slices were then carefully removed from the recording chamber and immersion-fixed between filter papers (marking position and recorded surface) for at least 24 h in 0.1M sodium phosphate-buffered (PB) 4% paraformaldehyde at 4°C (pH 7.4). The neurobiotin-filled cells were visualized using Vectastain ABC Elite kit (Vector Labs, Burlingame, CA) in several of slices simultaneously (4–8 slices). Briefly, the whole slices were rinsed in 0.1 M PBS containing 0.4 Triton X-100 in an orbital shaker for about 2 h to remove excess fixative. Endogenous peroxidase was suppressed by incubating slices in 2% H2O2 in PBS for 2 h. Finally, sections were incubated in avidin–biotin complex (Vector Labs, Burlingame, CA, USA) for 4 h. (room temperature). Sections were developed with diaminobenzidine (DAB), (Vector Labs, Burlingame, CA, USA), mounted onto gelatin-coated slides, dehydrated in graded ethanol, cleared in xylene and coverslipped and subjected to morphological analysis.
Morphological analysis of neurobiotin-labeled neurons
Neurobiotin-labeled cells were traced and reconstructed using a computer-aided tracing system (Neurolucida, MicroBrightField, Colchester, VT) and an Axiovert 200 inverted microscope (Zeiss, Germany) equipped with 100x oil immersion objectives. Dendritic and axonal morphometric analyses were performed in reconstructed neurons. Values were not adjusted for tissue shrinkage. MS/DB neurons with strong labeling (axon and dendrites) were included in the analyses. Neurons that were not well labeled were discarded. Location of individual neurons in the MS/DB area was determined using Paxino’s atlas (Paxino’s, 1998). A detailed tracing of the dendrites and axon (when visible) was drawn from the digitized image on a high-definition monitor screen. Reconstruction of neuronal processes was conducted at different planes in the sections. For reconstruction and detailed, quantitative, morphological analysis, a subset of well-labeled neurons from each cluster was selected based on the following criteria: (1) intense neurobiotin labeling of dendritic branches and spines, primary axon, and axon collaterals; (2) no large- or medium-diameter dendritic branches cut at the slice surface. Axons were identified by their trajectory within the slice, some axons headed towards midline fornix resembling septo-hippocampal projecting axons. Analytical software allowed various numeric and graphical representations of the axonal and dendritic trees (e.g. dendrogram, polar histograms). Dendrite diameters, length and the location of dendritic spines and varicosities were also recorded. These data allowed a computer generated reconstruction of the entire dendritic and axonal tree and the calculation of a variety of morphological measurements such as surface area and length. The location and correct orientation of the dendrites in relation to the borders of the MS/DB area were entered using contour drawings of MS/DB with 4x and 10x objectives.
To gain more insight into the spatial distribution and extension of the dendrites relative to the soma of slow firing neurons dendritic branching pattern was assessed by Sholl’s method (Sholl, 1953). Briefly, concentric spheres of a constant interval of 10 μm, with the center of the soma as the origin, were drawn for each filled neuron. The amount (length) of dendrite contained within each circle was counted, and the means and standard errors were calculated and plotted as a function of the distance to the soma. This analysis was performed using NeuroExplorer (MFB Bioscience).
A one-way analysis of variance (ANOVA) was performed to determine morphological differences amongst cluster I, cluster II and cluster III neurons. ANOVA analysis was followed by Tukey’s post hoc analysis. Significant differences for all statistical testing were defined by a p value of less than 0.05. All data values are presented as means ± SEM. All statistical tests were performed using statistical analysis software (SPSS 14.0, SPSS, Inc., Chicago, Illinois).
In vivo labeling of MS/DB cholinergic neurons using cy3-192IgG
In basal forebrain neurons p75NTR labeling is accepted as an immunohistochemical marker for cholinergic neurons (Hartig et al., 2002). In five anesthetized rats, Cy3-192 IgG (4 μcl) was administered bilaterally into the lateral ventricles via a Hamilton syringe. The coordinates used were: 0.8 mm posterior from bregma, 1.5 mm lateral from midline, and 3.5 mm below the dura. Slices were prepared from injected animals after a survival period of at least 48 hours. Recordings from unlabeled neurons were restricted to animals injected bilaterally. Cy3-labeled neurons were identified using fluorescence illumination and rhodamine filter. Neurons were then visualized with DIC-IR and electrophysiologically recorded to study firing characteristics.
RESULTS
Electrophysiological variability of intrinsic membrane properties of MS/DB neurons
Neurons were first visually classified as “slow firing neurons” according to described criteria and then electrophysiological variables were analyzed for development of non-supervised cluster analysis. Normal probability plots and Shapiro-Wilcox test for normality revealed that the distribution of several electrophysiological variables deviated from normality (Table 1). Property variability was evident in Table 1 and Figure 2. The action potential half-width was not normally distributed (p=.048). The action potential rising and decay slope also deviated significantly from normality and strongly correlated with the action potential half-width (Table 1). For cluster analysis we selected only one of these parameters to avoid redundancy (e.g. action potential decay slope). The latency for first action potential evoked at around −70 mV in all neurons (p=0.048) was non-normally distributed. Several depolarizing steps of current injection were applied to explore the firing properties of these neurons. At lower depolarizing steps (above threshold) (20–60 pA), neurons fired at a mean frequency of < 5 Hz exhibiting a normal distribution (data not shown). Nevertheless, at higher current steps (suprathreshold stimuli), these neurons exhibited different firing behavior (F Max) with a non-normal distribution (Table 1, p<0.01).
Table 1.
Intrinsic membrane properties of subjectively classified slow firing neurons and statistical analysis of normality of electrophysiological variables using the Shapiro-Wilk’s test.
| Membrane Properties | Slow Firing Neurons n=60 | Shapiro-Wilcox Test | |
|---|---|---|---|
| Statistic | p | ||
| RMP (mV) | −70.62 ± 1.87 | 0.975 | 0.253 |
| RM (mOhm) | 39.86 ± 1.79 | 0.962 | 0.580 |
| τm (ms)* | 34.33 ± 1.99 | 0.912 | < 0.001 |
| AP (mV) | 85.96 ± 2.05 | 0.969 | 0.123 |
| AP threshold (mV) | −53.14 ± 0.90 | 0.970 | 0.123 |
| AP latency (ms) | 101.26 ± 10.61 | 0.832 | 0.151 |
| AP half width (ms)* | 2.13 ± 0.11 | 0.963 | 0.068 |
| AP rise slope (mV/ms)* | 57.72 ± 3.98 | 0.960 | 0.047 |
| AP decay slope (mV/ms)* | −24.19 ± 1.55 | 0.939 | 0.005 |
| AHP (mV)* | 7.51 ± 0.51 | 0.656 | 0.023 |
| AHP (ms)* | 214.51 ± 20.16 | 0.953 | 0.023 |
| F Max (Hz)* | 15.37 ± 1.06 | 0.950 | < 0.001 |
Abbreviations: RMP, resting membrane potential; RM, membrane resistance; τm, membrane time constant; AP, action potential; AHP, afterhyperpolarization potential; F Max, maximum frequency. Data shown as mean ± SEM; statistic = Shapiro-Wilcox statistic; df = degrees of freedom = 60; p= level of significance,
statistically significant, p<0.05.
Figure 2.

Neurons subjectively classified as slow firing (a–i) also exhibit significant variability in firing behavior although lack of time dependent inward rectification was a common (Ih) characteristic. Membrane potential held at −70 mV in all neurons. Hyperpolarizing current in a–i was −100 pA. Depolarizing currents in a, b–c, d, e, f, g–i were +40 pA, +20 pA, +80 pA, +20 pA, +40 pA, +20 pA, respectively.
Classification of slow firing neurons
Cluster analysis revealed three distinct clusters (i.e. clusters I, II and III) as represented in the hierarchical dendrogram (Figure 3A). Cluster analyses including correlated variables (i.e. decay slope of action potential) showed similar results with no extra subgroup of neurons. Results of cluster analysis were replicated when clustering variables were co-plotted for the different emerging subgroups (Figure 4). Statistical analysis (one-way ANOVA) of electrophysiological parameters from the three emerging clusters revealed significant differences in several properties (Table 2). The majority of slow firing neurons were grouped into cluster I. Cluster I neurons were further classified into different subsets (cluster Ia and Ib) as illustrated in the hierarchical dendrogram (Figure 3A). Cluster Ia neurons exhibited significantly narrower action potentials (t=−2.7, p=0.011) and longer afterhyperpolarization although not significant when compared to cluster Ib slow firing neurons (Table 3, Figure 5). Cluster II neurons exhibited the longest latency to elicit an action potential following a depolarizing pulse (246.5±20.1 ms) ([2,57]=51.42, p<0.001) (Table 2, Figure 6). Cluster III neurons fired at higher firing frequencies in response to suprathreshold depolarization ([2,57]=31.98, p<0.001) (Table 2, Figure 7). Moreover, neurons from cluster III exhibited significantly faster action potential half widths ([2,57]=5.707, p=0.006), rise slope (F[2,57]=22.07, p<0.001), and decay slope(F[2,57]=35.62, p<0.001) (Table 2). These differences were evident when waveforms of action potentials were closely analyzed by superimposing neurons from different groups (data not shown).
Figure 3.

Hierarchical tree plot illustrating the outcome of unsupervised cluster analysis for subjectively classified slow firing neurons. A. Dendrogram revealing three main neuronal subclasses (clusters) of neurons classified as Cluster I (Ia and IB), cluster II and cluster II neurons. Cluster determination was arbitrarily made at linkage distance 2.6 (▶). B. Graphic representation of the location for recorded neurons in MS/DB slices. Notice that Cluster II neurons are less abundant in diagonal band area and appeared closer to midline in MS.
Figure 4.

Firing properties of representative neurons from Cluster I (A), Cluster II (B) and Cluster III (C) responding to threshold and suprathreshold positive current injections from membrane potential set at −80 mV (after injecting 230, 260 and 245 pA negative current respectively). Cluster II neurons exhibited longer latency when held at −80 mV and cluster III neurons fired at higher frequencies when depolarized at suprathreshold levels. Differences in current-frequency relationship are clearly discerned in graph of current vs firing frequency (a4, b4, c4). Discrete groups of neurons emerged after plotting data according to “clustering variables”. Segregation of neuronal clusters is observed in a 3-D plot of these three variables.
Table 2.
Comparison of intrinsic membrane properties amongst slow firing MS/DB neurons in Clusters I, II, and III.
| Neuronal Clusters | Statistic | |||||||
|---|---|---|---|---|---|---|---|---|
| Membrane Properties | I n=33 | II n=10 | III n=17 | ANOVA | Tukey’s Post Hoc | |||
| F | p | I vs II | I vs III | II vs III | ||||
| RMP (mV) | −72.41± 2.84 | −67.40 ± 3.61 | −69.06 ± 3.02 | 0.586 | 0.560 | - | - | - |
| RM (mOhm) | 41.80 ± 2.26 | 34.87 ± 5.28 | 39.05 ± 3.37 | 0.995 | 0.376 | - | - | - |
| τm (ms) | 31.45 ± 2.59 | 33.53 ± 4.79 | 40.39 ± 3.84 | 1.945 | 0.152 | - | - | - |
| AP (mV) | 83.00 ± 2.63 | 83.11± 3.97 | 93.38 ± 4.19 | 2.742 | 0.073 | - | - | - |
| AP threshold (mV) | −55.08 ± 1.49 | −46.14 ± 2.47 | −53.50 ± 1.41 | 1.851 | 0.166 | - | - | - |
| AP latency (ms)* | 66.12 ± 6.23 | 246.47 ± 20.11 | 84.06 ± 15.44 | 51.42 | < 0.001 | < 0.001 | - | < 0.001 |
| AP half width (ms)* | 2.33 ± 0.15 | 2.43 ± 0.29 | 1.7 ± 0.19 | 5.707 | 0.006 | - | 0.008 | 0.027 |
| AP rise slope (mV/ms)* | 58.53 ± 9.41 | 51.36 ± 4.48 | 78.98 ± 11.36 | 22.07 | < 0.001 | - | < 0.001 | < 0.001 |
| AP decay slope (mV/ms)* | −18.38 ± 1.33 | −19.24 ± 2.46 | −38.38 ± 2.27 | 35.62 | < 0.001 | - | < 0.001 | < 0.001 |
| AHP (mV) | 8.14 ± 1.56 | 7.44 ± 0.66 | 7.81 ± 1.11 | 0.425 | 0.656 | - | - | - |
| AHP (ms) | 219.58 ± 19.96 | 176.45 ± 18.64 | 227.04 ± 59.69 | 0.631 | 0.699 | - | - | - |
| F Max (Hz)* | 12.32 ± 0.95 | 11.80 ± 1.17 | 25.34 ± 1.70 | 31.98 | < 0.001 | - | < 0.001 | < 0.001 |
Abbreviations: RMP, resting membrane potential; RM, membrane resistance; τm, membrane time constant; AP, action potential; AHP, afterhyperpolarization potential; F Max, maximum frequency. Data shown as mean ± SEM; F = variance ratio; df = degrees of freedom = 2,57; p = level of significance,
statistically significant, p<0.05.
Table 3.
Comparison of intrinsic membrane properties between slow firing MS/DB neurons in Cluster Ia and Ib.
| Membrane Properties | Cluster Ia n=14 | Cluster Ib n=19 | Student’s t-test | |
|---|---|---|---|---|
| t | p | |||
| RMP (mV) | −71.7 ± 4.74 | −72.94 ± 3.60 | 0.212 | 0.833 |
| RM (mOhm) | 42.06 ± 3.78 | 41.61 ± 2.87 | 0.098 | 0.923 |
| τm (ms) | 31.72 ± 4.94 | 31.26 ± 2.80 | 0.086 | 0.932 |
| AP (mV)* | 89.36 ± 3.05 | 78.32 ± 3.69 | 2.189 | 0.036 |
| AP threshold (mV) | −55.07 ± 2.76 | −55.10 ± 1.73 | −0.440 | 0.663 |
| AP latency (ms) | 62.19 ± 9.23 | 69.01 ± 8.57 | −0.534 | 0.597 |
| AP half width (ms)* | 1.89 ± 0.17 | 2.65 ± 0.21 | −2.700 | 0.011 |
| AP rise slope (mV/ms)* | 56.77 ± 6.08 | 36.73 ± 4.44 | 2.730 | 0.010 |
| AP decay slope (mV/ms)* | −16.65 ± 6.78 | −24.84 ± 1.73 | −6.064 | < 0.001 |
| AHP (mV) | 5.92 ± 0.74 | 8.13 ± 1.03 | −1.617 | 0.116 |
| AHP (ms) | 263.21 ± 38.14 | 187.44 ± 17.94 | 1.957 | 0.059 |
| F Max (Hz) | 13.99 ± 1.07 | 11.09 ± 1.41 | 1.539 | 0.134 |
Abbreviations: RMP, resting membrane potential; RM, membrane resistance; τm, membrane time constant; AP, action potential; AHP, afterhyperpolarization potential; F Max, maximum frequency. Data shown as mean ± SEM; t = ratio of coefficient to SEM; df = degrees of freedom = 31; p= level of significance,
statistically significant, p<0.05.
Figure 5.

Morphological features of representative neurons from Cluster Ia and Ib. Notice that although neurons depicted in A2 and B2 are located in different areas they exhibit similar morphological characteristics as evident in the reconstruction and the dendrite dendrogram. The axons from neurons A1 and B1 appear directed towards the septum midline (arrows). The axons of neurons A2 and B2 were not identified. Firing pattern represented in inset traces. Scale bars as indicated.
Figure 6.

Morphological features of representative neurons from Cluster II (A, B). Notice that both neurons are located near the midline in the MS. The axon in neuron A (arrow) projects towards the midline heading rostrally towards the fornix (* truncated). The major axes of the oval soma appeared perpendicular to the MS midline axis. Dendrites branched in all directions but laterally covering hundreds of microns in the lateral extension of the MS. The neuron in B exhibited different morphological features with less complex dendritic arborization (see dendrogram in inset). Electrophysiological traces revealed long latency for generation of action potential in both cells. Scale bars as indicated.
Figure 7.

Morphological features of representative neurons from Cluster III located in the diagonal band. Neuron A was located in the area of the vertical limb and its dendrites branched radially with an orientation towards the axis of the vertical limb. Similarly, neuron B was recorded near the horizontal limb and its dendrites branched laterally in the same plane of the horizontal limb. Somas in both cases were round/oval and axons were unidentified. Inset: Fast firing phenotype at suprathreshold depolarization steps with no Ih at hyperpolarizing steps. Scale bars as indicated.
Location and morphological diversity of slow firing MS/DB neurons
Neurons grouped according to cluster analysis were differentially segregated to different areas of the MS/DB. Cluster II neurons were predominantly distributed in the medial septum (Figure 3, F[2,54]=3.440, p=0.039). Within cluster I, analysis of location revealed that cluster Ia neurons were predominantly distributed in the medial septum while cluster Ib neurons were more frequently located in the diagonal band (F[2,31]=6.5, p=0.016) (Figure 3B).
Of the thirty-five neurons successfully stained, 26 were classified into cluster I, 4 into cluster II and 5 into cluster III. Neurons exhibiting axons towards the midline were distributed in all the clusters (I, 95%; II, 50% and III, 80%). In some cases, axons were cut at the surface of the slices and were not possible to track. In general, they had a thinner diameter and beaded appearance. In 88% of the cases the axon arose directly from the soma, whereas in the rest of the cases the axon arose from a primary dendrite, at a mean distance of 11.65 ± 5.6 μm from the soma. The general qualitative features of the dendritic trees, suggest that considerable variability in arborization exists among electrophysiologically distinct slow firing clusters as well as in neurons grouped in the same cluster (Figure 5–7). This was confirmed and studied in further detail by a morphometric analysis (see below). No significant differences in morphometric variables were revealed (Table 4). Multipolar cells with fusiform, oval, polygonal and round somata were found in all neuronal clusters.
Table 4.
Comparison of morphological characteristics amongst neurobiotin-filled reconstructed slow firing MS/DB neurons in Clusters I, II and III.
| Neuronal Clusters | Statistic | ||||
|---|---|---|---|---|---|
| Morphological Features | I n=26 | II n=4 | III n=5 | ANOVA | |
| F | p | ||||
| Soma | |||||
| Area (μm2) | 244.55 ± 16.51 | 310.87 ± 92.09 | 255.17 ± 56.98 | 0.71 | 0.50 |
| Perimeter (μm) | 65.5 ± 2.58 | 75.17 ± 12.01 | 66.34 ± 11.31 | 0.61 | 0.55 |
| Shape % of fusiform cells | 8% | 25% | 0% | ||
| Shape % of oval cells | 54% | 25% | 40% | ||
| Shape % polygonal cells | 35% | 50% | 40% | ||
| Shape % round cell | 3% | 0% | 20% | ||
| Axon | |||||
| Total Length (μm) | 359.44 ± 85.57 | 591.35 ± 438.48 | 146.18 ± 58.72 | 0.98 | 0.39 |
| Nodes | 0.47 ± 0.23 | 2 ± 1.41 | 0.25 ± .025 | 2.35 | 0.12 |
| Ends | 1.53 ± 0.27 | 3.00 ± 1.14 | 1.25 ± 0.25 | 1.98 | 0.16 |
| Dendrites | |||||
| Quantity | 3.04 ± 0.30 | 3.75 ± 0.75 | 3.40 ± 0.51 | 0.48 | 0.62 |
| Total Length (μm) | 855.38±1.22 | 1537.35±2.22 | 1325.24±2.84 | 2.05 | 0.15 |
| Mean Length (μm) | 291.25 ± 29.75 | 459.90 ± 91.41 | 324.52 ± 112.43 | 1.71 | 0.20 |
| Nodes | 5.77 ± 0.98 | 11.75 ± 2.71 | 6.20 ± 2.33 | 2.53 | 0.10 |
| Ends | 9.35 ± 1.22 | 15.50 ± 2.22 | 9.60 ± 2.84 | 1.80 | 0.18 |
Data shown as mean ± SEM; F = variance ratio; df = degrees of freedom = 2,32; p = level of significance,
statistically significant, p<0.05.
Clusters of slow firing neurons exhibited different degrees of dendritic branching but no significant differences (total number of branches) were detected amongst clusters (F[2,32]=1.80, p=0.18) probably due to a limited sample size. Nonetheless, Kolmogorov-Smirnov statistical analysis of dendritic distribution determined by Sholl’s analysis indicated that cluster III neurons exhibited more complex arborizations away from the soma center. Additionally, cluster II neurons seem to arborize more in the 60–230 μm radius range although the data was not statistically significant (Figure 8). While slow firing neurons were clearly shown to be morphologically heterogeneous, most morphometric variability was not significant amongst neuronal groups.
Figure 8.
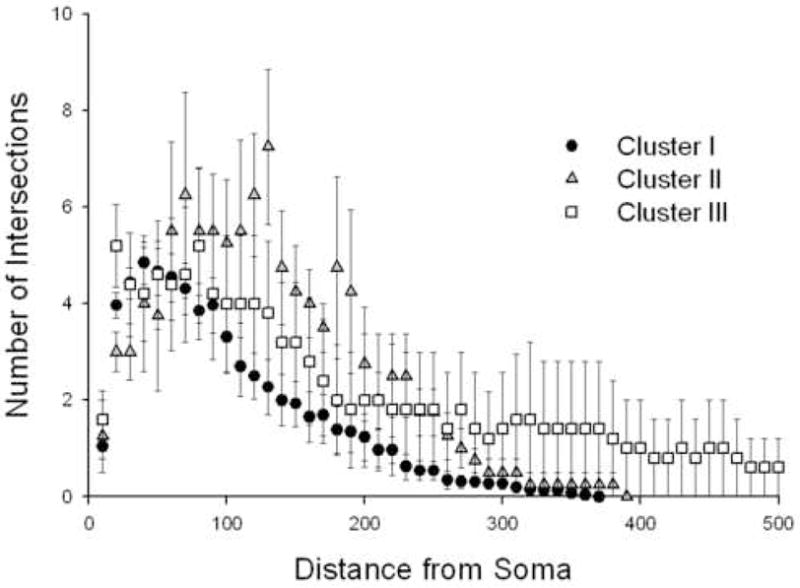
Results of Sholl’s analysis for grouped data revealed a difference in distribution of dendritic arborizations amongst the neurons assigned to clusters I, II and III. Notice that cluster II neurons tend to exhibit a more complex dendritic arborization in a radius of 200 μm from the soma. As depicted, dendritic branches of cluster III neurons extend further away from the soma exceeding the 500 μm radius. Cluster III’s dendritic arborization distribution was significantly different from that of Cluster I (K-S Test, Z=1.562, p=.015) and Cluster II (K-S Test, Z=1.377, p=.045)
Neurotransmitter phenotype of slow firing neurons
Nine p75NTR labeled neurons were included in the cluster analysis revealing that 4 neurons belonged to cluster I, 2 to cluster II, and 3 to cluster III (Figure 9). All the recorded p75NTR-positive neurons fell into one of the three cluster categories of slow firing neurons (e.g. no bursting, no time-dependent inward rectification and no low-threshold fast spiking). This suggests that these three clusters are all comprised of cholinergic neurons. Yet, we cannot discard the possibility that some of the cluster elements may use non cholinergic neurotransmission.
Figure 9.

Anti-p75NTR antibody conjugated with Cy3-192IgG was injected into the septal region and fluorescent neurons recorded to examine firing phenotypes. Notice that p75NTR-labeled neurons (putative cholinergic cells) distributed in the three identified clusters.
DISCUSSION
Unsupervised cluster analysis was used to determine whether the population of MS/DB neurons is composed of highly heterogeneous subgroups of neuronal subtypes or discrete groups of neuronal subtypes displaying a continuum of electrophysiological properties for each firing phenotype (range of individual variations). These methods have recently been used to more objectively characterize neuronal populations in several brain areas such as neocortex and suprachiasmatic nucleus (Azouz et al., 1997, Pennartz et al., 1998, Cauli et al., 2000, Halabisky et al., 2004). A key element of cluster analysis is the selection of variables (electrophysiological parameters) to be considered in creating different subgroups. The idea is to create subgroups of neurons displaying minimal variance (more similar) of electrophysiological parameters within each subgroup and maximum variability of these properties between the subgroups (Halabisky et al., 2004). The weakest aspect of cluster analysis is determining the right number of clusters, a procedure that is a somewhat arbitrary. We adopted the method of the “stopping rule” in which we arbitrarily chose a linkage distance at which clusters were determined (Figure 3A). Usually, this method implies some measure of dissimilarity (distance) among clusters as a classification tool.
The medial septum/diagonal band complex (MS/DB) plays a fundamental role in the generation of theta activity as part of the circuits controlling the septo-hippocampal loop (Toth et al., 1993, Jones et al., 1999, Wu et al., 2000, Sotty et al., 2003, Wu et al., 2003). Several neurological disorders such as Alzheimer’s disease are associated with malfunction or damage of cholinergic networks in the basal forebrain (including MS/DB) (Kesner et al., 1986, Tonnaer et al., 1986, Gibbs, 1998; Colom, 2006). Therefore, accurate characterization of neuronal subtypes involved can provide new avenues to selectively manipulate MS/DB circuit pharmacology for therapeutic purposes (i.e. enhancing firing of a particular group of slow firing neurons). MS/DB neurons express salient electrophysiological, morphological and neurochemical characteristics. These neurons have been electrophysiologically subdivided into several discrete categories: slow firing-firing neurons expressing wide action potentials and pronounced sAHP; fast-spiking neurons also expressing pronounced fast duration action potentials and fast AHP; regular firing neurons and burst firing neurons which were further classified as type I and II (Henderson et al., 2001). Immunohistochemical characterization revealed that slow firing neurons express markers of cholinergic neurons such as the acetylcholine (Ach) degradation enzyme acetylcholinesterase, Ach synthesizing enzyme choline acetyl transferase (ChAT) (Henke and Lang, 1983, Brashear et al., 1986, Griffith and Matthews, 1986, Gaykema et al., 1991) and p75, a specific growth factor receptor which is selectively expressed in basal forebrain cholinergic neurons (Hartig et al., 2002). In a recent study, whole-cell patch clamp combined with retrograde reverse transcriptase-polymerase chain reaction (RT-PCR) was used to determine the correlation of specific firing phenotypes with the expression of different mRNAs of enzymes synthesizing neurotransmitters (Sotty et al., 2003). A distinct finding in this research was the in vitro characterization of the vesicular glutamate transporter 2 neurons (putative glutamatergic neurons) which express either slow firing or a newly described cluster firing phenotype. However, due to methodological limitations, this study did not explore neuronal morphology for the different firing phenotypes. Subjectively, we can describe slow firing neuronal populations as a subtype of MS/DB neurons exhibiting a continuum of electrophysiological properties. These variations may be related to differential levels of ion channel expressions or specific connectivity patterns in the MS/DB network.
Heterogeneity of firing properties within neuronal subtypes in the MS/DB has previously been noted. For instance, previous morphological studies, noted that neurons in the MS/DB including the cholinergic population do not comprise a homogeneous population (Henderson, 1981, Bigl et al., 1982, Ingham et al., 1985, Dinopoulos et al., 1986, Dinopoulos et al., 1988, Henderson et al., 2001). Accordingly, it was argued whether anatomical variations were associated with any particular physiological function or electrophysiological properties (Dinopoulos et al., 1988). Differences in firing phenotype could represent differences in functional states of the same neuron. In our study, we fail to correlate any emerging cluster subgroup with a particular morphological type. It is generally accepted that slow firing neurons express predominantly a cholinergic phenotype (Matthews and Lee, 1991, Jones et al., 1999). However, recently described septal glutamatergic neurons (Colom et al., 2005) may also express a slow firing phenotype (Sotty et al., 2003; Manseau et al., 2005). Furthermore, cholinergic basal forebrain neurons are capable of releasing glutamate as a cotransmitter (Allen et al., 2006). Other studies have shown the coexistence of GABA and ChAT in a small number of basal forebrain neurons (Brashear et al., 1986), as well as mRNA for ChAT and GAD 65/67 (Sotty et al., 2003). Previously, our lab determined that approximately 6% of cholinergic neurons in the medial septum coexpressed GABA, glutamate or both (Castaneda et al, 2005). In addition to GABA and glutamate, cholinergic neurons may coexpress other neuropeptidees such as NAAG (Forloni et al, 1987). Further studies are necessary to elucidate whether determined neuronal subtypes express different markers for neurochemical phenotypes. Cluster III neurons fired at higher frequencies and exhibited shorter duration action potentials which indicates that they may represent a distinct group of neurons expressing this mixed neurochemical phenotype. Interestingly, neurons that are both ChAT and GAD67- positive display electrophysiological properties of either burst-firing or fast-firing neurons (Sotty et al., 2003).
Cluster analysis of slow firing neurons revealed three main clusters (subtypes) of neurons. The cluster III subtype exhibited higher firing frequencies and faster action potentials. Accordingly, neurons from cluster I and cluster II represent a sort of “true” slow firing populations however they differ in the latency to fire and in their afterhyperpolarizing potentials. The latency may be influenced by a different subset and magnitude of potassium currents (i.e. IA) as previously shown for slow firing neurons in other regions (Connor and Stevens, 1971). A heterogeneous population of slow firing MS/DB neurons may reflect diversity in function, expression of different neurochemical markers, ion channels, or dynamic shifts in firing behaviors. The fact that cluster II neurons were more frequently located in the medial septum, which preferentially projects to the hippocampus, suggests that connectivity may constitute an important factor in the electrophysiological categorization of MS/DB slow firing neurons. The lack of statistical differences in the morphological characteristics among the different clusters may be related to the reduced number of neurons included in the analysis. An extended morphological study needs to be performed to address this problem. The finding of cholinergic markers (e.g. p75 receptors) in neurons belonging to each group suggests that acetylcholine is used as a neurotransmitter in all clusters. However, differential expression of other transmitters or modulators cannot be discarded. Recognition of distinctive firing modalities in the same electrophysiologically identified subgroup of neurons is relevant to understanding the intricate physiology of septal, septo-hippocampal and septo-neocortical circuits. It remains to be confirmed whether such a phenotype actually exists or can be recorded in vivo. Future experiments will be dedicated to determining whether neurons projecting to hippocampus or cortex differ in their electrophysiological or morphological properties. This strategy will attempt to determine the role of connectivity in shaping the functional properties of septal neurons.
Acknowledgments
We thank Dr. Brian H. Bland (University of Calgary) for graciously reviewing the manuscript and providing us with valuable insights. Grant Sponsor: NIH Grants: # NS4271 (L.V. Colom); # NSG M068855 (L.V. Colom & E.R. Garrido-Sanabria); # P20MD001091 and # P20MD000161 funded by NIH/NCMHD (RIMI) and also by NIH/NCMHD (EXPORT) (L.V Colom and E.R. Garrido-Sanabria) as well as MBRS-RISE grant #1R25Gm06592501A1.
Abbreviations
- ACSF
artificial cerebrospinal fluid
- ChAT
choline acetyl transferase
- DIC-IR
infrared differential interference contrast optic
- GABA
gamma-aminobutyric acid
- IACUC
institutional animal care and use committee
- Ih
hyperpolarization-activated cation current
- i.p
intraperitoneal
- MS/DB
medial septum/vertical limb of the diagonal band of Broca
- PB
sodium phosphate-buffered
- p75NTR
antiCy3-192 IgG
- AP
action potential
- AHP
afterhyperpolarization potential
- sAHP
slow post-spike afterhyperpolarization potential
- F Max
maximum firing frequency
- RMP
resting membrane potential
- RM
input membrane resistance
- τm
membrane time constant
- RN
range normalization scores
- Ach
acetylcholine
- NAAG
N-acetyl aspartylglutamic acid
- GAD
glutamic acid decarboxylase
Footnotes
Publisher's Disclaimer: This is a PDF file of an unedited manuscript that has been accepted for publication. As a service to our customers we are providing this early version of the manuscript. The manuscript will undergo copyediting, typesetting, and review of the resulting proof before it is published in its final citable form. Please note that during the production process errors may be discovered which could affect the content, and all legal disclaimers that apply to the journal pertain.
LITERATURE CITED
- Allen TG, Abogadie FC, Brown DA. Simultaneous release of glutamate and acetylcholine from single magnocellular “cholinergic” basal forebrain neurons. J Neurosci. 2006;26(5):1588–95. doi: 10.1523/JNEUROSCI.3979-05.2006. [DOI] [PMC free article] [PubMed] [Google Scholar]
- Anderson RE, Black WC, Hair JFJ, Tatham R. Multivariate Data Analysis. Prentice Hall; Lebanon, Indiana: 1998. [Google Scholar]
- Azouz R, Gray CM, Nowak LG, McCormick DA. Physiological properties of inhibitory interneurons in cat striate cortex. Cereb Cortex. 1997;7:534–545. doi: 10.1093/cercor/7.6.534. [DOI] [PubMed] [Google Scholar]
- Bernander O, Douglas RJ, Martin KA, Koch C. Synaptic background activity influences spatiotemporal integration in single pyramidal cells. Proc Natl Acad Sci U S A. 1991;88:11569–11573. doi: 10.1073/pnas.88.24.11569. [DOI] [PMC free article] [PubMed] [Google Scholar]
- Bigl V, Woolf NJ, Butcher LL. Cholinergic projections from the basal forebrain to frontal, parietal, temporal, occipital, and cingulate cortices: a combined fluorescent tracer and acetylcholinesterase analysis. Brain Res Bull. 1982;8:727–749. doi: 10.1016/0361-9230(82)90101-0. [DOI] [PubMed] [Google Scholar]
- Brashear HR, Zaborszky L, Heimer L. Distribution of GABAergic and cholinergic neurons in the rat diagonal band. Neuroscience. 1986;17:439–451. doi: 10.1016/0306-4522(86)90258-7. [DOI] [PubMed] [Google Scholar]
- Brazhnik ES, Fox SE. Intracellular recordings from medial septal neurons during hippocampal theta rhythm. Exp Brain Res. 1997;114:442–453. doi: 10.1007/pl00005653. [DOI] [PubMed] [Google Scholar]
- Brazhnik ES, Fox SE. Action potentials and relations to the theta rhythm of medial septal neurons in vivo. Exp Brain Res. 1999;127:244–258. doi: 10.1007/s002210050794. [DOI] [PubMed] [Google Scholar]
- Castaneda MT, Sanabria ER, Hernandez S, Ayala A, Reyna TA, Wu JY, Colom LV. Glutamic acid decarboxylase isoforms are differentially distributed in the septal region of the rat. Neurosci Res. 2005;52:107–119. doi: 10.1016/j.neures.2005.02.003. [DOI] [PubMed] [Google Scholar]
- Cauli B, Porter JT, Tsuzuki K, Lambolez B, Rossier J, Quenet B, Audinat E. Classification of fusiform neocortical interneurons based on unsupervised clustering. Proc Natl Acad Sci U S A. 2000;97:6144–6149. doi: 10.1073/pnas.97.11.6144. [DOI] [PMC free article] [PubMed] [Google Scholar]
- Colom LV. Septal networks: relevance to theta rhythm, epilepsy, and Alzheimer’s Disease. J Neurochem. 2006;96:609–623. doi: 10.1111/j.1471-4159.2005.03630.x. [DOI] [PubMed] [Google Scholar]
- Colom LV, Castaneda MT, Reyna T, Hernandez S, Garrido-Sanabria E. Characterization of medial septal glutamatergic neurons and their projection to the hippocampus. Synapse. 2005;58:161–164. doi: 10.1002/syn.20184. [DOI] [PubMed] [Google Scholar]
- Connor JA, Stevens CF. Inward and delayed outward membrane currents in isolated neural somata under voltage clamp. J Physiol. 1971;213:1–19. doi: 10.1113/jphysiol.1971.sp009364. [DOI] [PMC free article] [PubMed] [Google Scholar]
- Dinopoulos A, Parnavelas JG, Eckenstein F. Morphological characterization of cholinergic neurons in the horizontal limb of the diagonal band of Broca in the basal forebrain of the rat. J Neurocytol. 1986;15:619–628. doi: 10.1007/BF01611861. [DOI] [PubMed] [Google Scholar]
- Dinopoulos A, Parnavelas JG, Uylings HB, Van Eden CG. Morphology of neurons in the basal forebrain nuclei of the rat: a Golgi study. J Comp Neurol. 1988;272:461–474. doi: 10.1002/cne.902720402. [DOI] [PubMed] [Google Scholar]
- Forloni G, Grzanna R, Blakely RD, Coyle JT. Co-localization of N-acetyl-aspartyl-glutamate in central cholinergic, noradrenergic, and seroteonergic neurons. Synapse. 1987;1:455–460. doi: 10.1002/syn.890010509. [DOI] [PubMed] [Google Scholar]
- Gaykema RP, Gaal G, Traber J, Hersh LB, Luiten PG. The basal forebrain cholinergic system: efferent and afferent connectivity and long-term effects of lesions. Acta Psychiatr Scand Suppl. 1991;366:14–26. doi: 10.1111/j.1600-0447.1991.tb03105.x. [DOI] [PubMed] [Google Scholar]
- Gibbs RB. Impairment of basal forebrain cholinergic neurons associated with aging and long-term loss of ovarian function. Exp Neurol. 1998;151:289–302. doi: 10.1006/exnr.1998.6789. [DOI] [PubMed] [Google Scholar]
- Gorelova N, Reiner PB. Role of the afterhyperpolarization in control of discharge properties of septal cholinergic neurons in vitro. J Neurophysiol. 1996;75:695–706. doi: 10.1152/jn.1996.75.2.695. [DOI] [PubMed] [Google Scholar]
- Griffith WH. Membrane properties of cell types within guinea pig basal forebrain nuclei in vitro. J Neurophysiol. 1988;59:1590–1612. doi: 10.1152/jn.1988.59.5.1590. [DOI] [PubMed] [Google Scholar]
- Griffith WH, Matthews RT. Electrophysiology of AChE-positive neurons in basal forebrain slices. Neurosci Lett. 1986;71:169–174. doi: 10.1016/0304-3940(86)90553-7. [DOI] [PubMed] [Google Scholar]
- Griffith WH, Sim JA, Matthews RT. Electrophysiologic characteristics of basal forebrain neurons in vitro. Adv Exp Med Biol. 1991;295:143–155. doi: 10.1007/978-1-4757-0145-6_6. [DOI] [PubMed] [Google Scholar]
- Halabisky B, Shen F, Huguenard JR, Prince DA. Electrophysiological classification of somatostatin-positive interneurons in mouse sensorimotor cortex. J Neurophysiol. 2006;96:834–845. doi: 10.1152/jn.01079.2005. [DOI] [PubMed] [Google Scholar]
- Halabisky BE, Huguenard JR, Prince DA. Electrophysiological classification of somatostatin-positive interneurons in somatosensory cortex. Proceedings of the Society of Neuroscience; San Diego. 2004. p. 29. Abstract 272. [Google Scholar]
- Hartig W, Seeger J, Naumann T, Brauer K, Bruckner G. Selective in vivo fluorescence labelling of cholinergic neurons containing p75(NTR) in the rat basal forebrain. Brain Res. 1998;808:155–165. doi: 10.1016/s0006-8993(98)00792-6. [DOI] [PubMed] [Google Scholar]
- Hartig W, Varga C, Kacza J, Grosche J, Seeger J, Luiten PG, Brauer K, Harkany T. In vivo labeling of rabbit cholinergic basal forebrain neurons with fluorochromated antibodies. Neuroreport. 2002;13:1395–1398. doi: 10.1097/00001756-200208070-00009. [DOI] [PubMed] [Google Scholar]
- Henderson Z. A projection from acetylcholinesterase-containing neurones in the diagonal band to the occipital cortex of the rat. Neuroscience. 1981;6:1081–1088. doi: 10.1016/0306-4522(81)90072-5. [DOI] [PubMed] [Google Scholar]
- Henderson Z, Morris NP, Grimwood P, Fiddler G, Yang HW, Appenteng K. Morphology of local axon collaterals of electrophysiologically characterised neurons in the rat medial septal/diagonal band complex. J Comp Neurol. 2001;430:410–432. doi: 10.1002/1096-9861(20010212)430:3<410::aid-cne1040>3.0.co;2-i. [DOI] [PubMed] [Google Scholar]
- Henke H, Lang W. Cholinergic enzymes in neocortex, hippocampus and basal forebrain of non-neurological and senile dementia of Alzheimer-type patients. Brain Res. 1983;267:281–291. doi: 10.1016/0006-8993(83)90880-6. [DOI] [PubMed] [Google Scholar]
- Ingham CA, Bolam JP, Wainer BH, Smith AD. A correlated light and electron microscopic study of identified cholinergic basal forebrain neurons that project to the cortex in the rat. J Comp Neurol. 1985;239:176–192. doi: 10.1002/cne.902390205. [DOI] [PubMed] [Google Scholar]
- Jones GA, Norris SK, Henderson Z. Conduction velocities and membrane properties of different classes of rat septohippocampal neurons recorded in vitro. J Physiol. 1999;517(Pt 3):867–877. doi: 10.1111/j.1469-7793.1999.0867s.x. [DOI] [PMC free article] [PubMed] [Google Scholar]
- Kesner RP, Crutcher KA, Measom MO. Medial septal and nucleus basalis magnocellularis lesions produce order memory deficits in rats which mimic symptomatology of Alzheimer’s disease. Neurobiol Aging. 1986;7:287–295. doi: 10.1016/0197-4580(86)90009-6. [DOI] [PubMed] [Google Scholar]
- Knapp JA, Morris NP, Henderson Z, Matthews RT. Electrophysiological characteristics of non-bursting, glutamate decarboxylase messenger RNA-positive neurons of the medial septum/diagonal band nuclei of guinea-pig and rat. Neuroscience. 2000;98:661–668. doi: 10.1016/s0306-4522(00)00137-8. [DOI] [PubMed] [Google Scholar]
- Lee MG, Hassani OK, Alonso A, Jones BE. Cholinergic basal forebrain neurons burst with theta during waking and paradoxical sleep. J Neurosci. 2005;25:4365–4369. doi: 10.1523/JNEUROSCI.0178-05.2005. [DOI] [PMC free article] [PubMed] [Google Scholar]
- Manseau F, Danik M, Williams S. A functional glutamatergic neurone network in the medial septum and diagonal band area. J Physiol. 2005;566:865–884. doi: 10.1113/jphysiol.2005.089664. [DOI] [PMC free article] [PubMed] [Google Scholar]
- Markram H, Segal M. Electrophysiological characteristics of cholinergic and non-cholinergic neurons in the rat medial septum-diagonal band complex. Brain Res. 1990;513:171–174. doi: 10.1016/0006-8993(90)91106-q. [DOI] [PubMed] [Google Scholar]
- Matthews RT, Lee WL. A comparison of extracellular and intracellular recordings from medial septum/diagonal band neurons in vitro. Neuroscience. 1991;42:451–462. doi: 10.1016/0306-4522(91)90388-5. [DOI] [PubMed] [Google Scholar]
- Morris NP, Harris SJ, Henderson Z. Parvalbumin-immunoreactive, fast-spiking neurons in the medial septum/diagonal band complex of the rat: intracellular recordings in vitro. Neuroscience. 1999;92:589–600. doi: 10.1016/s0306-4522(99)00026-3. [DOI] [PubMed] [Google Scholar]
- Nowak LG, Azouz R, Sanchez-Vives MV, Gray CM, McCormick DA. Electrophysiological classes of cat primary visual cortical neurons in vivo as revealed by quantitative analyses. J Neurophysiol. 2003;89:1541–1566. doi: 10.1152/jn.00580.2002. [DOI] [PubMed] [Google Scholar]
- Paxinos G, Watson C. The rat brain in stereotaxic coordinates. 4. Academic Press; New York: 1998. [DOI] [PubMed] [Google Scholar]
- Pennartz CM, De Jeu MT, Geurtsen AM, Sluiter AA, Hermes ML. Electrophysiological and morphological heterogeneity of neurons in slices of rat suprachiasmatic nucleus. J Physiol. 1998;506(Pt 3):775–793. doi: 10.1111/j.1469-7793.1998.775bv.x. [DOI] [PMC free article] [PubMed] [Google Scholar]
- Sanabria ER, Su H, Yaari Y. Initiation of network bursts by Ca2+-dependent intrinsic bursting in the rat pilocarpine model of temporal lobe epilepsy. J Physiol. 2001;532:205–216. doi: 10.1111/j.1469-7793.2001.0205g.x. [DOI] [PMC free article] [PubMed] [Google Scholar]
- Schaap J, Bos NP, de Jeu MT, Geurtsen AM, Meijer JH, Pennartz CM. Neurons of the rat suprachiasmatic nucleus show a circadian rhythm in membrane properties that is lost during prolonged whole-cell recording. Brain Res. 1999;815:154–166. doi: 10.1016/s0006-8993(98)01025-7. [DOI] [PubMed] [Google Scholar]
- Sholl DA. Dendritic organization in the neurons of the visual and motor cortices of the cat. J Anat. 1953;87:387–406. [PMC free article] [PubMed] [Google Scholar]
- Sotty F, Danik M, Manseau F, Laplante F, Quirion R, Williams S. Distinct electrophysiological properties of glutamatergic, cholinergic and GABAergic rat septohippocampal neurons: novel implications for hippocampal rhythmicity. J Physiol. 2003;551:927–943. doi: 10.1113/jphysiol.2003.046847. [DOI] [PMC free article] [PubMed] [Google Scholar]
- Thinschmidt JS, Frazier CJ, King MA, Meyer EM, Papke RL. Medial septal/diagonal band cells express multiple functional nicotinic receptor subtypes that are correlated with firing frequency. Neurosci Lett. 2005;389:163–168. doi: 10.1016/j.neulet.2005.07.038. [DOI] [PubMed] [Google Scholar]
- Tonnaer JA, Lammers AJ, Wieringa JH, Steinbusch HW. Immunohistochemical evidence for degeneration of cholinergic neurons in the forebrain of the rat following injection of AF64A-picrylsulfonate into the dorsal hippocampus. Brain Res. 1986;370:200–203. doi: 10.1016/0006-8993(86)91125-x. [DOI] [PubMed] [Google Scholar]
- Toth K, Borhegyi Z, Freund TF. Postsynaptic targets of GABAergic hippocampal neurons in the medial septum-diagonal band of broca complex. J Neurosci. 1993;13:3712–3724. doi: 10.1523/JNEUROSCI.13-09-03712.1993. [DOI] [PMC free article] [PubMed] [Google Scholar]
- Wu M, Newton SS, Atkins JB, Xu C, Duman RS, Alreja M. Acetylcholinesterase inhibitors activate septohippocampal GABAergic neurons via muscarinic but not nicotinic receptors. J Pharmacol Exp Ther. 2003;307:535–543. doi: 10.1124/jpet.103.052514. [DOI] [PubMed] [Google Scholar]
- Wu M, Shanabrough M, Leranth C, Alreja M. Cholinergic excitation of septohippocampal GABA but not cholinergic neurons: implications for learning and memory. J Neurosci. 2000;20:3900–3908. doi: 10.1523/JNEUROSCI.20-10-03900.2000. [DOI] [PMC free article] [PubMed] [Google Scholar]